Altseason AnalysisTo determine whether we're approaching a true Altseason, we're analyzing the macro relationship between Bitcoin Dominance (BTC.D) and Total 2 (the total crypto market cap excluding Bitcoin). This comparison has consistently revealed where capital is flowing and helps signal shifts in market cycles.
Current Market Structure
BTC Dominance: Currently at 64% and testing resistance zone.
A breakdown below 57% could trigger fresh capital rotation into alts.
Total 2: Hovering near 1.2T ; watching for breakout confirmation.
What Triggers an Altseason?
BTC stability or slow upward grind: Altcoins thrive when Bitcoin is stable not crashing, not parabolic.
BTC.D Breakdown: Often the first real signal. Look for confluence with Total 2 breakout.
Capital Rotation: Watch Ethereum and majors big cap — they usually lead before microcaps follow.
BTC.D Breakdown: Often the first real signal. Look for confluence with Total 2 breakout.
$5 Trillion??
Breakout above $1.7T ATH in Total 2 opens the door for exponential price discovery.
Key resistance zones: $2T → $3.5T → $5T
Watch for volume surge + BTC.D breakdown for strong confirmation.
Caution:
Not every BTC.D dip leads to an Altseason fakeouts happen. Confirm with Total 2 strength and sector rotation.
BTCUSD.PM trade ideas

Cycle Last LegThis present cycle is near its end. Pico top will arrive soon, probably by the end of November. BTC is currently ranging (103-109) forming a new base at 106, which is the current point of control. The start of the next and final up leg should start early July, so we have less than 2 weeks to remain patient.
Stand fast. Keep faith. Remain vigilant.

Bitcoin downside all but confirmed, sub 100k next- follow up analysis on this one:
- with the original analysis posted in late May, more than a month later and Bitcoin is still struggling near ATH levels
- with weekly bearish divergence now confirmed, odds of a downside move are very high
- Iran v Israel conflict acting as a strong headwind for all markets, should the USA get involved I expect that effect to increase tenfold
Needs to be said that a pullback to 90 or even the mid 80k region would still constitute a higher low on the very large time-frames. Structurally wise, as long as BTC is above 75k, the macro trend is still one of a bull nature.

Short-Term BTC Short Setup Bitcoin is currently showing signs of completing a corrective wave (4) in a potential Elliott Wave structure. The current rising wedge (ABCDE) pattern suggests a likely short-term breakdown toward the $101,000–$100,000 support zone. This short position aligns with the ongoing short-term bearish momentum (wave 5 expected), but within a broader bullish trend. Long-term outlook remains positive, with the potential for a strong continuation upward once the correction is complete. ;D

BTCUSD: Trading Signal From Our Team
BTCUSD
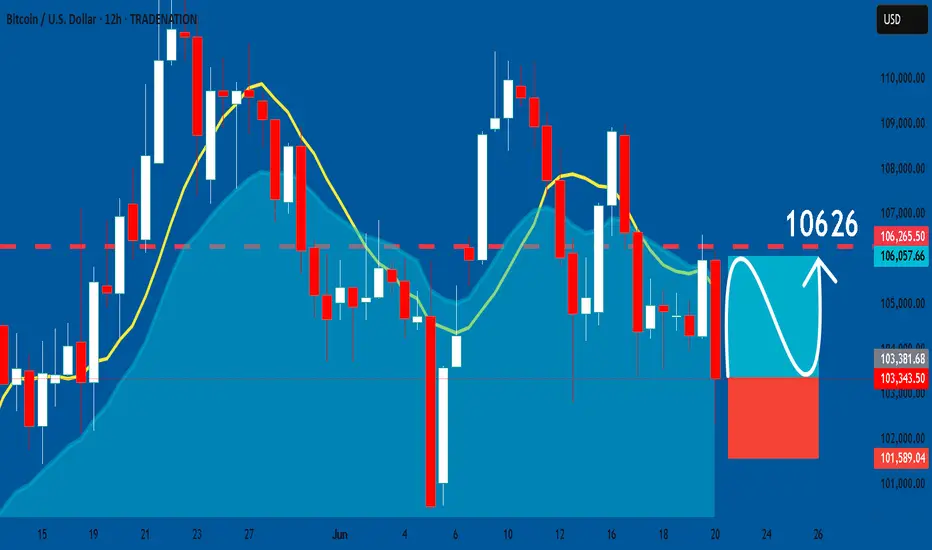
- Classic bullish formation
- Our team expects pullback
SUGGESTED TRADE:
Swing Trade
Long BTCUSD
Entry - 10334
Sl - 10158
Tp - 10626
Our Risk - 1%
Start protection of your profits from lower levels
Disclosure: I am part of Trade Nation's Influencer program and receive a monthly fee for using their TradingView charts in my analysis.
❤️ Please, support our work with like & comment! ❤️
BRIEFING Week #25 : Heading into Summer ModeHere's your weekly update ! Brought to you each weekend with years of track-record history..
Don't forget to hit the like/follow button if you feel like this post deserves it ;)
That's the best way to support me and help pushing this content to other users.
Kindly,
Phil

Bitcoin – Ritual Latency & Tactical Tension.⊢
⟁ BTC/USD – Binance – (CHART: 1H) – (June 21, 2025).
⟐ Analysis Price: $103,909.52.
⊢
⨀ I. Temporal Axis – Strategic Interval – (H1):
▦ EMA9 – ($103,783.82):
∴ The price oscillates around EMA9 with marginal bullish slope;
∴ Two candle rejections confirmed the EMA9 as a reactive short-term axis;
∴ Current close is above, but lacking directional follow-through.
✴️ Conclusion: Momentum attempt, yet unsupported – fragility persists.
⊢
▦ EMA21 – ($103,869.74):
∴ Flattened trajectory overlapping EMA9;
∴ Indicates tactical compression – a latency band rather than trendline;
∴ No breakout confirmation.
✴️ Conclusion: Equilibrium zone – direction undecided.
⊢
▦ EMA50 – ($104,212.18):
∴ Serves as immediate dynamic resistance;
∴ Price has not closed above since June 20, 13:00 UTC;
∴ Requires sustained move to invalidate micro-downtrend.
✴️ Conclusion: Key reversal barrier – price remains below structural trigger.
⊢
▦ SMA100 – ($104,552.65):
∴ Downsloping, acting as mid-term ceiling;
∴ No candle engagement in recent sessions;
∴ Confluence zone with EMA50 adds density.
✴️ Conclusion: Inertial resistance zone – trend continuity until breach.
⊢
▦ SMA200 – ($105,197.18):
∴ Highest structural ceiling on H1;
∴ Remains untouched, reinforcing broader tactical bearish bias.
✴️ Conclusion: SMA200 maintains bearish structure – trend remains capped.
⊢
▦ Bollinger Bands - (20,2):
∴ Bands tightened – low volatility configuration;
∴ Upper band slightly expands – minor opening signal;
∴ Price contacts upper range without strength.
✴️ Conclusion: Potential breakout pattern – requires volume ignition.
⊢
▦ RSI (14, smoothed by EMA9) – (11.00 | Avg: 13.85):
∴ RSI at historical low – indicative of exhaustion rather than momentum;
∴ EMA of RSI confirms suppressed structure;
∴ Hidden divergence plausible but not confirmed.
✴️ Conclusion: Latent reversal conditions – needs confirmation from RSI reclaim.
⊢
▦ MACD (12,26,9) – (MACD: 88.35 | Signal: -159.25 | Histogram: -247.60):
∴ Histogram remains negative but is narrowing;
∴ MACD line curling upward, approaching signal;
∴ No crossover yet – early recovery signal under surveillance.
✴️ Conclusion: Bullish divergence forming – reversal not validated.
⊢
▦ ATR (14, RMA) – (372.44):
∴ Volatility decreasing after a local spike;
∴ Range-bound structure indicates compression, not impulse.
✴️ Conclusion: Tactical latency – volatility may reawaken post-volume.
⊢
▦ Volume (21):
∴ Faint increase in last bullish candle – still below strategic threshold;
∴ Lacks institutional confirmation.
✴️ Conclusion: Spot activity insufficient – neutral, vulnerable structure.
⊢
🜎 Strategic Insight – Technical Oracle:
∴ H1 presents structural compression between EMA9/21/50, confirming tactical latency;
∴ RSI at deep oversold – signal of exhaustion, not yet momentum;
∴ Bollinger and MACD show early signs of kinetic preparation;
∴ The market is postured, not reactive – awaiting a directional event.
✴️ Tactical View: Structurally Neutral – Momentum Suspended, entry only upon RSI/Volume confirmation and MACD validation.
⊢
∫ II. On-Chain Intelligence – (Source: CryptoQuant):
∴ Update as of June 21, 2025 – Synchronized to H1 Structural Reading.
▦ Exchange Netflow Total – (All Exchanges) – (+692 BTC):
∴ Positive net inflow detected over 24h;
∴ Suggests moderate sell-side liquidity entering exchanges;
∴ Reflects defensive posturing, not panic-driven behavior.
✴️ Conclusion: Mild bearish pressure – not sufficient to invalidate structural base.
⊢
▦ Spot Taker CVD - (Cumulative Volume Delta, 90-day):
∴ Dominance of Taker Sell Volume confirmed – aggressive sellers remain in control;
∴ Pattern consistent over the last 6 sessions;
∴ No divergence between volume behavior and price structure.
✴️ Conclusion: Market remains tactically sell-biased – momentum driven by taker aggression.
⊢
▦ Spent Output Profit Ratio (SOPR) – (1.009):
∴ Marginally above 1.00 – coins being spent in mild profit;
∴ Absence of capitulation, but also no sign of deep conviction among holders;
∴ Stable rotation, not breakout-driven.
✴️ Conclusion: Structural neutrality – market is churning without direction.
⊢
▦ Adjusted SOPR (aSOPR) – (≈1.00):
∴ Flat – confirms lack of distribution or panic;
∴ Historically aligns with consolidation regimes.
✴️ Conclusion: Supply behavior is balanced – trend-neutral reading.
⊢
▦ Open Interest – All Exchanges – ($34.01B):
∴ Remains elevated – indicative of speculative leverage;
∴ Elevated risk of liquidation cascade on directional volatility;
∴ OI rising faster than spot volume = synthetic exposure dominating.
✴️ Conclusion: Market structurally exposed – fragile to external triggers.
⊢
▦ Funding Rate – All Exchanges – (-0.003):
∴ Slightly negative – shorts funding longs;
∴ Suggests bearish bias among leveraged participants;
∴ Conditions ripe for short squeeze if spot demand increases.
✴️ Conclusion: Contrarian setup building – tactical upside risk exists.
⊢
🜎 Strategic Insight – On-Chain Oracle:
∴ Metrics reflect a market under cautious speculative tension;
∴ No broad liquidation, no long-term holder exit – base intact;
∴ Taker dominance and leverage build-up suggest reactive positioning;
∴ System is neutral-leaning fragile – vulnerable to both triggers and traps.
✴️ Tactical Note: "Structurally Stable – Tactically Unsettled"
⊢
⧉ III. Contextvs Macro–Geopoliticvs – Interflux Economicus:
∴ Macro Landscape Reference – June 21, 2025.
▦ United States – Federal Policy & Risk Layer:
∴ Treasury Yield Curve remains slightly positive (+0.44%), removing short-term recession signal;
∴ 10Y yield elevated at 4.42% – reflects sustained inflation resistance and risk demand;
∴ Fed maintains QT stance – no rate cuts expected before September;
∴ Tension with Iran intensifying – military rhetoric entering fiscal discourse.
✴️ Conclusion: U.S. macro acts as compression catalyst – neutral on surface, volatile underneath.
⊢
▦ Strategic Bitcoin Reserve – (Executive Order – Trump):
∴ Recent Executive Order establishes BTC as sovereign asset class;
∴ Adds policy-level legitimacy to institutional accumulation;
∴ Reflects shift from “hedge” to “strategic reserve logic”.
✴️ Conclusion: Structural bull signal – narrative transition confirmed.
⊢
▦ China – Internal Stimulus & Soft Deflation:
∴ PPI negative at -3.3%, Retail Sales up 6.4% – stimulus-driven divergence;
∴ Fiscal revenue declining YTD – systemic drag despite easing;
∴ Not a current volatility driver.
✴️ Conclusion: China is neutral to crypto – reactive, not directive.
⊢
▦ European Union – Disinflation & Monetary Drift:
∴ HICP falls to 1.9%, ECB cuts deposit rate to 2.00%;
∴ PMI Composite < 50 – economic contraction quietly progressing;
∴ Forward guidance hesitant.
✴️ Conclusion: EU remains marginal – supportive for risk, but not catalytic.
⊢
▦ Global Fragmentation & SWIFT Erosion:
∴ Geopolitical blocs continue diverging – dollar-reliant systems weakening;
∴ Bitcoin seen increasingly as transactional hedge in sanctioned environments;
∴ De-dollarization dynamic accelerating.
✴️ Conclusion: Bitcoin positioned as neutral monetary rail – volatility shield and escape valve.
⊢
🜎 Strategic Insight – Interflux Macro Oracle:
∴ U.S. remains the dominant macro variable – its monetary and geopolitical stance defines volatility posture;
∴ Bitcoin structurally benefits from institutional legitimacy, but tactically suspended by risk-off layers;
∴ The system is internally calm, externally tense – volatility is downstream of Powell and geopolitical shock.
⊢
⌘ Codicillus Silentii – Strategic Note:
∴ Temporal structure remains compressed, yet technically reactive;
∴ On-chain behavior supports latent structural integrity, but reveals synthetic tension;
∴ Macro axis introduces dual asymmetry – stability in policy, instability in conflict;
∴ The system is in latency – not due to certainty, but due to mutual hesitation.
⊢
𓂀 Stoic-Structural Interpretation:
▦ Structurally Bullish.
∴ The underlying structure - long-term moving averages, exchange reserves, macro narrative, and holder behavior - remains intact and upward-biased;
∴ There is no technical breakdown or structural disassembly;
∴ It is the silent foundation - the “floor” of the chart remains elevated.
⊢
▦ Tactically Suspended.
∴ Although the structure points to strength, the present moment neither demands nor validates action;
∴ There is no volume, no ignition signal, no confirmation flow;
∴ Thus, the tactic is suspended - the trader (or observer) is in a disciplined state of observation, not execution.
⊢
⧉
⚜️ Magister Arcanvm (𝟙⟠) – Vox Primordialis!
𓂀 Wisdom begins in silence. Precision unfolds in strategy.
⧉
⊢

Bitcoin (BTC/USD) 2-Hour Candlestick Chart2-hour candlestick chart displays the recent price movement of Bitcoin (BTC) against the U.S. Dollar (USD), showing a current price of $103,904.89 with a gain of $595.12 (+0.58%) as of 01:22:41. The chart highlights a volatile period with significant price fluctuations, including a sharp drop followed by a recovery, and includes key price levels such as $106,099.25 and $102,803.95. The chart also features a highlighted support zone in pink and a resistance zone in light blue


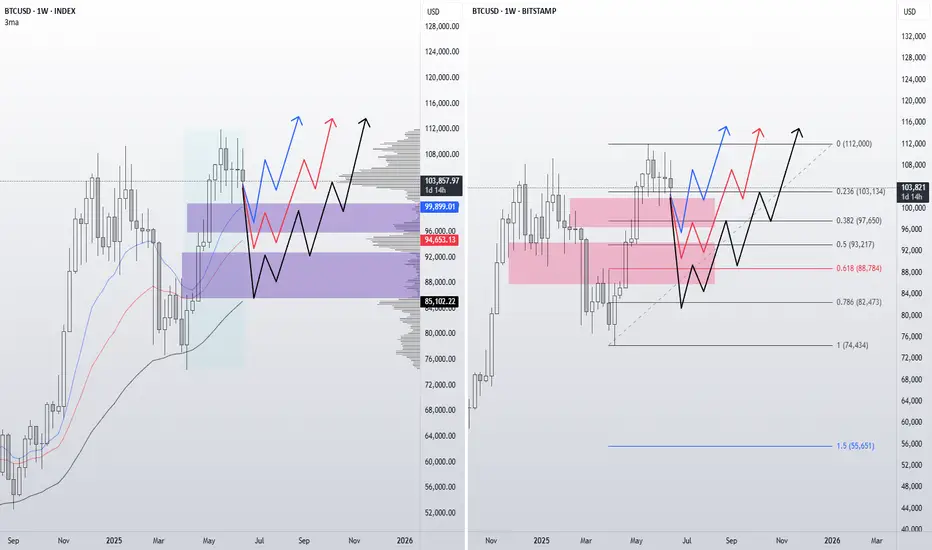
If BTC BullishIf I were a bull and perceived the current divergences to the main indicators as corrections, and not as a change in the market to bearish, then I would present support levels in this form.
In this form, where, as they say, all the stars came together.
Here are the gap levels, and EMA 13/26/52.
Fibonacci levels and mirror levels.
And three options in continuation of Bullish BTC.
Round and round, pick who you’ve found! ))
Bais.A.M.D: Accumulation Manipulation and Distribution.
H & S: Head and Shoulder
Accumulation.
BTC Accumulated Range 104139-106206
Manipulation
Manipulated Range 106247-109105
Forming a Head and Shoulder pattern.
Distribution
Currently in a Distribution phase.
After breaking below 106247 support to a low 102287. Heading to a Minor resistance range 105233-105731 for a more downside continuation below 102275.
IMO. DYOR

Bais A.M.D : Accumulation Manipulation and Distribution.
H & S : Head and Shoulder
Accumulation.
BTC Accumulated Range 104139 - 106206
Manipulation
Manipulated Range 106247 - 109105
Forming a Head and Shoulder pattern.
Distribution
Currently in a Distribution phase.
After breaking below 106247 support to a low 102287. Heading to a Minor resistance range 105233 - 105731 for a more downside continuation below 102275.
IMO. DYOR

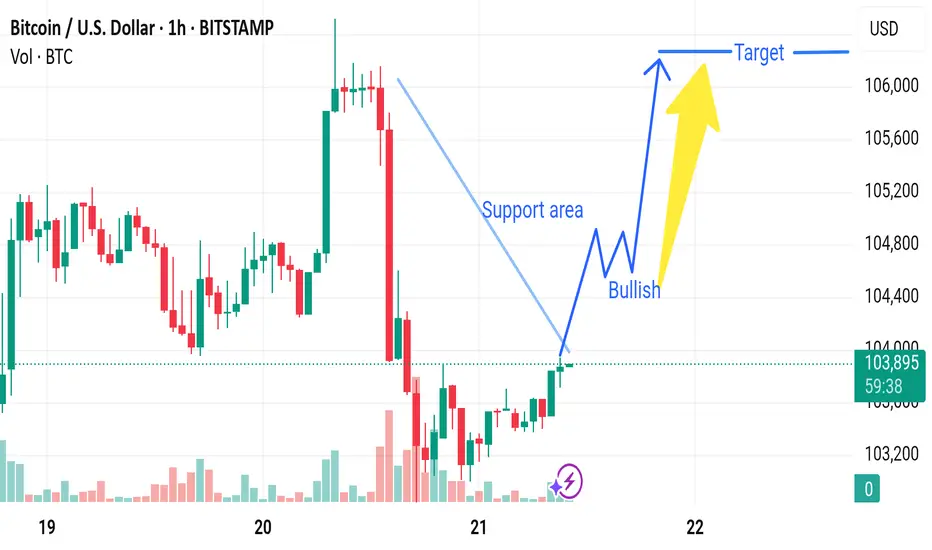
Market next target 🔄 Disruption Analysis:
1. Weak Support Confirmation
The chart marks a "Support area," but there is no strong confirmation (e.g., a hammer or engulfing bullish candle with high volume).
Support zones are more reliable with multiple prior bounces; here, it seems newly identified and not yet validated.
2. Bearish Volume Signature
During the recent decline (before the support), the red volume bars are significantly larger, indicating strong selling pressure.
The recovery candles near support have low volume, which may signal lack of conviction from bulls.
3. Lower Highs Formation
Prior to the drop, we see a series of lower highs, hinting at weakening bullish momentum.
This could suggest a potential bearish continuation, especially if price fails to break above the last local high (~106,000).
4. Possible Bearish Retest
Instead of a bullish breakout, the current price might just be retesting the broken support-turned-resistance.
This is a common bull trap scenario where prices bounce slightly before resuming downward.
BTC SidewaysBTC is in a distribution phase for a while now.
Sideways for the rest of the year.
My average selling price is ~103.000$.
It was a nice ride.
I am out of this! ✌

Bitcoin(BTC/USD) Daily Chart Analysis For Week of June 20, 2025Technical Analysis and Outlook:
In the recent trading session, Bitcoin exhibited an upward trend; however, it subsequently experienced a significant decline from the established Mean Resistance level at 110300. On Friday, Bitcoin exhibited notable price action, characterized by a pump-and-dump scenario. At this juncture, Bitcoin is retracing downwards as it seeks to approach the Mean Support level at 101500 and the ultimate Inner Coin Dip at 96500. It is essential to acknowledge the potential for an upward rally from the Mean Support levels of $101500 and/or the Inner Coin Dip at $96500. Such a rally could culminate in a retest of the Mean Resistance level at $107000.

BTC: A shakeout for more liquidityBTC: A shakeout for more liquidity
.
Wait for a drop and catch the dip, and continuously go up!
US STOCKS- WALL STREET DREAM- LET'S THE MARKET SPEAK!

CHECK BTCUSD SIGNAL READ CAPTAINbtcusd buy now ✅
entry point (103500.00) (103300.00)
TAKE PROFIT 1: (104000.00)
TAKE PROFIT 2: (104800.00)
LAST TARGET(105600.00)
STOP LOSS (102700.00)

Bitcoin - Will it explode up or down?Introduction
Bitcoin (BTC) is currently trading within a symmetrical triangle pattern, forming a series of higher lows and lower highs. This price action indicates a tightening range as the market approaches the apex of the triangle. A breakout is becoming increasingly likely in the coming days, and traders are now watching closely to see which direction BTC will choose. Will it break to the upside or the downside?
Pattern Trading
The symmetrical triangle has been a consistent feature of BTC’s recent price action. Price has been oscillating between the descending resistance and ascending support trendlines, gradually compressing the range. Based on the current structure, Bitcoin could continue moving within this pattern until around June 26th, when the triangle becomes extremely narrow and a breakout becomes imminent. Historically, such setups can produce false breakouts or “fake-outs,” where the price temporarily moves in one direction before sharply reversing and breaking out in the opposite direction. These moves often trap traders who enter too early, so caution is advised. Market manipulation is not uncommon in these tight formations, making it essential to wait for confirmation before entering a position.
4H Fair Value Gap (FVG)
Bitcoin has recently filled a 4-hour Fair Value Gap (FVG), a zone that often attracts price due to inefficiencies in the market. Now that this gap has been filled, there could be increased selling pressure, potentially pushing BTC back down toward the lower boundary of the triangle. If BTC is unable to break through the resistance created by this FVG, we may see more bearish momentum. However, should BTC manage to break and hold above this imbalance zone, it would be a strong sign of bullish intent and could open the door for a move to the upside. For now, though, this area remains a significant resistance level.
Upside Target
If BTC manages to break out of the triangle to the upside with strong volume and confirmation, the first major resistance level is around $109,000. This would be a logical target for bulls, as it represents a key zone of liquidity and previous interest. A successful move toward this level would confirm the bullish breakout and could set the stage for further gains, depending on broader market sentiment.
Downside Targets
Conversely, if BTC breaks below the lower trendline of the triangle, the first area to watch is around $103,500. This level is where a significant amount of liquidity has built up, and it could act as initial support. However, if that level fails to hold, the next key psychological level to watch would be $100,000. A drop below this milestone could trigger panic selling and further downside, especially if market sentiment turns negative.
Conclusion
At this point, BTC is at a critical juncture, and traders should remain patient as the market decides its next direction. While the current rejection from the 4H FVG suggests some short-term bearish pressure, the overall pattern remains neutral until a confirmed breakout occurs. Trading within the triangle can be risky due to the possibility of fake-outs, so it’s best to wait for clear confirmation before committing to a trade. Stay cautious, manage your risk carefully, and prepare for volatility as Bitcoin approaches a decisive move.
Disclosure: I am part of Trade Nation's Influencer program and receive a monthly fee for using their TradingView charts in my analysis.
Thanks for your support.
- Make sure to follow me so you don't miss out on the next analysis!
- Drop a like and leave a comment!

BTC Consolidates 104000-105000: Bearish Breakdown Looming?BTC Technical Update: Bitcoin has been consolidating within the 104000-105000 range for an extended period, with the overall trend showing a downward bias. With the overall trend tilting bearish, traders should watch for a break below 103500 to confirm the next leg down. 📉
⚡️⚡️⚡️ BTCUSD ⚡️⚡️⚡️
🚀 Sell@ 105000 - 104500
🚀 TP 102500 - 101500
Accurate signals are updated every day 📈 If you encounter any problems during trading, these signals can serve as your reliable guide 🧭 Feel free to refer to them! I sincerely hope they'll be of great help to you 🌟 👇

My btcusd analysis based on demand & supply , and central areaFirst of all btcusd in down trend , then i follow demand supply rule, from my observation.
Second point look the pressure in the hammers , it tells where the price heading, and for more confirmation wait for hammer failure and retest in the price, then you see the momentum in the price.

BTC ROAD TO ALL TIME HIGHHere is my prediction on weekend is BTC is a great time to pump.
So taking long now, SL near current support around 100-120 pips is good enough

BTCUSD is ranging in narrow zone alighning broad equiti marketBTCUSD is ranging in narrow zone alighning broad equiti market.

Bitcoin (EoY '28) - Potentials <3I just wanted to publish this because I feel there is some deep involvement on the drawings based off the all-time historic trendline.
I would like to see how this unfolds. Usually, I am too grandiose about my predictions, or too short-time-minded/%gains. Today we can see a few things that are appreciative and indicative of continuation on a higher timeframe. We can crawl and crawl forever. You musn't be afraid. Continue to trudge forward. There are no bears here, they are only phantoms in the dark.
