Middle East Tension: Read This Before You Trade today⚔️🕊️💣 Middle East Tension: Read This Before Markets close for the Weekend 🌍🔥✌️
Video:
Hey traders,
Today’s landscape is delicate and raw: we stand between a possible US strike on Iran and a chance for leaders to step back from the edge. Many are asking: Should I bet on gold? Should I short the indices? Should I buy oil?
Here’s my honest read, straight from today’s video (which I highly recommend you watch for full context 📺):
👉 Bitcoin (BTC)
Still ranging sideways. The last move hit my resistance zone perfectly. For now, BTC keeps its cool — but watch out: global fear can spark sudden moves, or the opposite, a liquidity crunch.
👉 Gold & Silver
Yes, they’re classic safe havens — but don’t fall for the textbook trap. When true chaos strikes, big players often sell profitable gold positions to cover losses elsewhere. So an initial spike is possible, but deep pockets can reverse it fast. This is why I’m cautious: I do not expect a guaranteed pump on gold or silver.
👉 Crude Oil (WTI)
The chart says it all: any strike in the Middle East fuels oil prices fast. But as I’ve always said — I do not long oil during human tragedy. Ethics over easy pips.
👉 Indices & USDJPY
Gaps are likely. Risk assets may get hammered if bombs fall. If leaders choose dialogue instead, expect a risk-on rebound. The USD stays a wildcard: trust in the US remains, but shocks test that trust.
👉 Airlines Pausing Flights?
Yes — major airlines are avoiding the Gulf. That alone signals how real this risk is.
✅ My plan is clear:
I never short disasters. I never profit from pain. I am LONG on humanity and peace. I’d rather lose a trade than wish for blood in the streets.
I do have some carefully calculated positions open tonight — fully risk-managed and small-sized. If Monday gaps bless me, fine. If peace wins and my trades lose? Even better.
👉 Watch the full video for my live charts, context, and unfiltered thoughts.
This text is just a recap — the full idea is already posted as a video.
Stay sharp. Stay ethical. Protect your capital and your soul — one good trade is never worth your humanity.
One Love,
The FXPROFESSOR 💙
Disclosure: I am happy to be part of the Trade Nation's Influencer program and receive a monthly fee for using their TradingView charts in my analysis. Awesome broker, where the trader really comes first! 🌟🤝📈
BTCUSD.PM trade ideas

CHECK BTCUSD SIGNAL READ CAPTAINbtcusd buy now ✅
entry point (105800.00) (105700.00)
TAKE PROFIT 1: (106100.00)
TAKE PROFIT 2: (106500.00)
LAST TARGET (106900.00)
STOP LOSS (105300.00)

Bitcoin Strategic Interval – Latency & Asymmetric Bias.⊢
⟁ BTC/USD – Binance – (CHART: 1D) – (June 20, 2025).
⟐ Analysis Price: $106,025.88.
⊢
⨀ I. Temporal Axis – Strategic Interval – (1D):
▦ EMA21 – ($105,772.44):
∴ The price remains fractionally above EMA21, retaking the short-term reactive axis;
∴ Despite prior rejection, current candle shows renewed traction with a solid close above;
∴ The slope is flat–rising, signaling the potential reactivation of local trend continuation.
✴️ Conclusion: EMA21 is tentatively reclaimed – a short-term bullish signal under close scrutiny.
⊢
▦ SMA200 – ($95,921.92):
∴ Long-term structure preserved: price maintains a wide buffer over SMA200;
∴ The moving average exhibits a healthy upward slope, uninterrupted since Q4 2023;
∴ No technical threat detected to the macro-trend structure.
✴️ Conclusion: SMA200 acts as the primary institutional defense line. No stress present.
⊢
▦ Ichimoku Cloud – (105,899 | 105,738 | 102,433 | 105,576 | 106,025):
∴ Price is nestled precisely within the flat upper cloud band – a known zone of consolidation;
∴ Span A and B are beginning to flatten, suggesting temporary exhaustion of momentum;
∴ Chikou remains above price – confirming trend integrity.
✴️ Conclusion: Ichimoku signals a pause, not a break – directional clarity pending.
⊢
▦ MACD (12,26,9) – (Histogram: -364.87 | MACD: 257.20 | Signal: 622.06):
∴ Bearish histogram remains negative, but shrinking for three sessions;
∴ MACD line curling upward with initial convergence to Signal line;
∴ Reversal signal forming but not yet triggered.
✴️ Conclusion: Early signs of MACD cross; confirmation requires follow-through.
⊢
▦ RSI – (53.17 | Avg: 51.74):
∴ RSI reclaims neutral-positive zone, stabilizing above 50;
∴ Structure shows divergence fading, with momentum recovering slowly;
∴ Still far from exhaustion thresholds.
✴️ Conclusion: RSI favors the bulls with cautious optimism.
⊢
▦ Volume (Last 5 Days):
∴ Volume remains muted, averaging 110–120k Bitcoin/day;
∴ No aggressive buy or sell pressure confirmed;
∴ Current move lacks conviction – suggests passive spot activity.
✴️ Conclusion: Price is advancing without volume confirmation – fragility persists.
⊢
🜎 Strategic Insight – Technical Oracle:
∴ Structural trend remains intact and undisturbed on the macro scale;
∴ Short-term bullish reclaim of EMA21 within the cloud, but momentum and volume still lag;
∴ Absence of conviction demands validation from price action or macro catalyst.
⊢
∫ II. On-Chain Intelligence – (Source: CryptoQuant):
▦ 🝰 Exchange Inflow Mean - (MA7):
∴ Metric sits near historic lows (≈0.4 BTC), denoting multi-week suppression of inflows;
∴ Correlates directly with reduced sell-side pressure from whales and institutions;
∴ Price structure remains unchallenged by inflow spikes – consistent with strategic holding.
✴️ Conclusion: Absence of fear or distribution among large holders – bullish backdrop intact.
⊢
▦ 🜍 Estimated Leverage Ratio – (Current: 0.259):
∴ Leverage steadily increasing, now entering historical danger zone;
∴ Elevated risk of cascade liquidations on any sharp downside move;
∴ Suggests the current rally is not organically fueled by spot demand.
✴️ Conclusion: Price structure is leveraged, not grounded – risk of synthetic instability.
⊢
▦ 🝗 Exchange Reserves - (Binance) – (≈544.5K BTC):
∴ Continuous net outflows – multi-month drain confirmed;
∴ Reflects silent accumulation or self-custody migration;
∴ No exchange-driven supply pressure visible.
✴️ Conclusion: Structural supply depleting – passive bullish signal.
⊢
▦ ⚒ Miners’ Position Index - (MPI) – (-1.1):
∴ Readings below 0 indicate minimal miner distribution;
∴ Suggests miners are confident, or at least not forced to sell at current levels;
∴ Historically coincides with market support zones.
✴️ Conclusion: Miner behavior aligned with trend preservation – not resistance.
⊢
▦ 🜚 Funding Rate - (All Exchanges) – (+0.003):
∴ Rates mildly positive, indicating slight dominance of long positioning;
∴ No excessive funding imbalance – healthy sentiment baseline;
∴ Reflects controlled bullish bias with no speculative overheating.
✴️ Conclusion: Longs exist, but not in a way that endangers trend integrity.
⊢
🜎 Strategic Insight – On-Chain Oracle:
∴ On-chain metrics echo the technical chart: structurally sound, short-term vulnerable;
∴ Long-term holders remain disengaged from distribution behavior;
∴ The system is healthy, but carries hidden leverage that may trigger volatility.
⊢
⧉ III. Contextvs Macro–Geopoliticvs – Interflux Economicus:
▦ 🇺🇸 United States – Federal Axis & Risk Channels:
∴ Treasury Yield Curve remains slightly positive (+0.44%), removing short-term recession signal;
∴ 10Y yield elevated at 4.42% – reflects sustained inflation resistance and risk demand;
∴ Fed has signaled no rate cuts before September – QT policy remains;
∴ Speculative expectations for only 1–2 cuts in 2025;
∴ Trump administration signals potential military action in Iran, igniting geopolitical risk premium.
✴️ Conclusion: U.S. monetary regime is steady–tight; geopolitical volatility injects asymmetric risk into crypto valuations.
⊢
▦ 🇨🇳 China – Internal Stimulus & Soft Deflation:
∴ Industrial Production slows to +5.8% YoY – weakest in 6 months;
∴ Retail sales climb to +6.4% YoY due to stimulus programs ("618 event", consumption vouchers);
∴ PPI remains deflationary (-3.3% YoY), compressing industrial margins;
∴ Fiscal revenue down -0.3% YTD – signals internal fragility despite easing efforts.
✴️ Conclusion: China is applying targeted stimulus, but lacks decisive global impact – neutral crypto flow effect.
⊢
▦ 🇪🇺 European Union – Disinflation & Rate Reversal:
∴ HICP inflation falls to 1.9% – below ECB’s 2.0% target;
∴ ECB cuts deposit rate by 25bps – now 2.00%;
∴ PMI Composite remains below 50 – economic contraction underway;
∴ ECB forward guidance signals data-dependence and hesitation for further cuts.
✴️ Conclusion: Europe is easing rates amidst stagnation – weak driver for global risk flows.
⊢
🜎 Strategic Insight – Interflux Macro Oracle:
∴ U.S. tight policy + Iran tension = dual pressure point on risk assets;
∴ China’s mild stimulus is not yet globally inflationary – no volatility trigger;
∴ EU drifts silently – supportive, but irrelevant to Bitcoin in current configuration;
∴ Global system is stable in appearance, but tactically charged beneath – setup aligns with Bitcoin volatility potential.
⊢
IV. ♝ Market Sentiment - Media & Institutional Lens:
▦ The Block – Corporate Stockpiling Thesis:
∴ Ongoing accumulation of Bitcoin by public and private entities continues across Q2;
∴ Institutional wallets showing strategic DCA behavior – interpreted as positioning for either macro easing or geopolitical hedge;
∴ Unlike past cycles, no major corporate selloffs have been detected.
✴️ Conclusion: Institutional base remains in passive accumulation – potential catalyst insulation.
⊢
▦ CoinDesk – Sentiment Report – BTC at $92K Risk Threshold:
∴ Despite price climbing above $106K, analysts caution of technical rejection scenarios;
∴ Zones near $92K identified as high-liquidity, high-reaction clusters;
∴ Chart analysis frames current movement as vulnerable if macro catalysts turn hawkish.
✴️ Conclusion: Sentiment remains cautiously bullish but alert to correction windows.
⊢
▦ InfoMoney – U.S. Military Risk – Iran Strike Potential:
∴ Reported internal briefing of U.S. military planning toward Iranian targets;
∴ Trump’s media team leveraging geopolitical strength posture to influence sentiment;
∴ Markets (Dow Futures) showing pre-market decline on the headline.
✴️ Conclusion: Bitcoin holds narrative premium under geopolitical fear – but risk surge remains volatile.
⊢
🜎 Strategic Insight – Media Oracle:
∴ The crypto narrative is suspended between structural trust (institutional accumulation) and external fear (macro-political instability);
∴ Bitcoin presently benefits from asymmetric narrative positioning — but lacks transactional confirmation;
∴ Media flows suggest that sentiment will pivot swiftly if Powell’s tone confirms further hawkish stance or if Iran tension escalates.
⊢
⊢
⚜️ Magister Arcanvm (𝟙⟠) – Vox Primordialis!
⚖️ Wisdom begins in silence. Precision unfolds in strategy.
⊢
⌘ Codicillus Silentii – Strategic Note:
∴ The 1D reclaim of EMA21 inside the Ichimoku flat cloud reflects a market in suspended potential, where trend continuation and failure share equal weight;
∴ On-chain dynamics remain structurally undisturbed, yet veiled in a fragile layer of leveraged positioning;
∴ Exchange reserves continue their descent, detaching the market from traditional sell-side threat, but increasing reliance on thin liquidity zones;
∴ Macro vectors (Fed policy + Middle East tension) hover as dual shadows, capable of igniting volatility without prelude;
∴ Institutional accumulation remains active, but no longer decisive - the market awaits external ignition, not internal strength;
∴ Sentiment is asymmetrically bullish, yet explicitly unconfirmed in transactional volume and price aggression;
∴ The system is quiet - not because it is resolved, but because it is observing itself. This is a moment of ritual latency.
⊢
⌘ Market Status – Tactical Mode:
✴️ Strategic Position: “Structurally Bullish – Tactically Suspended”;
✴️ Primary Mode: “Observation Priority”;
✴️ Tactical Stance:
∴ No active positioning expansion without confirmation beyond Ichimoku flat zone;
∴ Watch for MACD confirmation and volume acceleration;
∴ Monitor geopolitical escalation and Powell’s tone – both capable of shifting structural balance.
✴️ Directional Bias: Neutral–Bullish, contingent upon validation;
✴️ Key Zone of Collapse Risk: $92,000;
✴️ Ascent Gate: $110,800 + (confirmation threshold).
⊢

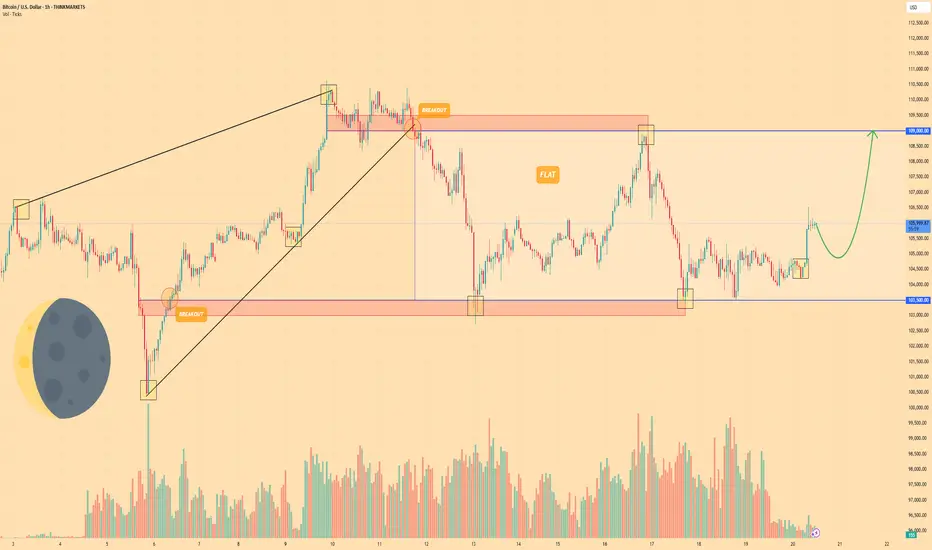
BITCOIN - Price can continue grow inside flat to $109000 levelHi guys, this is my overview for BTCUSD, feel free to check it and write your feedback in comments👊
A few days ago, the price entered a wedge, declining below the $103500 level and then making a strong impulse up.
Next, price broke $103500 level one more time and rose to resistance line of wedge, after which started to decline.
BTC broke $109000 level and started to trades inside a flat, where it declined to support level and then bounced up.
Price rose to resistance level, which is top part of flat, and then at once dropped back and started trading close.
But some time later, price bounced from this level and started to grow, and even now it continues to grow.
So, I think that BTC can make a small correction movement and then continue to grow to $109000 level.
If this post is useful to you, you can support me with like/boost and advice in comments❤️
Disclaimer: As part of ThinkMarkets’ Influencer Program, I am sponsored to share and publish their charts in my analysis.
BtcusdCurrently we are on a triangle thats awaiting breakout but with my expectations I'm expecting a strong bull run

BITCOIN BOUNCES FROM 50 MA - AGAINBitcoin continues to treat the 50-day moving average like a sacred line in the sand. Once again, price dipped to test the level and found immediate support – bouncing right off the blue line with a solid daily candle and gaining over 1% in the process. That makes multiple successful defenses of the 50 MA in recent weeks – clearly, traders are watching it closely.
The key takeaway here isn’t just the bounce, but the fact that BTC remains in a tightening range between ~$112,000 resistance and ~$100,700 support. We’re seeing a clear battle between bulls and bears – with bulls still managing to defend higher lows while momentum tries to rebuild. As long as the 50 MA continues to hold, the structure remains bullish – but if it breaks, it could signal a retest of the $100K psychological level or even a deeper pullback toward the mid-$90Ks.
For now, the trend is still your friend. But keep one eye on the moving average – because the moment it fails, this range could resolve sharply. Until then, it’s a patient trader’s market.

BTC levels to watch for a breakoutMarkets are quiet, and Bitcoin is coiling. A potential breakout looms as we await the President’s Working Group crypto update by July 23. Will positive news trigger a rally to $121,000? Watch for key levels and triangle patterns.
This content is not directed to residents of the EU or UK. Any opinions, news, research, analyses, prices or other information contained on this website is provided as general market commentary and does not constitute investment advice. ThinkMarkets will not accept liability for any loss or damage including, without limitation, to any loss of profit which may arise directly or indirectly from use of or reliance on such information.

CHECK BTCUSD SIGNAL READ CAPTAINbtcusd buy now ✅
entry point (106.000) (105.900)
TAKE PROFIT 1: (106.300)
TAKE PROFIT 2: (106.800)
LAST TARGET (107.200)
STOP LOSS (105.550)

Btcusd Fall ContinuesBitcoin (BTC) tumbled to a low of $101,095 on Friday amid volatility in the market. The effect of the tussle between United States (US) President Donald Trump and Tesla Chief Elon Musk negatively influenced the NASDAQ and Tesla's stock price on Thursday, although both are recovering on Friday.
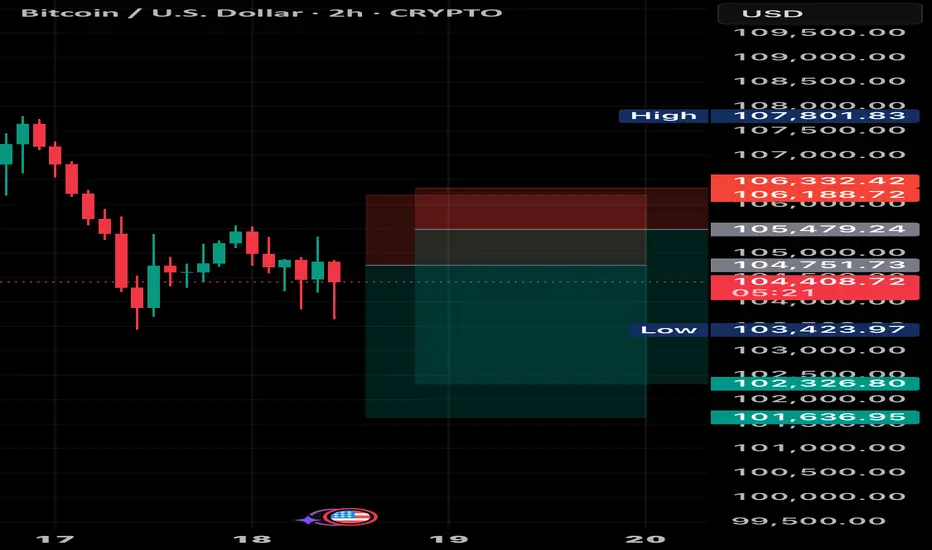
Bitcoin (BTC/USD) 2-Hour Candlestick Chart2-hour candlestick price movement of Bitcoin (BTC) against the U.S. Dollar (USD) as of June 20, 2025. The current price is $106,004.49, reflecting a 2-hour increase of $1,317.33 (+1.26%). The chart highlights a recent upward trend with a support level around $105,082.06 and resistance near $108,009.17. A shaded area indicates a potential price range, with a bullish projection suggested by the overlaid trendline.

BTC SHORT TP:102,200 18-06-2025Let’s keep it simple: this pump looks fake.
I’m entering SHORT between 104,550 and 105,500, aiming for a target between 101,300 and 102,300. Average RR: 3.4 — solid and clean.
⏱️ Timeframe: 2H
⏳ Estimated duration: 12 to 24 hours
⚠️ Context: Bearish continuation — let’s ride the wave, not the noise.
Use your stop-loss based on your risk strategy. If price doesn’t move within the expected time, the setup is invalid.
We don’t use indicators, we’re not out here drawing lines or cute little shapes — I just give you a clean trade.
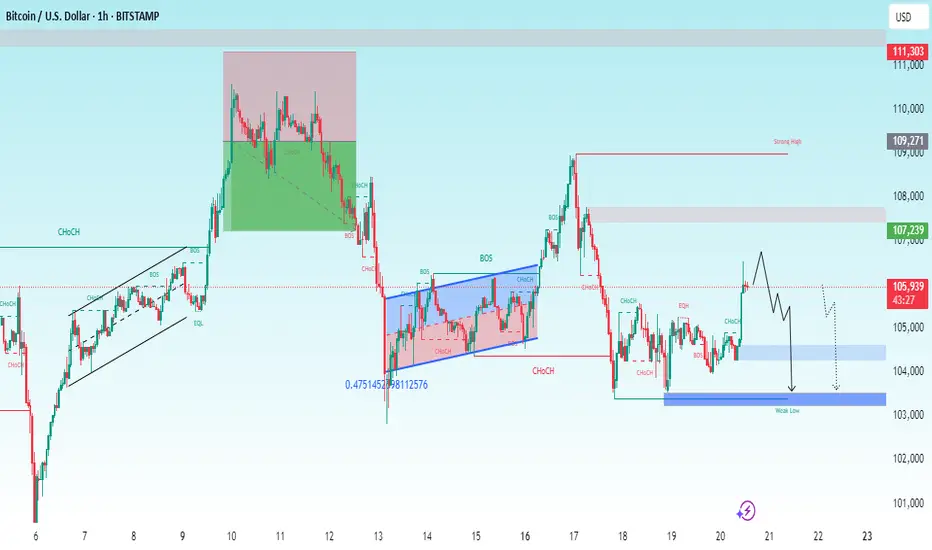
Bitcoin 4-Hour Price AnalysisA 4-hour candlestick chart of Bitcoin (BTC/USD) showing a recent price of $105,562.92 with a 1.17% drop. The chart includes a potential bullish pattern with resistance at $109,003.20 and support at $103,188.43, marked by technical indicators.

BITCOIN (BTCUSD): Strong Bullish Confirmation?!
Bitcoin has a high chance to rise more, following
a strong bullish reaction to a rising trend line on a 4H.
Goal - 108000
❤️Please, support my work with like, thank you!❤️

BITCOIN This is the long-term picture. Don't get distracted.Bitcoin (BTCUSD) has been consolidating lately after making a new All Time High (ATH) last month and this is already making part of the market nervous over whether that's the Cycle Top or not.
This is one of those times when it would be best to ignore the short-term noise/ volatility and stick to the long-term picture. And that's exactly what's shown on this chart, with BTC on the 1M time-frame showing the incredible symmetry among its 4-year Cycles, with Bear Markets lasting 12 - 13 months and Bull Markets 35.
Based on that, this Cycle's Top is expected to be priced by October (2025). This also matches the Sine Waves as implied by the 1M RSI, which as been trading within a Channel Down (diminishing returns) since Bitcoin's inception.
So do you also think that we have around 4 months before the market tops? Feel free to let us know in the comments section below!
-------------------------------------------------------------------------------
** Please LIKE 👍, FOLLOW ✅, SHARE 🙌 and COMMENT ✍ if you enjoy this idea! Also share your ideas and charts in the comments section below! This is best way to keep it relevant, support us, keep the content here free and allow the idea to reach as many people as possible. **
-------------------------------------------------------------------------------
💸💸💸💸💸💸
👇 👇 👇 👇 👇 👇

TIME and PRICE Structure for BTC (Intraday)Vertical lines represent cycle clusters.
The price tends to change direction or breakout/accelerate around these timelines.
The right-hand table shows cycle intensity for the next days.

Market Shockwaves: DXY Surges, Gold Slips & Bitcoin Tests $100K This week delivered powerful market moves as the U.S. Dollar roared higher, gold struggled under macro pressure, and Bitcoin teetered on the $100K edge. In this must-watch market recap, we break down the key economic events, geopolitical tensions, and technical signals that drove DXY, XAUUSD, and BTCUSD — and more importantly, what it all means for the week ahead.
🔍 In this video, we cover:
✅ Why the dollar is rebounding and what’s fueling its strength
✅ The real reason gold is under pressure despite global risk
✅ Bitcoin’s next move: breakdown or bounce?
✅ Key levels and events to watch as we close out this week
✅ What traders and investors should prepare for next week
Whether you're a day trader, swing trader, or just watching the macro landscape — this recap gives you the edge.
👉 Don’t forget to like, comment, and subscribe for weekly insights!
#DXY #Gold #Bitcoin #MarketRecap #TradingInsights #MacroTrends #TechnicalAnalysis

Bitcoin pressure to go below 100 000After break uptrend structure (H4), bitcoin have the tendency to find support level below 100000. For those who trade at smaller time frame you can sell until price reach 99 070
Bitcoin Consolidates Liquidity Around $105,000FenzoFx—Bitcoin is trading sideways near $104,650 after a sharp drop from $109,000, forming a high-liquidity zone with potential for a breakout.
The $102,746–105,266 range shows strong accumulation, offering support. BTC remains bullish above the previous week's low, but must close above the previous day's high to resume its uptrend.

BITCOIN, trend outlook for this summerWhile the fundamentals are still very complicated on the stock market at present, with the FED intransigent, trade war/diplomacy (deadline set for July 9 to reach trade agreements) and extreme geopolitical tensions, can the bitcoin price withstand all these challenges and continue its annual bull run over the summer? Let's take a look at a number of elements, including a major technical risk and two factors that are, on the contrary, favorable to a new record this summer.
1) Bitcoin's bullish cycle linked to the spring 2024 halving is still long
Let's start with the cyclical aspect of bitcoin, the famous 4-year cycle built around the quadrennial halving. The last halving took place in April 2024, and if the cycle repetition works again, then the current cycle is due to end at the end of 2025. So there's still time for bitcoin to set a new record, even if it comes under short-term pressure - it still has 5 months to go.
The first chart below summarizes the 4-year cycle by averaging the time and price of all previous cycles since 2009. Our current cycle is represented by the red curve, and in terms of probability, the end of the cycle is expected between October and December 2025.
There's still time, and this is the first major piece of information in our article.
2) A bearish technical divergence in weekly data calls for great caution
On the other hand, technical analysis of the bitcoin price in weekly data gives a warning signal with the presence of a bearish price/momentum divergence, market momentum being represented here by the RSI technical indicator.
This bearish divergence resembles that at the end of the previous cycle in November 2021, but the comparison stops here. At that time, all end-of-cycle models were on alert, but this is not the case today. Nevertheless, we must be aware that this bearish divergence could be a pressure factor this summer.
3) Global liquidity as represented by the M2 monetary aggregate gives grounds for optimism about bitcoin's summer trend
Global M2 deploys a strong positive correlation with the bitcoin price, and it takes an average of 12 weeks for this liquidity to act on BTC. This monetary aggregate measures the sum of the money supply (M2) of the major economies - USA, China, Eurozone - converted into US dollars. It includes sight deposits, savings accounts and certain short-term instruments, representing the gross liquidity immediately available in the global economy.
This level of liquidity is directly influenced by monetary (key rates, QE/QT), fiscal and wage policies. The evolution of the US dollar plays a crucial role: a strong dollar mechanically reduces global M2 in USD, while a weak dollar increases it. In this respect, Chinese and US dynamics are often divergent, as they are driven by different credit logics (centralized planning on the Chinese side, rate-based adjustment on the US side).
Since the beginning of April, Bitcoin has been on a marked uptrend. This progression, which we have followed step by step, raises an essential question: can this momentum be maintained this summer, despite the fundamental challenges of the moment?
Such a hypothesis is plausible, provided that a key - and often underestimated - driver continues to act: the unprecedented increase in global liquidity, as measured by the M2 monetary aggregate. According to the latest available data, global M2 has set a new all-time record, and this is a factor supporting the BTC trend for the first part of the summer.
DISCLAIMER:
This content is intended for individuals who are familiar with financial markets and instruments and is for information purposes only. The presented idea (including market commentary, market data and observations) is not a work product of any research department of Swissquote or its affiliates. This material is intended to highlight market action and does not constitute investment, legal or tax advice. If you are a retail investor or lack experience in trading complex financial products, it is advisable to seek professional advice from licensed advisor before making any financial decisions.
This content is not intended to manipulate the market or encourage any specific financial behavior.
Swissquote makes no representation or warranty as to the quality, completeness, accuracy, comprehensiveness or non-infringement of such content. The views expressed are those of the consultant and are provided for educational purposes only. Any information provided relating to a product or market should not be construed as recommending an investment strategy or transaction. Past performance is not a guarantee of future results.
Swissquote and its employees and representatives shall in no event be held liable for any damages or losses arising directly or indirectly from decisions made on the basis of this content.
The use of any third-party brands or trademarks is for information only and does not imply endorsement by Swissquote, or that the trademark owner has authorised Swissquote to promote its products or services.
Swissquote is the marketing brand for the activities of Swissquote Bank Ltd (Switzerland) regulated by FINMA, Swissquote Capital Markets Limited regulated by CySEC (Cyprus), Swissquote Bank Europe SA (Luxembourg) regulated by the CSSF, Swissquote Ltd (UK) regulated by the FCA, Swissquote Financial Services (Malta) Ltd regulated by the Malta Financial Services Authority, Swissquote MEA Ltd. (UAE) regulated by the Dubai Financial Services Authority, Swissquote Pte Ltd (Singapore) regulated by the Monetary Authority of Singapore, Swissquote Asia Limited (Hong Kong) licensed by the Hong Kong Securities and Futures Commission (SFC) and Swissquote South Africa (Pty) Ltd supervised by the FSCA.
Products and services of Swissquote are only intended for those permitted to receive them under local law.
All investments carry a degree of risk. The risk of loss in trading or holding financial instruments can be substantial. The value of financial instruments, including but not limited to stocks, bonds, cryptocurrencies, and other assets, can fluctuate both upwards and downwards. There is a significant risk of financial loss when buying, selling, holding, staking, or investing in these instruments. SQBE makes no recommendations regarding any specific investment, transaction, or the use of any particular investment strategy.
CFDs are complex instruments and come with a high risk of losing money rapidly due to leverage. The vast majority of retail client accounts suffer capital losses when trading in CFDs. You should consider whether you understand how CFDs work and whether you can afford to take the high risk of losing your money.
Digital Assets are unregulated in most countries and consumer protection rules may not apply. As highly volatile speculative investments, Digital Assets are not suitable for investors without a high-risk tolerance. Make sure you understand each Digital Asset before you trade.
Cryptocurrencies are not considered legal tender in some jurisdictions and are subject to regulatory uncertainties.
The use of Internet-based systems can involve high risks, including, but not limited to, fraud, cyber-attacks, network and communication failures, as well as identity theft and phishing attacks related to crypto-assets.

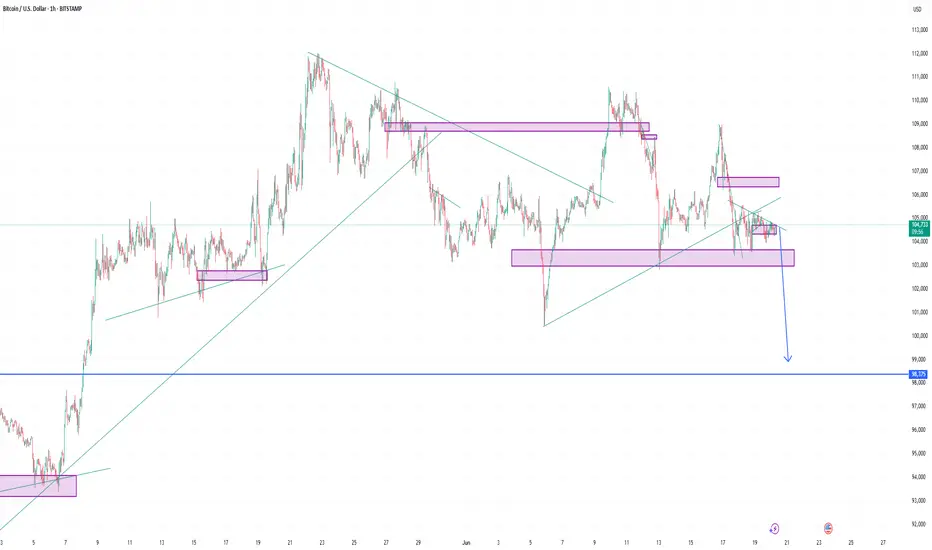
Short term bearish on BTC until 92K USDPurely looking at current dealing range and the fact that price is holding in 'bearish flag' pattern, which may a false signal, when at ALH.

BTC bouncing of Support. BTC bouncing of the 1D diagonal support line at $104k but needs to flip $106k to continue the rally , don’t see it happening until July .

BTC Triangle Squeezing Toward $100 K — Sellers Press🎯 TL;DR
A four-week contracting triangle is coiling price just under $105 K.
Measured move ⇒ $100 506
Both W.ARITAS Quantum RSI flash strong selling pressure while QSP shows a weak trend.
On-chain: miners dumped ≈30 000 BTC since late May, yet spot-ETF inflows have stayed positive eight days straight.
Base case: price breaks lower into $100 K-97 K, where I expect a sharp bounce.
🗺️ Chart at a Glance
Element Detail
Pattern Symmetrical / contracting triangle (late-Apr → present)
Immediate pivot $104 800 – reclaimed as resistance (red circle)
Target 1 $100 506 – triangle measured move
Demand block $96 900 – $95 000 – weekly support & June VWAP
Invalidation 6-h close > $106 000
🔧 Technical Internals
Momentum 🟣
Quantum RSI: −23 / −41 and falling → sellers dominate.
QSP: muted blue histogram sub-zero → trend itself is still weak, so expect whipsaws near support.
Structure 🔵
Three successive lower-highs (113 K → 110 K → 109 K) tighten the squeeze.
Price is riding the underside of the triangle, a common “kiss-of-death” before resolution.
🔍 Fundamental / Flow Backdrop
Miners on the offer – Wallet balances down ~30 000 BTC over 20 days (≈ $3.1 B)
Source: IntoTheBlock via CoinDesk, 19 Jun 2025
ETF demand refuses to quit – U.S. spot ETFs pulled $388.3 M on 18 Jun, marking 8 consecutive inflow days
Source: CoinTelegraph, Cryptonomist, 19 Jun 2025
Regulatory clarity incoming – U.S. Senate passed a bipartisan stablecoin bill on 17 Jun; House vote next
Source: Reuters, 17 Jun 2025
Net: structural sellers (miners, profit-takers) vs. structural buyers (ETFs).
Right now, technicals side with the sellers.
📈 Trade Map (3-8 Week Horizon)
106 000 – 104 800 Triangle top & failed breakout zone Bias flips bullish only on sustained reclaim
100 506 Measured-move target + psychological $100 K Primary TP / bounce watch
96 900 – 95 000 Weekly demand, June VWAP Secondary TP if 100 K gives way
110 000 + Pattern invalidation Opens road to 113 K-115 K ATH cluster
🛠️ Execution Idea (Not Financial Advice)
Trigger: 6-hour close < $103 500 confirms breakdown.
Entry Bias: Short retest of 104.8 K-105.5 K.
Targets:
TP1 – $100 500
TP2 – $97 000 (only if momentum stays bearish)
Stop / Invalidation: 6-hour close > $106 000 and Quantum RSI flips back to green.

Double Top On Bitcoin : Bearish Setup on Global Energy Shock 3.0Double Top On Bitcoin
Double top formation, like 2021.
The energy crisiss due to Israel attack on Iran, is going to make the USD stronger and trigger risk-Off rate
