"It was a random flight away.." learn these 3 stepsI was reading a book
On negotiating by Chris Voss.
It reminded me of the time i got into a fight with a drunk friend.
It was not fair he was drunk and
I was sober.He won the fight because
As soon as he hit me as I barely
Dodged the punch, it hurt. I froze.
Immediately pulled back using round kicks and flying kicks to keep distance
It was a random flight away from the fight. I used my words "relax!!"
I moved fast put a palm of my
Hand stretched on his chest,
"If he breaks this stop sign..."
I thought in that moment
To me that was my signal...
Self defense is not easy
You will get hurt protecting your pride.That fight humbled me.
Negotiating is about losing your fight to give the other person what they want.Then using your position to get what you need.I needed peace.
Because I was not interested in escalating the situation with drunk person.
Bitcoin is very very volatile.This is what makes me tell you don't use margin.Margin or leverage in Trading is like fighting a drunk friend.
The moment the fight is over so is the friendship.Take ownership.Buy it and save it in a hardware wallet.
The price is above the 50 EMA
The price is above the 200 EMA
The price gapped up about a month ago
That's the 3 Step Rocket Booster Strategy
Cold storage is your self defense.You won't participate in the mania but you will survive the fight and make money to live another day.
🚀 Boost this content to learn more
Disclaimer ⚠️ Trading is risky please learn about Risk Management And Profit Taking Strategies.Also don't use margin and use a simulation trading account before you use real money.
BTCUSD.PM trade ideas

The chart illustrates a recent downtrendChart Overview
⚙️ Price Action:
The chart illustrates a recent downtrend, followed by consolidation near the current level of $104,933.
A bullish reversal structure is forming, marked by the label “Ch0CH” (Change of Character), which suggests a potential trend shift from bearish to bullish.
🧠
Liquidity Concept
:
The chart highlights a horizontal line labeled “Equal High Liquidity” around the $108,800 level.
This area suggests a liquidity pool where stop orders might be resting above the equal highs.
Market makers may drive price toward this area to collect liquidity before reversing or continuing.
📈
Projected Price Path
:
A white dotted line projects a possible bullish move:
First, a minor retracement or accumulation phase.
Then, an upward impulse aiming to take out the equal highs near $108,800.
🧩 Interpretation:
This chart implies a bullish outlook based on:
Break in bearish structure (Ch0CH).
Liquidity draw above equal highs.
Anticipation of smart money concepts (e.g., liquidity sweeps, inducement moves).

BTC BOTTOM $ - 100% Never Fails (2013 - Today)Bitcoin Weekly Chart Going Back To 10+ Years
We are looking at the BitStamp Green Support Line here that has Marked the bottom correctly before 100% of the time for each each bull cycle pump on bitcoin going 3/3 without fail.
We are now looking to see if we can go 4/4 and mark the new bottom buy with a quick wick down to the green support currently around 73K+ this week, but as each week closes the bitcoin bottom number will rise as the green support line rises over time.
Good luck. Let's see if the 4th time is also the charm.

Final Shakeout Before BTC’s Last Leg Up?BTC Update
Well due update here...
Since my last forecast, price pushed higher without giving the pullback I was anticipating — instead sweeping liquidity above the prior ATH.
After taking that BSL, price stalled and has since been ranging, showing clear signs of bearish momentum creeping in. We're seeing bearish orderflow on the LTF and daily, and volume is thinning out up at these highs — not ideal for bulls.
USDT.D is also pushing higher and showing strength, which typically leans bearish for BTC in the short term. The structure on that chart is bullish and supports the idea of a BTC pullback being likely before any continuation higher.
That said, I'm still pro-trend bullish overall — as I mentioned in April — thanks to the clean bullish shift from the range lows and clear signs of accumulation. We’ve got textbook last points of support (LPS) and unmitigated demand sitting below current price, which are prime candidates for a reversal.
Right now I’m eyeing two key levels:
Upper demand zone / LPS — lining up with the top of the prior accumulation range. This has strong confluence as a breakout-retest zone.
Lower refined weekly/2W demand — valid if we see a deeper flush or capitulation leg, though less likely in the short term.
My focus is on the first level. I’ll be watching for reactions and reversal signals if price taps into it. Same logic applies to USDT.D as it approaches nearby supply zones.
Overall, I see this as a healthy correction — overdue after an extended leg — and expect BTC to push higher and break ATHs once demand is retested and confirmed.
Zooming out: the 4-year cycle is approaching its final stages, with data suggesting a cycle top could form around Q3/Q4 2025 — likely between August and October, if past cycles rhyme. I’ll be monitoring major assets against that timeline and will look to scale out and risk-off when the confluences begin aligning with that macro cycle window.
Just think...
1 last BTC leg up...
Final altseason hype to drag in latecomers...
Then the cycle ends — and the trap shuts as we re-enter bear territory.
Charts:
1D:
3D:
1W:
Extra:
1M:

Bitcoin 4-Year Cycle Structure – Technical BreakdownBitcoin 4-Year Cycle Structure – Technical Breakdown
This chart examines Bitcoin’s historical 4-year cycle behaviour, focusing on the repeating market structure observed across the last three cycles: Bull Market → Bear Market → Accumulation/Recovery → Halving → Expansion.
Key Observations:
🔹 Cycle Timing Consistency
Each of the past three cycles has shown a consistent duration between the halving and the final bull market peak—typically between 500–550 days. Based on that timing, the current cycle suggests we are still ~100 days away from a potential macro top.
🔹 Post-Halving Correction is Expected
Corrections shortly after the halving have historically marked mid-cycle retracements, not macro tops. The current pullback is structurally aligned with the 2017 and 2021 expansions, where Bitcoin consolidated before pushing to final highs.
🔹 Altcoin Market Segments Lagging
TOTAL2 (Total Market Cap excluding BTC)
TOTAL3 (Excluding BTC & ETH)
OTHERS (Altcoins excluding top 10 by market cap)
All remain below their prior cycle all-time highs, which historically occurs before the full market cycle concludes. These segments often accelerate after BTC has established dominance, typically in the later stages of the bull market.
🔹 USDT Dominance Suggests More Upside
USDT.D is still trending down, which historically reflects increasing risk appetite and capital rotation into crypto assets. Prior cycle tops have aligned with much lower dominance levels, indicating further downside risk for USDT.D, and potential upside for crypto markets.
Conclusion:
Despite short-term volatility, the technical structure across Bitcoin and broader market indicators suggests the cycle remains in its expansion phase. Timing models, altcoin lag, and dominance signals all point to further upside potential before a full cycle peak is in.
1W:
1M:

BTC on the Edge – Bounce or Break?🚨 BTC AT MAKE-OR-BREAK ZONE! 🚨
Chart by Mosilar 📊
🧠 Price is sitting on the major trend line + high-volume support around $104K 🔥
👀 A double top is in play — tension is building!
💣 Break below = potential dump to $102K
🚀 Bounce = possible rally back to $108K+
⚔️ Bulls & bears are in a standoff.
This level won’t hold forever—watch closely! 📉📈

BTCUSD: Nowhere near a top yet.Bitcoin remains neutral on its 1D technical outlook (RSI = 47.257, MACD = 443.000, ADX = 29.912) due to high volatility recently but the bullish long term trend is intact and even more so, hasn't yet started the year-end rally. The Mayer Multiple Bands have always priced a Cycle's Top on their red trendline so no matter how high that may seem from the current market price, the TP zone should be between the orange (2 Stdev above) and red (3 Stdev above) trendines. Minimum TP = 200,000 for this Cycle.
## If you like our free content follow our profile to get more daily ideas. ##
## Comments and likes are greatly appreciated. ##

Bitcoin Setup: Tight Risk, Solid UpsideBitcoin continues to trade within a strong uptrend.
Ideally, I’d prefer to see reduced volatility and stabilization on the daily chart for a cleaner entry. But overall, the current setup already looks attractive — so I’m entering now.
What I like is that for such a volatile asset, the stop-loss is relatively tight — just around -1.70%. The upside potential targets the previous high and beyond, offering 7.50%+.
Let’s go!

B/$The latest breakout of the top will give a good pullback, which is currently developing.
I think we will see a price below $100,000 again.

Bitcoin Update: Key Levels, Geopolitics & Cautious Trading Ahead
📈💥 Bitcoin Update: Key Levels, Geopolitics & Cautious Trading Ahead 💭🌍
Hey Traders,
Many of you asked for a fresh Bitcoin update — so here we go. 🚀
Last time, we caught that breakout, but it turned out to be a fakeout. Since then, the situation has become more complex. Geopolitical tensions between Iran and Israel, combined with uncertainty in the Middle East, are weighing heavily on sentiment. 🕊️💣
On the macro side, the Federal Reserve is expected to keep rates unchanged for now — no cuts yet. Building permits data has disappointed again, but inflation is cooling slightly. For now, the big market mover is clearly geopolitics.
👉 Key Levels to Watch:
✅ Support:
$102,400 – $102,700 — If Bitcoin dips here, watch for a bounce.
✅ Resistance:
$106,000 — Major resistance.
Next Resistance: $108,350
Ultimate target: $113,000–$115,000, IF momentum returns.
So how am I approaching it?
📌 Long above $106K → first stop $108K → target $113K–$115K.
📌 Short below $106K → watch support zones carefully.
📌 If we lose $102K, next big supports are $97,700, $89,000 — and even $79,000 if things worsen.
🚫 Big Picture:
We’re still stuck in a broad sideways range — roughly $100,000–$110,000 — until a clear breakout or breakdown occurs. Without a Fed pivot or de-escalation in the Middle East, momentum may stay muted.
🙏 My Advice:
Be cautious. Size your positions wisely. Respect levels. And above all, stay safe — mentally and emotionally — in these uncertain times.
I’ll keep you updated step-by-step. Trade smart, stay kind.
One Love,
The FXPROFESSOR 💙
Disclosure: I am happy to be part of the Trade Nation's Influencer program and receive a monthly fee for using their TradingView charts in my analysis. Awesome broker, where the trader really comes first! 🌟🤝📈

₿itcoin: SetbackBitcoin has come under selling pressure in recent hours. We cannot rule out that a deeper dip may precede the next leg higher into the upper blue Target Zone between $117,553 and $130,891. Once green wave B concludes in this range, we anticipate a wave C decline into the lower blue Target Zone between $62,395 and $51,323 to complete the larger orange wave a. From there, a corrective rally in orange wave b is expected, which should set the stage for a final leg lower to finalize blue wave (ii). Meanwhile, we’re still monitoring the alternative scenario (30% probability), in which blue wave alt.(i) is still in progress. In this case, BTC would stage an immediate breakout above resistance at $130,891.
📈 Over 190 precise analyses, clear entry points, and defined Target Zones - that's what we do.

Bitcoin - The Elevated Cycle and the Silence Before Powell.⊢
⟁ BTC/USD – Bitstamp – (CHART: 1M) – (June 18, 2025).
⟐ Analysis Price: $104,044.00
⊢
⨀ I. Temporal Axis – Strategic Interval – (1M):
▦ EMA90 – ($39,909.00):
∴ Rising steadily, serving as long-cycle structural support since 2020;
∴ Price remains well above this average, with no signs of downward pressure;
∴ The positive slope confirms ongoing bullish macro structure.
✴️ Conclusion: EMA90 holds the foundational base of the long-term uptrend with ample buffer.
⊢
▦ SMA50 – ($48,924.00):
∴ Key axis of mid-to-long-term structure, validated by multiple touches during 2022–2023;
∴ Current price distance suggests technical room for retracement;
∴ Still rising with no sign of flattening or decay.
✴️ Conclusion: SMA50 confirms trend integrity, though overextension calls for caution.
⊢
▦ Ichimoku (Kumo & Lines) – (85,434 | 68,378 | 104,044 | 76,906 | 63,740):
∴ Price remains well above the Kumo cloud – full bullish confirmation;
∴ Tenkan and Kijun are aligned in bullish configuration, widely spread;
∴ Future cloud projects bullish momentum continuation.
✴️ Conclusion: Complete Ichimoku structure signals dominant cycle strength.
⊢
▦ MACD (12,26,9) – (2,344 | 16,426 | 14,083):
∴ MACD line remains above the signal, maintaining a monthly buy signal;
∴ Histogram shows mild expansion, but slower than previous bull cycles;
∴ Momentum is positive but decelerating.
✴️ Conclusion: Momentum remains intact, but peak cycle force may have passed.
⊢
▦ RSI (14) – (68.82 | MA: 67.35):
∴ RSI approaching overbought threshold, hovering near 70;
∴ Momentum is firm but shows resistance to further extension;
∴ Historical comparison to 2020 suggests possible ignition or exhaustion point.
✴️ Conclusion: RSI signals potential tension zone - breakout or reversal ahead.
⊢
▦ VPT (14,8) – (100):
∴ Volume Price Trend has plateaued at its max threshold;
∴ Lack of new highs despite price advance suggests fading directional volume;
∴ Often a signal of accumulation slowdown or redistribution.
✴️ Conclusion: Buyer strength may be waning beneath the surface.
⊢
🜎 Strategic Insight - Technical Oracle:
∴ Market structure remains bullish across all core indicators;
∴ Overextension from key moving averages and flattening momentum call for tactical caution;
∴ Any macroeconomic pressure could trigger a local top, without compromising the broader trend.
⊢
∫ II. On-Chain Intelligence – (Source: CryptoQuant):
▦ Realized Price & LTH – ($47,000):
∴ Market price is well above the realized price baseline;
∴ Indicates majority of holders are in profit — structurally bullish;
∴ However, this also creates a risk of profit-taking if confidence drops.
✴️ Conclusion: Strong support floor, but latent pressure exists.
⊢
▦ SOPR - (Spent Output Profit Ratio) – (1.013):
∴ Above 1 means active profit-taking;
∴ Downward slope shows this is starting to cool;
∴ Critical to monitor for a break below 1 - would shift dynamic.
✴️ Conclusion: Still healthy, but at the edge of distribution risk.
⊢
▦ NUPL – (Net Unrealized Profit/Loss) - (0.554):
∴ Unrealized profit remains dominant;
∴ Readings above 0.5 historically precede consolidation or pullbacks;
∴ Still distant from euphoric tops, but entering alert zone.
✴️ Conclusion: Market still in profit expansion phase - but under surveillance.
⊢
▦ MVRV - (STH vs LTH) – (STH: 1.0 | LTH: 3.1 | Global: 2.2):
∴ STH neutral, LTH moderately elevated but not excessive;
∴ Market is mature, but not overheated;
∴ Still in a zone that supports further upside with restraint.
✴️ Conclusion: Healthy balance between holders - no imminent top confirmed.
⊢
▦ CME Futures Open Interest:
∴ Sharp rise in open interest across expiry horizons;
∴ Sign of speculative leverage building;
∴ Historically correlates with volatile price action post-FOMC or macro events.
✴️ Conclusion: Liquidity pressure is rising - extreme caution warranted.
⊢
🜎 Strategic Insight - On-Chain Oracle:
∴ On-chain structure mirrors technical signals - strong trend, but cautious undertone;
∴ No major signs of reversal, but profit saturation could act as gravity if macro shocks occur;
∴ Market is exposed, not exhausted.
⊢
⧉ III. Contextvs Macro–Geopoliticvs – Interflux Economicus:
▦ Fed Chair Powell (Upcoming):
∴ Powell speaks today (June 18); core expectation is rate hold;
∴ Market bracing for hawkish tone: fewer projected cuts and emphasis on inflation resilience;
∴ Historically, Bitcoin has reacted with -2% to -5% dips to hawkish FOMC tone.
✴️ Conclusion: Macro tension peak. Powell’s tone may dictate the next 30-day candle.
⊢
⚜️ 𝟙⟠ Magister Arcanvm – Vox Primordialis!
⚖️ Wisdom begins in silence. Precision unfolds in strategy.
⊢
⊢
⌘ Codicillus Silentii – Strategic Note:
∴ The technicals are strong, the on-chain base is stable, and the macro setup is explosive;
∴ This is a tension point, not a resolution point - silence before decision;
∴ Precision now is not found in action, but in observation.
⊢
⌘ Market Status:
✴️ Position: " Cautiously Bullish. "
✴️ Tactical Mode: Observation Priority – No immediate entry without Powell clarity.
⊢

Btcusd Short BOS of H4 and H1 timeframe. And a reversal is about to happen because both h4 & h1 tfs have created new main low in market structure.
BTC on the Daily: Bearish Structure Locked In?So, on the daily, price is in a clear bearish context.
PSAR is bearish
MLR < SMA < BB center
We're about to close below the 50MA
Price already broke below the Higher Lows trendline and the December 2024 top
At this point, it all depends on the macro situation and the FOMC tone tonight.
If the outcome is positive, there's a chance price rebounds.
If not, the chart looks ready to dive.

BTCUSD like to reach level 107375BTC USD is in a reversal zone and likely to reach level 107375.00
This is for educational purpose only. Not an investment or financial advise.

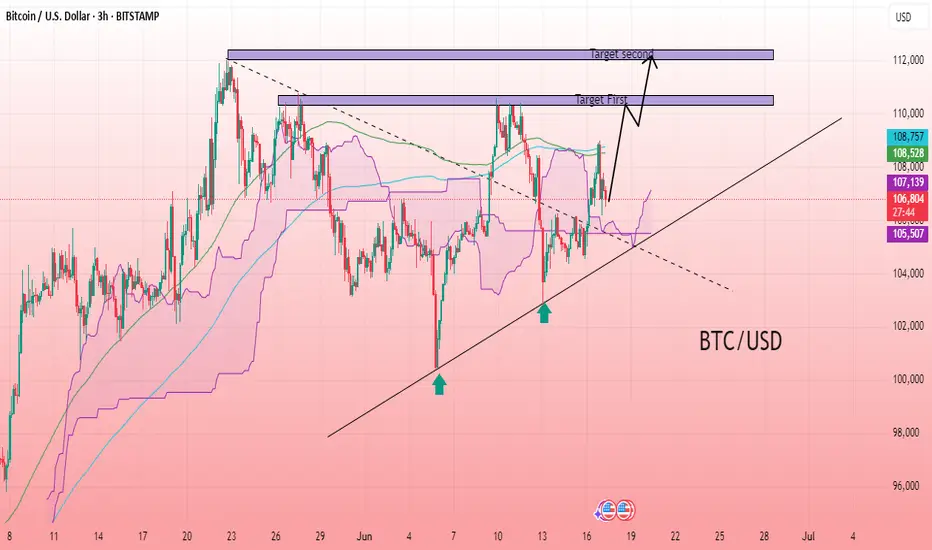
BTC/USD 3H CHART PATTERNThe BTC/USD 3-hour chart shows a bullish reversal forming from a higher low structure along a rising trendline, indicating increasing buyer strength. Price action has broken above the Ichimoku cloud and is now testing resistance levels, suggesting bullish momentum. The chart also highlights confluence with dynamic support from the 250 and 370-period DEMA indicators, adding to the strength of the uptrend. A breakout above current resistance may lead to continuation toward the marked target zones. Overall sentiment favors a bullish move with clear upside potential if momentum sustains and no major rejection occurs from the resistance zones.
Entry Point: 106,600
First Target: 110,360
Second Target: 112,000
BTC/USD H1 CHART ANNALSIS 18/6/2025
Trading Setup and Strategy Explanation:
Buy at:1042.000
Resistance at:103700
Important Note:
Resistance should be above the current price, not below. If 105,700 is below 106,800, it typically indicates support, not resistance.
**Corrected Interpretation:**
Here's how your setup likely looks:
- Buy Entry:** 104.200
Support (not resistance) 103700
Target 1:108.000
Target 2: 110.000
Level Type:
- 105,700 Support (Stop-loss zone)
- 104.200 Entry
- 10.7000Target 1
Trade Notes:
- If BTC holds above 104200, your long position is technically supported.
- A break below 105,700 might invalidate the bullish setup — consider a stop-loss below that.
- Momentum toward 110K–112K is possible if the market breaks out of short-term consolidation or reacts positively to macro news.
**Strategy Preference:**
Would you like a chart or confirmation based on technical indicators (RSI, trendlines, volume, etc.)?

The Bitcoin Manipulation Trick - How They Lure You Into the Trap📉 Bitcoin spends more time in deep drawdowns than at its peaks. Historically, BTC has spent over 80% of its existence trading 80-90% below its all-time highs, yet people keep falling for the illusion of wealth.
🧐 Here’s how the cycle works:
1️⃣ They drive up the price to make it enticing for new buyers.
2️⃣ You FOMO in at the highs, believing in the "next big wave."
3️⃣ Then they crash it, wiping out weak holders.
4️⃣ They keep it suppressed for years, forcing everyone out, via margin calls, financial strain, or sheer exhaustion.
5️⃣ When enough have capitulated, they restart the cycle.
📊 Historical Evidence:
- 2013 Crash: Over 400 days down 80%+ before recovery.
- 2017 Crash: Nearly 3 years below 80% of ATH.
- 2021 Drop: More than a year stuck 75% below peak.
🔎 If you’re buying now, be ready to:
⛔ Lose access to your money
⛔ Keep covering margins
⛔ Wait years for recovery, if it ever happens …
They play the same trick, every time. If you don’t recognize it, you’re just another part of the cycle. 🚀🔥
INDEX:BTCUSD NASDAQ:MARA NASDAQ:COIN NASDAQ:TSLA TVC:GOLD TVC:SILVER NASDAQ:MSTR TVC:DXY NASDAQ:HOOD NYSE:CRCL

Bitcoin And The 50 MABitcoin continues to consolidate in a tight range just below the $112,000 resistance, with the price currently hovering around $104,600. The chart shows clear horizontal support at $105,787 and dynamic support from the 50-day moving average – which has once again provided a modest bounce after being tested multiple times this month.
So far, the structure remains healthy but indecisive. BTC is printing a series of higher lows since the March bottom, but the repeated rejection near $112,000 raises the possibility of a developing lower high – a potential early signal of waning bullish momentum if follow-through selling emerges. Volume is declining slightly, suggesting a wait-and-see mode as the market anticipates macro events like the Fed meeting.
Overall, until Bitcoin breaks above $112K with conviction or loses $105K and the 50 MA, this chop is likely to continue. Bulls want to see a clean breakout and strong candle close above resistance, while bears are watching for a break back below $100,718 to open up downside potential toward $92,817.

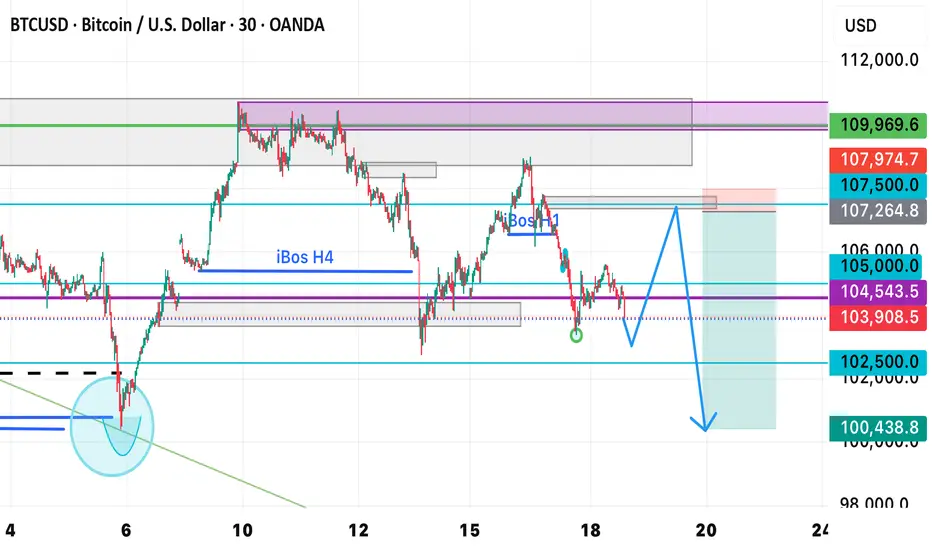
June 17 Bitcoin Bybit chart analysisHello
This is Bitcoin Guide.
It's been a while.
I took a break recently because the participation rate was not good.
Since it's been a while since I did an analysis, I did it in a short form,
I hope you enjoy it.
If you "follow"
You can receive real-time movement paths and comment notifications on major sections.
If my analysis was helpful,
Please click the booster button at the bottom.
Here is the Bitcoin 30-minute chart.
I created a strategy based on the possibility of sideways movement in Nasdaq and the rebound of Tether Dominance.
* When the blue finger moves,
It is a two-way neutral short->long switching strategy.
1. $106,792.2 short position entry point / stop loss price when orange resistance line is broken
2. $105,082.8 long position switching / stop loss price when green support line is broken
3. $107,579.9 long position 1st target -> Top 2nd target price
If it goes down from the current position,
Check the bottom section -> up to $103,194.3.
Please use my analysis as a reference only
I hope you operate safely with principle trading and stop loss price.
Thank you.

Bitcoin - Trend Shift Confirmed, Eyes on $102.8K LiquidityMarket Context
Bitcoin showed signs of exhaustion after a strong short-term rally within a clean upward channel on the 1H chart. Price action had been respecting the trend structure until a key deviation occurred near $108,500, where we saw an internal liquidity sweep that hinted at potential distribution.
Fake-Out Confirmation and Shift in Momentum
After taking out local highs around $108.5K, price failed to continue higher and instead reversed sharply, confirming the sweep as a classic fake-out. This kind of internal liquidity grab is typically used to trap breakout buyers before reversing and targeting previous lows.
Break of Structure and Channel Retest
The rising channel was broken convincingly, and price has now retested the underside of the channel, aligning with the 50% equilibrium of the entire high-to-low range. This reinforces the bearish bias and suggests the market has likely shifted from accumulation to distribution.
Downside Targets and Key Levels
Immediate support sits around $104.6K, which served as a consolidation base during the earlier run-up. If this level fails to hold, the next key target would be a sweep of the previous significant low at $102.8K. This area is marked as a point of interest and could offer a reaction or reversal.
Price Expectations and Trade Outlook
As long as price remains below the broken channel and under $107K, the bearish scenario remains in play. I’m watching for bearish continuation into $104.6K first, and a potential full sweep toward $102.8K if that support fails.
Conclusion
The internal sweep followed by impulsive rejection, combined with a clear channel breakdown and retest, shifts the bias to bearish. A move into the $104.6K region seems probable, with a lower liquidity target at $102.8K in sight if downside pressure accelerates.
Disclosure: I am part of Trade Nation's Influencer program and receive a monthly fee for using their TradingView charts in my analysis.
___________________________________
Thanks for your support!
If you found this idea helpful or learned something new, drop a like 👍 and leave a comment, I’d love to hear your thoughts! 🚀

BTCUSD Analysis UpdateBTC/USD Analysis Update 📈
Bitcoin has rebounded successfully after touching the 103500 support level and is currently trading around 105500. However, the ongoing correction may continue to test the psychological support at the 100000 round number in the short term ⚠️.
Key Points:
Support Bounce 🎯: BTC found buying interest at 103500, in line with our previous strategic analysis.
Immediate Resistance 📉: The current rebound faces direct resistance near 106000 (200-hour moving average).
Downside Risk 📉: Failure to hold above 105000 could trigger another decline toward 100000.
Risk Management:
Long positions should set stop-loss below 103000 ⛔️.
Short entries may consider the 106000–107000 range, targeting 102500 and 100000
⚡️⚡️⚡️ BTCUSD ⚡️⚡️⚡️
🚀 Buy@ 102500 - 103500
🚀 TP 106000 - 106500
🚀 Sell@ 106000 - 106500
🚀 TP 103500 - 101500
Accurate signals are updated every day 📈 If you encounter any problems during trading, these signals can serve as your reliable guide 🧭 Feel free to refer to them! I sincerely hope they'll be of great help to you 🌟 👇

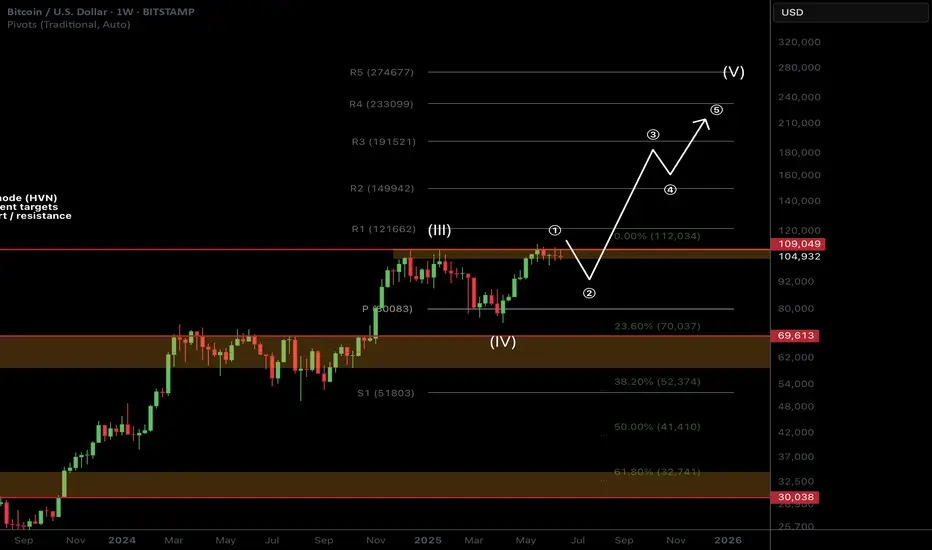
BTC Macro Analysis☕ 𝙂𝙈. CRYPTOCAP:BTC macro analysis update...
📈 𝙇𝙤𝙣𝙜 𝙩𝙚𝙧𝙢 outlook remains unchanged and recent price action is barely a blip on the weekly chart. SD+2 target is still $211k as a blow off top.
📉 𝙎𝙝𝙤𝙧𝙩 𝙩𝙚𝙧𝙢 outlook has investors looking lower towards the $92K target but this isn't guaranteed to be reached and price action may front those who wait.
War escalation's and retail selling are keeping price suppressed as price changes hands to private companies and large wallets.
The time for patience continues. Money is made in the sitting, weathering volatility, not flipping in and out of trades on every bit of news and price movement
𝙏𝙚𝙘𝙝𝙣𝙞𝙘𝙖𝙡 𝘼𝙣𝙖𝙡𝙮𝙨𝙞𝙨
Price is consolidating under all time high resistance. Consolidation under resistance has high probability of breaking out, the longer it remains the higher the probability.
Elliot Wave (EW) analysis suggests a motif wave ended with the poke above all time high (per the EW rules), with a wave 2 retracement underway. Price remains above the daily pivot (bullish) but below the DEMA (bearish). A triangle could still be forming but this is not my preferred EW count.
Safe trading