Btc Short position Btc short position frame 15 min
Waiting the confirmation and sell
Flag pattern at 15 min
BTCUSD.PM trade ideas

Bitcoin’s Cup & Handle Brewing — $150K in Sight???✅ Cup Formation
Left rim near $111K
Rounded bottom down to ~$75K
Full recovery back to $112K
Volume declined into the bottom and rose on the right side — textbook structure
✅ Handle Formation
Shallow pullback from $112K to ~$102K
Occurring above prior resistance, now acting as support
Forming a clean downward-sloping channel with declining volume — ideal pre-breakout setup
🎯 Measured Move Target
Cup depth: ~$36K
Breakout above $111K projects toward $135K–$150K
🧠 Confirmation Triggers
Break and daily close above $112K
Volume spike above 20-day average
Stochastic RSI turning upward from oversold range
⚠️ Breakdown Note
Pattern remains valid as long as BTC holds above ~$93K (50% of the cup depth).
The handle may extend lower within the channel before breakout.
⌛️ TIME FRAME
If no breakout by August then Im probably wrong 😑

Bitcoin top on October 2025?To estimate the potential top date of the current Bitcoin bull market, we can analyze the timeframes of the previous two bull markets.

NVIDIA Can Go PARABOLICMartyBoots here , I have been trading for 18 years and sharing my thoughts on NVIDIA here.
People are scared with war and high stock market but NVDA could go parabolic
Watch Video for more info


Can You belive That . QuicK update to my new strategy Bitcoinit will reach the zone , he is going bearich , until the next key level
₿ Bitcoin: SlippedAfter holding steady for two days, Bitcoin broke lower yesterday, confirming a setback within green wave B. This countertrend move delays the anticipated climb, which we still expect to reach its peak in the upper blue Target Zone (coordinates: $117,553 – $130,891). From there, bearish wave C should take over. The upper blue zone remains a tactical area for partial profit-taking or hedging long positions with shorts. Wave C is expected to drive the price sharply lower into the blue Target Zone (coordinates: $62,395 – $51,323), where we anticipate the completion of orange wave a. Orange wave b may trigger a corrective bounce, but ultimately, renewed downside should wrap up the intermediate correction of blue wave (ii). Still, there’s a 30% chance that Bitcoin forms a higher high as part of blue wave alt.(i)—temporarily breaching the upper blue zone.
📈 Over 190 precise analyses, clear entry points, and defined Target Zones - that's what we do.

HelenP. I Bitcoin may continue to decline to trend lineHi folks today I'm prepared for you Bitcoin analytics. The chart began with a steady rising movement near the trend line, where the price consistently respected upward support and showed healthy momentum. After each test of the trend line, BTC managed to rebound strongly, confirming this level as dynamic support. One of the key reactions came when the price bounced from the 100300 zone, forming a solid base and continuing its bullish leg toward the resistance area. However, buyers lost momentum after breaking through intermediate support levels and reaching the resistance zone between 110700 and 111700. This resistance zone acted as a ceiling, halting further upside and triggering a local reversal. Since then, the price has been gradually retreating, printing lower highs and showing early signs of weakness. Currently, BTCUSDT is retracing, and the structure suggests that the market is leaning toward another test of the trend line. Given the previous reactions and technical setup, I expect the price to pull back toward the 102500 points, which aligns closely with the trend line. That’s why my current goal is set at this zone. If you like my analytics you may support me with your like/comment ❤️

BTCUSD Breakout retest at 103.800Trend Overview:
Bitcoin BTCUSD remains in a bullish trend, characterised by higher highs and higher lows. The recent intraday price action is forming a continuation consolidation pattern, suggesting a potential pause before a renewed move higher.
Key Technical Levels:
Support: 103,800 (primary pivot), followed by 102,260 and 100,900
Resistance: 107.300 (initial), then 110,300 and 113,680
Technical Outlook:
A pullback to the 103,800 level, which aligns with the previous consolidation zone, could act as a platform for renewed buying interest. A confirmed bounce from this support may trigger a continuation toward the next resistance levels at 107,300, 110,310, and ultimately 113,680.
Conversely, a daily close below 103,800 would suggest weakening bullish momentum. This scenario would shift the bias to bearish in the short term, potentially targeting 102,260 and 100.900 as downside levels.
Conclusion:
Bitcoin BTCUSD maintains a bullish structure while trading above the 103,800 support. A bounce from this level would validate the consolidation as a continuation pattern, with upside potential toward the 107,300 area. A breakdown below 103,800, however, would invalidate this view and suggest deeper corrective risk.
This communication is for informational purposes only and should not be viewed as any form of recommendation as to a particular course of action or as investment advice. It is not intended as an offer or solicitation for the purchase or sale of any financial instrument or as an official confirmation of any transaction. Opinions, estimates and assumptions expressed herein are made as of the date of this communication and are subject to change without notice. This communication has been prepared based upon information, including market prices, data and other information, believed to be reliable; however, Trade Nation does not warrant its completeness or accuracy. All market prices and market data contained in or attached to this communication are indicative and subject to change without notice.

BTC/USD BUY SIGNAL ALERT Entry Point: 104,900BTC/USD BUY SIGNAL ALERT
Entry Point: 104,900
📈 Direction: BUY
🎯 Target 1: 106,000
🎯 Target 2: 108,000
🎯 Final Target: 112,000
🛑 Stop Loss: Use SL wisely – protect your capital
📊 Risk Management: Always manage your risk!
🕒 Trade Type: Short- to mid-term
💡 Ideal for breakout buyers
🔍 Watch price action around 105K zone
⚠️ High volatility expected – trade with caution
💰 Bulls gaining strength on key support
📈 Trend reversal signs are emerging
📌 Patience and discipline = key to success
📉 Avoid FOMO – follow your plan
🗓️ Stay updated on crypto news & events
📢 Let us know if you’re in this trade
✅ Like & share if this helped
🔥 More signals coming – stay connected
📍 BTC/USD Market Update – Watch Closed

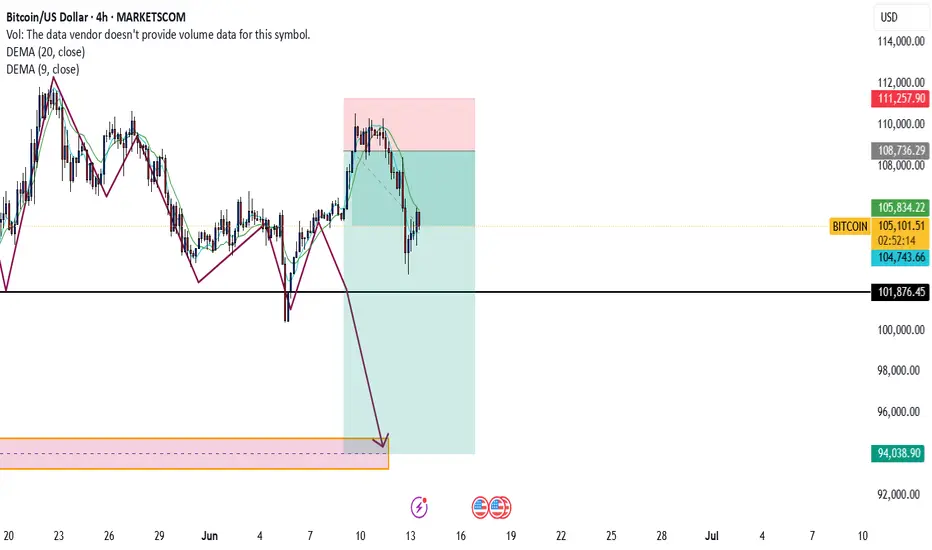
BITCOIN BOUNCES AT 50 MABitcoin continues to trade within a well-defined range, with price once again reacting cleanly off the 50-day moving average (blue) – a key dynamic support level that has consistently provided footing throughout this uptrend. Today’s candle is printing a modest bounce from that zone after briefly dipping below $105K, suggesting buyers are still defending trend structure despite recent volatility.
On the upside, $112,000 remains the key resistance. Price failed to break through this level twice in the past month, confirming it as a significant supply zone. A daily close above that threshold would mark a breakout and likely fuel momentum toward fresh highs.
Support is building around the $99,500–$100,000 region – a critical horizontal level that aligns with a prior breakout zone and marks the recent higher low. Below that, the next major support rests around $92,800, followed by $88,800, which served as the last major consolidation range before April’s breakout.
Momentum-wise, the rejection at $112K could still evolve into a lower high, but that scenario remains unconfirmed as long as price holds above $100K. The reaction off the 50 MA – the second clean tag in recent weeks – keeps the short-term structure intact. However, the lower volume on this bounce suggests some caution is still warranted.
From a broader trend perspective, Bitcoin is consolidating within a bullish continuation structure. As long as the 50-day MA continues to act as dynamic support and the $100K zone holds, the market retains a constructive bias. A strong daily close above $112K would likely signal the next leg higher – potentially toward $120K and beyond.
For now, this is a healthy range within an uptrend. Bulls want to see strength on the next test of resistance. Bears need a break of $100K to flip the narrative. Until then, this remains a textbook pause within trend – not a reversal.

WW3 IS COMING?! Stop kidding me. Today in X and my PM there were a lot of people who were screaming: “Oh nooo war is coming!!!!”
Guys, don’t freak out ahead of time. The same events happened a year ago (13-14th of April 2024) .
I don’t speak any politics here, just facts: Israel attacked Iran, then Iran attacked Israel. Finish. Everyone was afraid that the WW3 is coming, but it ended in a couple of days.
Something similar I expect to happen now too. No one need this war, what’s more - no one has spare billions&billions of dollars to fund it.
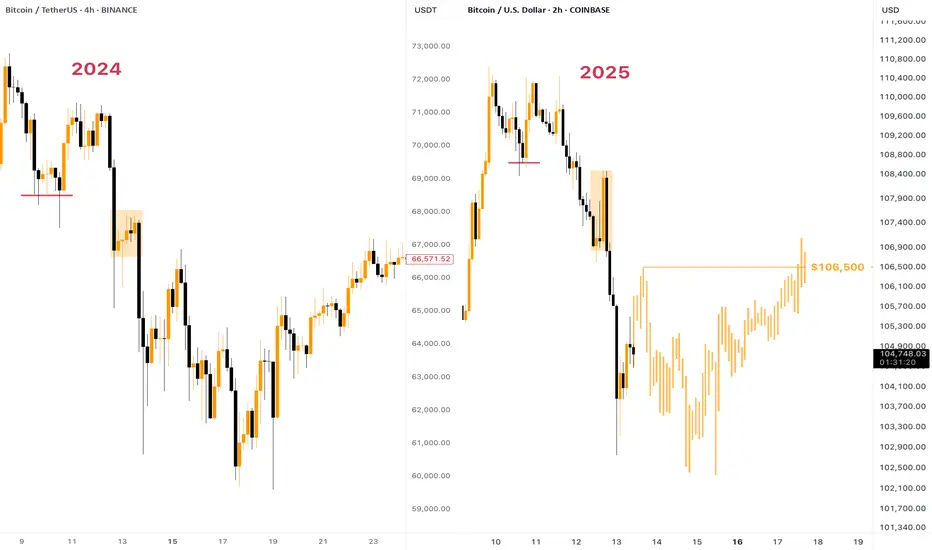
As for the chart — some fluctuations above the $101,000 support won’t do any harm to the global picture. More to say, the current chart literally copies the one from 2024: pump from the horizontal support that ended up with dump, then another fake pump and quick massive dump.
Expect to see some consolidation in the $101,000 - $105,000 range, then we can ride upwards.
Peace ✌️
BTCUSD Enter point 104700 target 105700 stop Loss 103900New trade setup:
- Buy BTCUSD at 104,700
- Target: 105,700 (1,000-point gain)
- Stop Loss (SL): 103,900 (800-point risk)
You're going long, expecting BTCUSD to rise. Let's see how it plays out! 💸📈
Will you hit your target?

Bitcoin at a Generational Crossroads : The $115k Decision Point Chart: BTC/USD, Monthly Timeframe
Bias: Neutral to Bearish if key resistance holds.
Idea: This is a long-term analysis based on historical price action within a multi-year channel.
Summary (The Thesis):
This analysis looks at Bitcoin's price action on the monthly chart, contained within a large, ascending parallel channel that has defined bull and bear cycles for years. We are currently testing the upper boundary of this channel, a historical resistance zone.
My thesis is that the $110,000 - $115,000 zone represents a critical decision point for the entire market. A failure to decisively break above this level could initiate a significant, multi-month pullback to reset market sentiment and gather liquidity before the next major leg up.
The Macro Analysis (The "Why") :
The Ascending Channel: As you can see on the monthly chart, Bitcoin's price has respected this ascending channel since 2017. The upper line has consistently acted as a major distribution zone and cycle top (marked with red arrows), while the lower line has served as a generational buying opportunity (marked with green arrows). We are currently at the upper line.
Historical Resistance: History shows that the first test of this upper channel boundary is rarely successful. The price often requires a significant consolidation or a deep correction before it can muster the strength to break into a new price paradigm.
Market Mechanics & Liquidity: From a market mechanics perspective, a massive number of longs have entered the market since the move up from the $70k-$75k range. A "huge pullback" would serve to liquidate these late, over-leveraged positions, allowing market makers to absorb liquidity and build the necessary foundation for a sustainable break of the all-time high later on.

BTC/USD Faces Key Support—What’s Next for Bitcoin? FenzoFx—Bitcoin dipped from its $112,000 monthly high, now trading near $104,900. Liquidity was swept, forming immediate support at $102,746.
Stochastic signals an oversold market, suggesting potential consolidation or an uptrend resumption. BTC/USD must close above $105,706 for bullish momentum, targeting $112,000.
A rejection at $102,746 may invalidate bullish outlooks, driving BTC toward $100,377.

btc weeklyCRYPTOCAP:BTC will literally unleash explosive power
pullbacks serve as a force for the next upswing
