BTCUSD.PM trade ideas

Wait for your EDGE...
Discipline is what separates professionals from amateurs.
Stay patient. Wait for your edge. Let the probabilities work in your favor.
👉 “Agree with this? Hit Boost to spread the message.”
#TradingPsychology #Discipline #BTC #Bitcoin #Forex
#TradingMindset #AlBrooks #TradingDiscipline #PriceAction #ForexTrading #CryptoTrading #StockMarket #MJTrading #TradingQuotes #TraderLife #MindOverMarkets


BUY BTCUSD now for a four hour time frame bullish trend continuBUY BTCUSD now for a four hour time frame bullish trend continuation ...............
STOP LOSS: 107,194
This buy trade setup is based on hidden bullish divergence trend continuation trading pattern ...
Always remember, the trend is your friend, so whenever you can get a signal that the trend will continue, then good for you to be part of it
TAKE PROFIT : take profit will be when the trend comes to an end, feel from to send me a direct DM if you have any question about take profit or anything...
Remember to risk only what you are comfortable with... trading with the trend, patient and good risk management is the key to success here

Bitcoin Is Looking For A Bullish ContinuationMorning all! Bitcoin has impulsive characteristics on 4h time frame, and we can clearly see five waves up that can send the price even higher after recent projected ABC correction. With the current impulsive recovery back above 106k area, it confirms that bulls are still here and we should be aware of further rally in July, especially if breaks above channel resistance line near 110k area. Seems like it's in wave (1) of a new five-wave bullish impulse, so after current wave (2) pullback, we can expect more gains within wave (3).

BTCUSD-SELL strategy. Monthly chart It looks a clear negative divergence case, and we are quite overbought. This requires again to alleviate the pressure and I feel $ 74k re-test is possible medium-term.
Short-term anything goes they say, and it feels it will try higher short term. just be careful for the longer-term situation.
Strategy SELL @ $ 108k-115k and take profit first @ $ 77k area.

BITCOIN enroute towards $112+!If wave 4 gets rejected from the wicks of wave 1...It's likely off to the races towards new highs on a wave 5 north!
That's a good trade set up on any Instrument!

BTC : Looking at the supplyPrice is stalling at the D @ 108,800 for some time now.
I think it is not because of a lack of demand. Just that there is no one selling. Owners prefer to keep the limited supply. Buyers are unwilling to chase after the few available at a higher price. We have a stalemate.
In 2022, to break this stalemate, price needs to drop, with sellers taking a profit and making supplies available. Then we will have buyers scrambling again to BUY.
Watch the OBV.
So, I should wait to BUY, but at the right price.
Good luck.

Bitcoin Approaches the $110,000 Level Once AgainDuring the latest trading session, Bitcoin gained over 3%, as renewed buying momentum entered the market. For now, the cryptocurrency appears to be approaching its historical highs once again, driven largely by the growing weakness of the U.S. dollar. This is reflected in the DXY index, which measures dollar strength and is now hovering around 96 points, consolidating a bearish trend not seen in years. As the dollar continues to weaken, BTC could benefit from the environment, maintaining consistent buy-side pressure in the short term.
Lateral Range Still Intact
Despite recent upward movements visible on the chart, it’s important to highlight that BTC has begun to consolidate within a defined short-term lateral range, marked by a ceiling at $110,000 and a floor near $100,000. While buying pressure has shown signs of resurgence, it remains insufficient to break out of the range, which continues to dominate in the short term. If price fails to break through these key levels, a wider consolidation channel could develop in the coming sessions.
Indicators:
MACD: The MACD histogram continues to hover near the neutral zero line, indicating a stable balance between buying and selling forces. If this behavior persists, neutrality could become more dominant in the short term.
ADX: A similar pattern is emerging on the ADX indicator, as the line remains below the neutral 20 level. This suggests that the average volatility of recent moves is steadily decreasing, and unless the ADX starts to climb, Bitcoin may struggle to sustain the current bullish momentum recently seen on the chart.
Key Levels to Watch:
$110,000 – Major Resistance: This level marks Bitcoin’s historical high. If buying pressure pushes price back to and above this level, it could signal the reignition of a strong bullish bias and set the stage for a resumption of the previous uptrend.
$106,000 – Mid-Range Support: The midpoint of the current consolidation range. It acts as nearby support and may serve as a barrier against short-term pullbacks.
$100,000 – Psychological Support Zone: This level aligns with recent multi-week lows. A return to this level could jeopardize the short-term bullish bias that has attempted to hold over recent sessions.
Written by Julian Pineda, CFA – Market Analyst

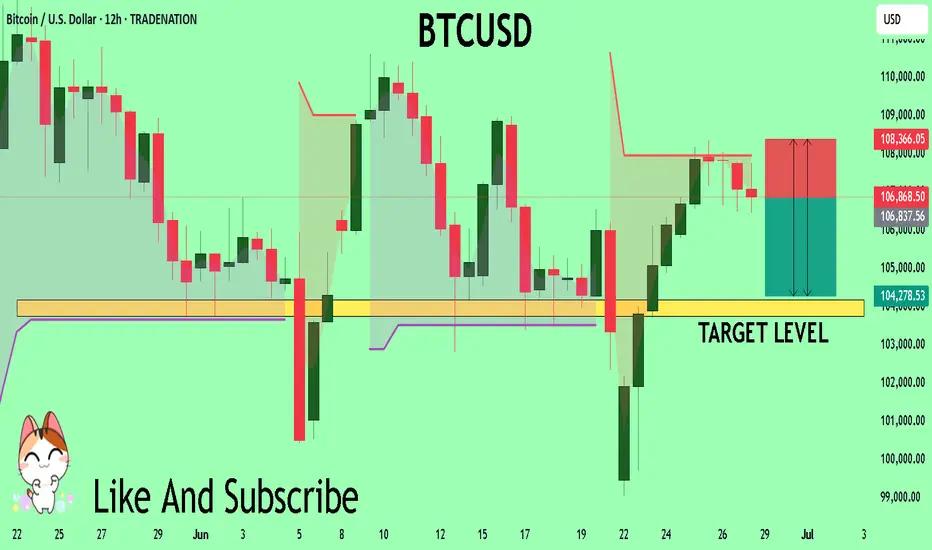
BTCUSD Trading Opportunity! SELL!
My dear subscribers,
This is my opinion on the BTCUSD next move:
The instrument tests an important psychological level 10686
Bias - Bearish
Technical Indicators: Supper Trend gives a precise Bearish signal, while Pivot Point HL predicts price changes and potential reversals in the market.
Target - 10417
My Stop Loss - 10836
About Used Indicators:
On the subsequent day, trading above the pivot point is thought to indicate ongoing bullish sentiment, while trading below the pivot point indicates bearish sentiment.
Disclosure: I am part of Trade Nation's Influencer program and receive a monthly fee for using their TradingView charts in my analysis.
———————————
WISH YOU ALL LUCK
Long Setup Loading… (BTC)My key demand zone for potential long setup – confluence of Fibonacci 0.66/0.618 and liquidity grab expected.
This highlighted golden zone will be my key area to look for long entries. It's aligned with the 0.66–0.618 Fibonacci retracement from the previous impulse, and I expect potential liquidity sweep below recent lows before a strong bullish reaction.

Btcusd techinical analysis.Btcusd.techinical analysis next move posibale at h1 time frame.not finchinical advice.

BTC with potential for $115,000/$120,000🔍 Market structure (Price Action)
📈 Trend:
The market previously formed higher highs (HH) and higher lows (HL) – a classic uptrend.
Then there was a correction and a lower high (LH) and lower low (LL) appeared – a potential change in the trend to a downtrend.
The last two lows are again HL (Higher Lows) – suggesting an attempt to return to the uptrend.
🔄 Key support and resistance levels
✅ Resistance (green horizontal lines):
117.469 – local resistance and potential breakout target from the current range.
115.802 – confirmed resistance from previous consolidations.
111.814 – strong local resistance (LH – Lower High formed there).
109.341 – current resistance, the price is currently testing it.
🛑 Support (red horizontal lines):
105.370 – local support, price reacted at this level in recent days.
102.650 – important support, level of previous HL.
100.095 – consolidation level before breaking out upwards.
98.213 – last LL – very important level in the context of defending the structure.
🧭 Structure of peaks and troughs
HH: Higher High – confirmed the previous uptrend.
LH: Lower High – first warning about changing the structure to down.
LL: Lower Low – confirmed a potential change to downside.
HL (x2): two more higher lows – suggest a possible return to growth.
📊 Stochastic RSI (at the bottom of the chart)
The oscillator is currently in the overbought zone (>80), approaching a downward crossover.
It suggests a possible short-term halt in growth or correction.
But in strong trends it may "stick" to the upper range.
📌 Potential scenarios:
🟢 Bullish:
If the price breaks above 109.341, it may test 111.814 and then 115.802.
Continuation of the HL → HH formation will confirm a trend reversal and further growth.
🔴 Bearish:
If the price does not stay above 109k and breaks below 105.370, there is a risk of a test of 102.650 and lower.
A break of 100.095 and especially 98.213 will negate the growth structure.
🧠 Conclusions:
The market is at a key decision point - HL formation vs. resistance zone.
Buyers' strength will be confirmed only after breaking 111-112k.
Stochastic RSI warns of potential pullback or consolidation.

$BTC Breakout $108k soonCRYPTOCAP:BTC is showing strength after bouncing from the $105K support zone.
It’s now trying to break above $108.5K.
If that happens, the next target could be around $111K–$112K.
The trend looks positive with growing momentum, but if BTC drops below $105K, this move could fail.
For now, bulls are in control.
Let’s see if they can keep it going.
DYRO, NFA

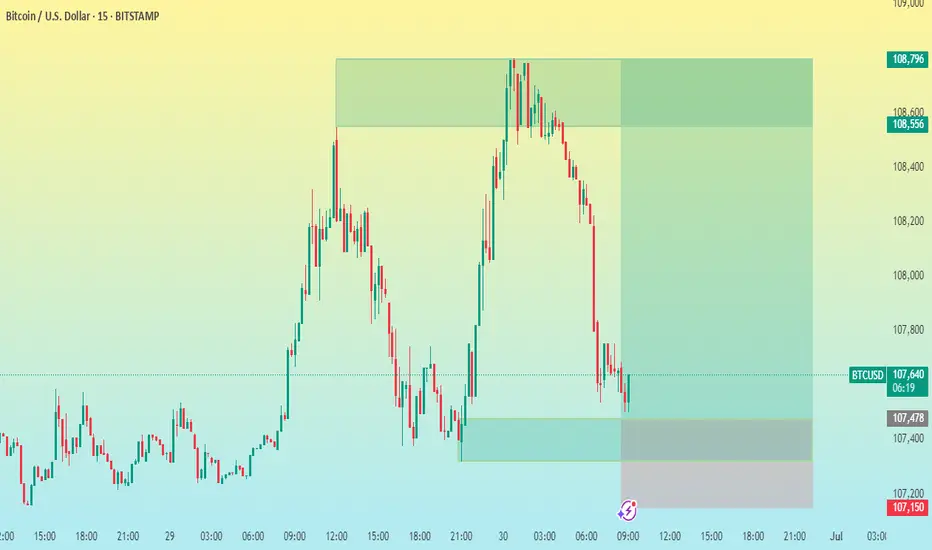
BTC/USD 15M CHART PATTERNHere's a summary of your BTCUSD 15-minute trade setup:
---
Trade Type: Buy
Entry Price: 107,500
Take Profit Levels:
1. TP1: 108,000
2. TP2: 108,300
3. TP3: 108,796
Stop Loss: 107,150
---
Risk-Reward Analysis:
Risk (SL): 107,500 - 107,150 = 350 points
Reward:
TP1: 500 points → ~1.43 R/R
TP2: 800 points → ~2.29 R/R
TP3: 1,296 points → ~3.70 R/R
---
Would you like me to turn this into a trading journal entry, script (e.g., for TradingView/MetaTrader), or analyze the probability based on recent price action?
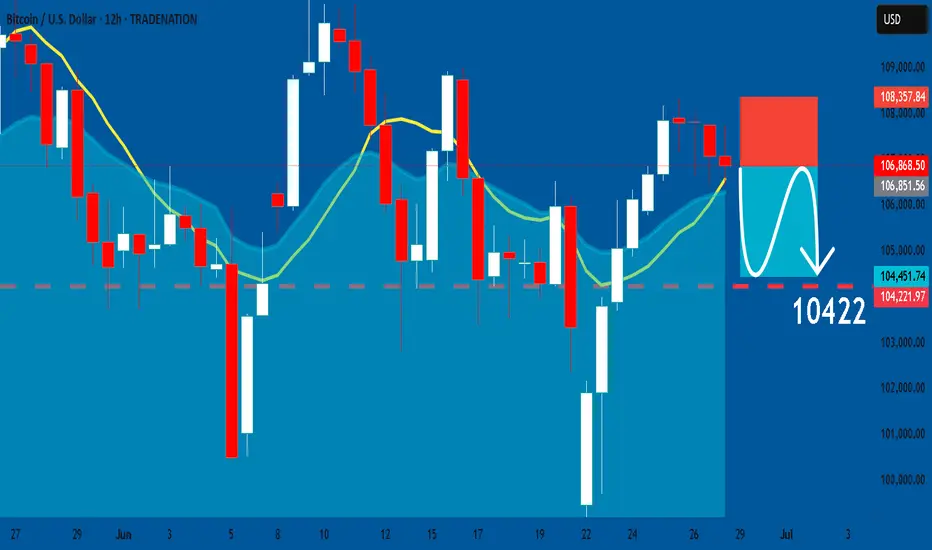
BTCUSD: Bearish Continuation & Short Signal
BTCUSD
- Classic bearish pattern
- Our team expects retracement
SUGGESTED TRADE:
Swing Trade
Sell BTCUSD
Entry - 10686
Stop - 10837
Take - 10422
Our Risk - 1%
Start protection of your profits from lower levels
Disclosure: I am part of Trade Nation's Influencer program and receive a monthly fee for using their TradingView charts in my analysis.
❤️ Please, support our work with like & comment! ❤️
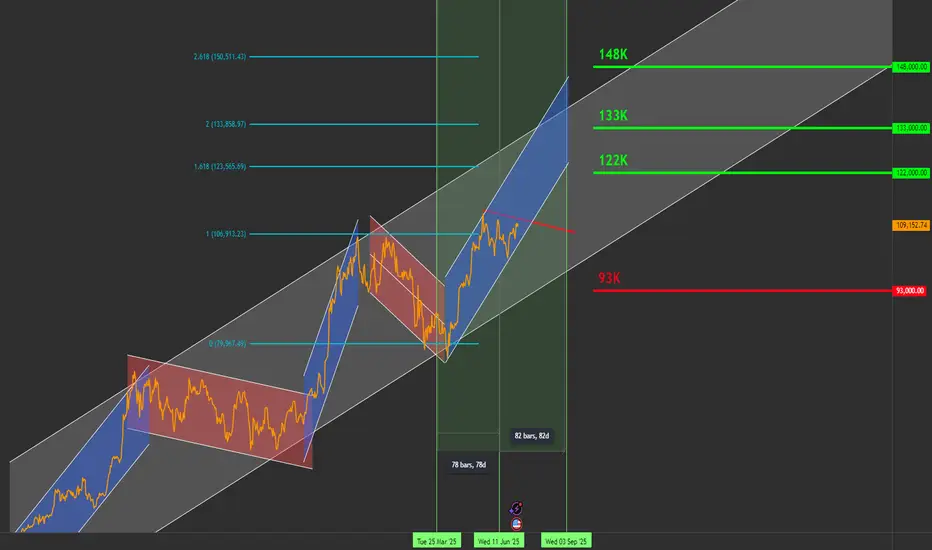
Bitcoin Roadmap to $144K by September – Daily Chart Breakout SetHello traders,
I'm sharing my current outlook on Bitcoin using the daily timeframe. Price is ~109K below a key descending trendline (in red), which has defined the structure since 21 May.
🔍 Key Levels to Watch:
Resistance: $111,000
Support: $91,000
Current Price: ~$109,000
⚡ Breakout Scenario:
If Bitcoin closes above $111K on the daily chart, backed by strong volume (ideally 30% above the 20-day average), I expect the next targets to unfold as:
✅ $122,000
✅ $133,000
✅ $144,000
🗓️ Target date for $144K: Around 22 September 2025
This projection is based on a pivot structure I’m tracking:
🟢 25 March 2025: Pivot low at ~$84K
🔴 12 June 2025: Pivot high
🟡 Expected pivot high: ~4 September 2025 (if symmetry holds)
This pattern suggests a 1-2-3 formation that could lead to a breakout move.
🧯 Failure Scenario:
If BTC fails to break out, I’m watching for a pullback toward the $91K support zone.
🛑 Current Stance:
I’m not in a position yet. Waiting for a daily candle close above $111K with volume confirmation and momentum indicators.
📣 Stay Updated
I’ll be sharing daily updates as the price action evolves.
Follow me here on TradingView, and feel free to share your analysis or ask questions in the comments!
🏷️ Hashtags:
#BTCUSD #BitcoinAnalysis #CryptoTrading #BTC #TechnicalAnalysis #SwingTrade #BreakoutSetup
Let me know your comments.
BTC USDT 150,000$ TARGET . BULLISH FLAG AND POLE
Perfect bullish flag and pole pattern on the daily chart for BTC.
A successful breakout from the current channel will pump the price to the range of 145-150k $.

Bitcoin takes a deeper dive on wave 4!The Daily: Dormant Bitcoin wallets wake after 14 years to move billions of dollars in BTC, House GOP declares ‘Crypto Week,’ and more!

July 4 Bitcoin Bybit chart analysisHello
This is Bitcoin Guide.
If you "follow"
You can receive real-time movement paths and comment notifications on major sections.
If my analysis was helpful,
Please click the booster button at the bottom.
Here is the Bitcoin 30-minute chart.
There is no Nasdaq index announcement today.
There is a possibility that Nasdaq will fall sharply,
but even if it moves sideways, the probability of the strategy succeeding increases.
On the left, with the purple finger,
I connected the 2nd section of the long position that I entered yesterday.
*When the blue finger moves,
Bidirectional neutral
Short->Long or long waiting strategy
1. 109,638.1 dollars short position entry section / cut-off price when orange resistance line is broken
2. 108,764.4 dollars long position switching / cut-off price when green support line is broken
3. 110,273.1 dollars long position 1st target -> target price in order from Miracle
If the strategy is successful, I left a simulation with the pink finger,
so please refer to it.
Those who held long positions yesterday, please check if the purple support line is broken,
If it falls immediately from the current position or
If the pink resistance line is not broken when the 1st section at the top is touched,
It is a vertical decline section,
And if the 109,638.1 dollar short position entry section at the top is not touched,
It is a long waiting strategy at the 2nd section at the bottom.
I think it would be good to think of it as a game in the 1+4 section.
From the 2nd section breakout, I have marked the Bottom -> 3rd section at the bottom.
Up to this point, please just refer to and use my analysis,
I hope you operate safely with principle trading and stop loss prices.
Thank you for your hard work this week.

$BTC/USDT 6H Update BTC has broken out and is now retesting the breakout zone.
If this level holds, we could see a push toward $111K–$112K.
Key support remains around $108K.
DYRO, NFA

Bitcoin Faces Impending Drop to Mid-30,000sAs of July 02, 2025, Bitcoin’s price chart, crafted by "RoadToAMillionClub" on TradingView, paints a concerning picture. Currently hovering at $107,831, the cryptocurrency appears to be teetering at the edge of its upper channel, signaling potential trouble ahead. The recent 0.51% dip may be just the beginning of a more significant decline.
The long-term upward trend, marked by a supportive orange line since 2018, has been a beacon for bulls. However, the green trend line projecting a drop toward the mid-30,000s range, around $37,932, suggests a looming correction. This level, a historical support zone, could become the next battleground as selling pressure mounts.
Market indicators point to overextension, with the price hitting a 4-day and 14-day high of $107,831 before the recent pullback. The speculative fervor that drove Bitcoin to these heights seems to be waning, increasing the likelihood of a bearish turn. Investors should brace for volatility, as the cryptocurrency may struggle to maintain its current altitude, potentially sliding toward the mid-30,000s in the coming months.

BTCUSD Bullish sideways consolidation supported at 101.780Trend Overview:
BTCUSD remains in a bullish trend, characterised by higher highs and higher lows. The recent intraday price action is forming a continuation consolidation pattern, suggesting a potential pause before a renewed move higher.
Key Technical Levels:
Support: 101,780 (primary pivot), followed by 100,380 and 98,184
Resistance: 109,170 (initial), then 111,600 and 114.140
Technical Outlook:
A pullback to the 101,780 level, which aligns with the previous consolidation zone, could act as a platform for renewed buying interest. A confirmed bounce from this support may trigger a continuation toward the next resistance levels at 109,170, 111,600, and ultimately 114,140.
Conversely, a daily close below 101,780 would suggest weakening bullish momentum. This scenario would shift the bias to bearish in the short term, potentially targeting 100.390 and 98,180 as downside levels.
Conclusion:
BTCUSD maintains a bullish structure while trading above the 101,780 support. A bounce from this level would validate the consolidation as a continuation pattern, with upside potential toward the 109,170 area. A breakdown below 101,780, however, would invalidate this view and suggest deeper corrective risk.
This communication is for informational purposes only and should not be viewed as any form of recommendation as to a particular course of action or as investment advice. It is not intended as an offer or solicitation for the purchase or sale of any financial instrument or as an official confirmation of any transaction. Opinions, estimates and assumptions expressed herein are made as of the date of this communication and are subject to change without notice. This communication has been prepared based upon information, including market prices, data and other information, believed to be reliable; however, Trade Nation does not warrant its completeness or accuracy. All market prices and market data contained in or attached to this communication are indicative and subject to change without notice.
