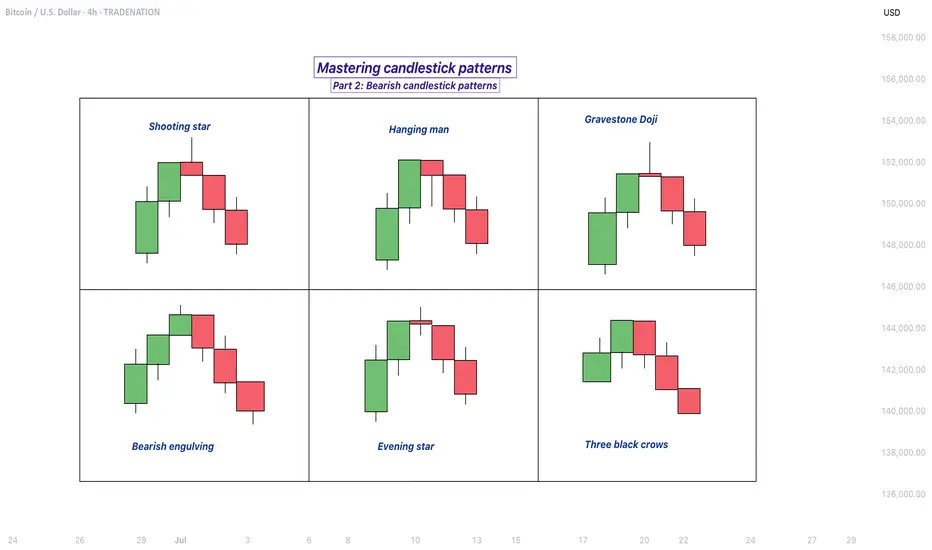
Mastering bearish candlestick patterns - How to use it!Bearish candlestick patterns are a cornerstone of technical analysis, relied upon by traders across financial markets to assess the likelihood of price reversals or continued downward trends. At their core, these patterns are visual representations of shifts in market sentiment, formed by the open,
Key facts today
Key stats
About Bitcoin
Bitcoin is the world’s most traded cryptocurrency, and represents the largest piece of the crypto market pie. It was the first digital coin and as such, remains the most famous and widely-adopted cryptocurrency in the world. It's the original gangster in whose footsteps all other coins follow. The birth of Bitcoin was the genesis of an entirely new asset class, and a huge step away from traditional, centrally controlled money. Today, many advocates believe Bitcoin will facilitate the next stage for the global financial system, although this — of course — remains to be seen.
Related pairs
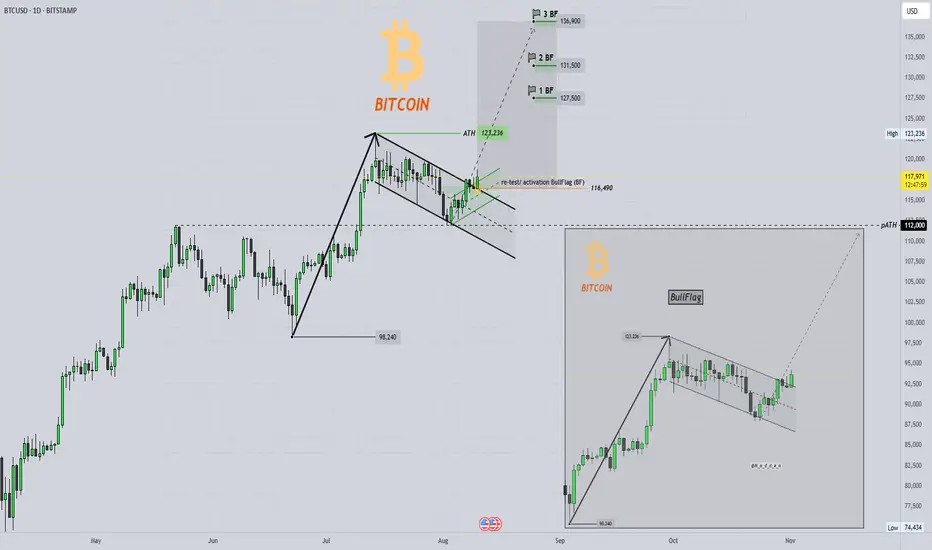
BITCOIN Bullflag and new all-time high ?!BULL FLAG and new all-time high 👀⏰
📇BTC daily-chart (BITSTAMP) and 💡everything important in the chart !
Bitcoin has broken out of its sideways consolidation and has recently successfully tested this channel (bull flag), thereby activating a potential bull flag.
The resulting targets (see example
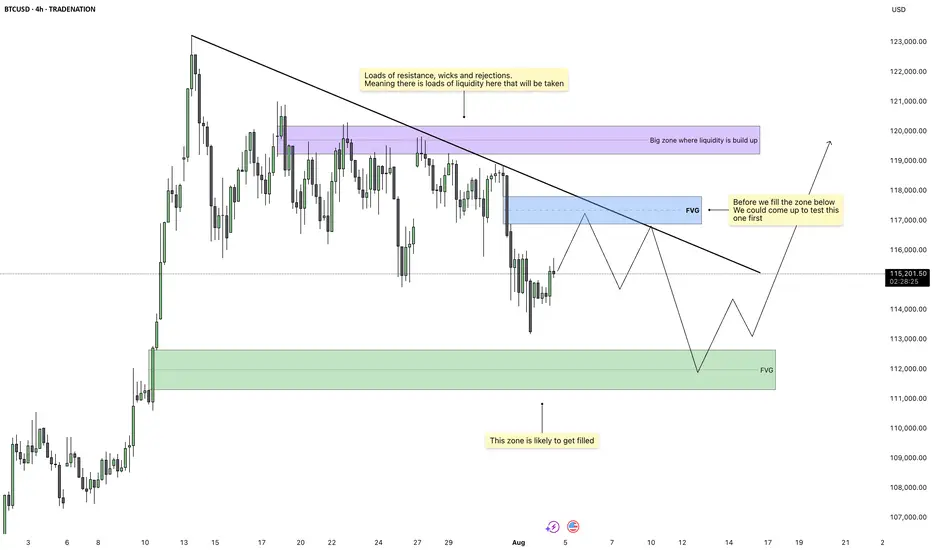
Bitcoin - Imbalance Fill Before Liquidity ExpansionBitcoin is trading inside a compressing structure beneath a clean descending trendline. Price action has been choppy but controlled, creating multiple zones of inefficiency that remain unfilled. We’re currently positioned between two major Fair Value Gaps, one above and one below, which gives us a c
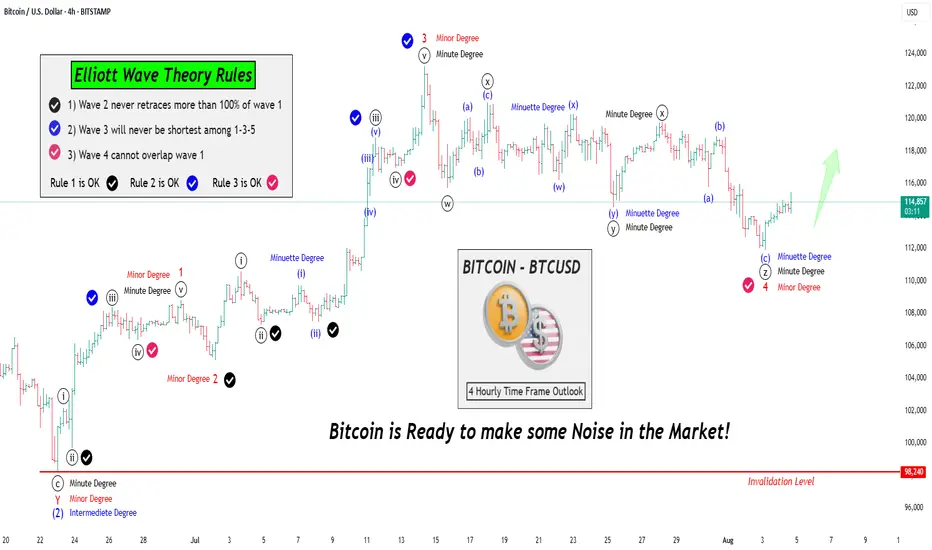
Let's learn & Apply Elliott Wave Rules on chart: BTCUSD BitcoinHello Friends,
Welcome to RK_Chaarts,
Friends, Today we are going to learn 3 Rules of the Elliott Wave theory, there are three principles and some patterns. Impulses move in a 1-2-3-4-5 pattern, either as an impulse or a motive wave. However, within impulses, there are three rules:
Rule No 1:
Bitcoin: 120K Break To Push 130Ks?Bitcoin has rallied off the buy signal that I wrote about over the previous week. In order to confirm follow through, price needs to CLOSE decisively above 120K this week. This means a solid candle close, NO pin bars. This needs to be followed by a new candle that breaks the previous candle high qui

BITCOIN Bounced on its 1D MA50. Bull Flag breaking soon?Bitcoin (BTCUSD) made a beautiful technical rebound on its 1D MA50 (blue trend-line), testing and holding it on 3 separate 1D candles. This has caused a short-term rebound so far, taking the price to the top of the Channel Down.
As we mentioned on previous analysis, if BTC breaks above that Channel

Bitcoin - The magical $1.000.000 level!🚀Bitcoin ( CRYPTO:BTCUSD ) is not done yet:
🔎Analysis summary:
Over the course of the past couple of months, we have been witnessing a bullish continuation on Bitcoin. After the all time high breakout, there is a high chance that this bullrun will continue and Bitcoin might even retest the re

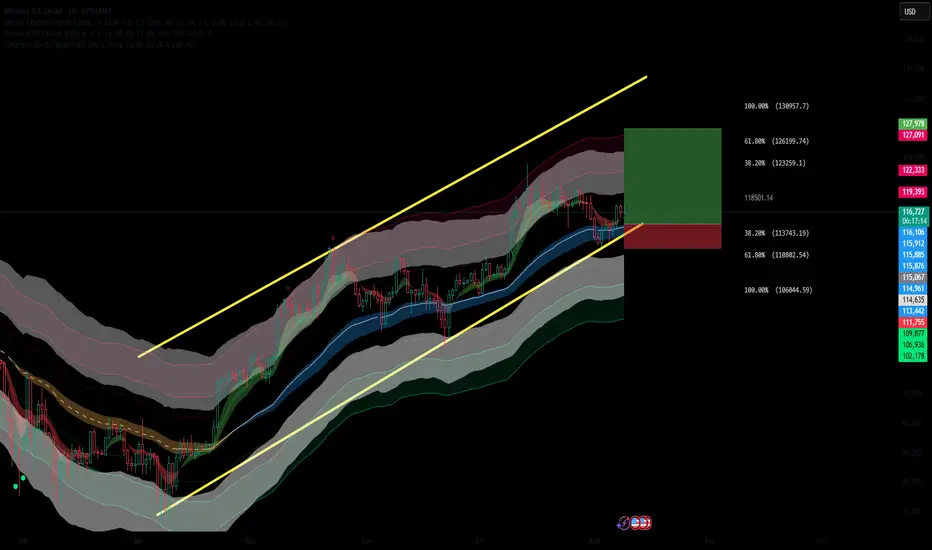
BTC Holding Strong: Fibonacci Levels Point to $130KBITSTAMP:BTCUSD is holding above a key dynamic support zone at the lower boundary of its ascending channel, with current price action signaling a potential continuation to the upside. This long setup is supported by multiple bullish confluences.
✅ Bullish Confluences:
Fibonacci Retracement Suppor
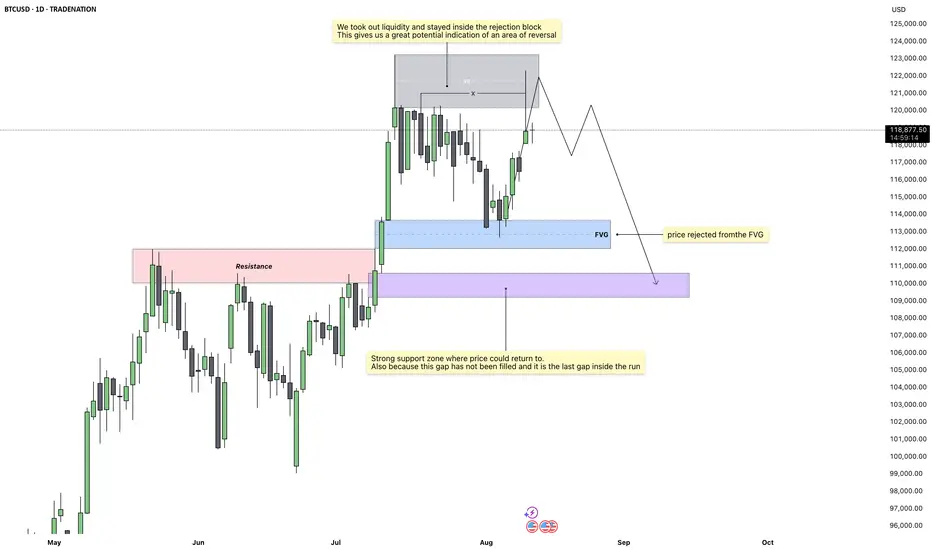
Bitcoin – The Last Stop Before the DropMarket Overview
Price action on the daily chart has shown a decisive move into a key rejection block after taking out recent liquidity. This is a classic sign of exhaustion in the current move, suggesting that momentum may now begin to shift in the opposite direction. The daily close reinforced thi
BITCOIN - IMPORTANT BREAKOUT !Hello Traders!
The Bitcoin failed to create a new lower low!
The price broke the resistance line!
So, I expect a bullish move🚀
____________
TARGET: 122700🎯

See all ideas
Displays a symbol's price movements over previous years to identify recurring trends.
Curated watchlists where BTCUSD is featured.

Gen 1 crypto: from little acorns grow
15 No. of Symbols

Proof of Work: Embracing the crunch
27 No. of Symbols
See all sparks
Discover funds exposed to Bitcoin and find another way to access the coin.
Frequently Asked Questions
Bitcoin (BTC) reached its highest price on Jul 14, 2025 — it amounted to 123,272.3 USD. Find more insights on the BTC price chart.
See the list of crypto gainers and choose what best fits your strategy.
See the list of crypto gainers and choose what best fits your strategy.
Bitcoin (BTC) reached the lowest price of 365.5 USD on Jan 29, 2016. View more Bitcoin dynamics on the price chart.
See the list of crypto losers to find unexpected opportunities.
See the list of crypto losers to find unexpected opportunities.
The safest choice when buying BTC is to go to a well-known crypto exchange. Some of the popular names are Binance, Coinbase, Kraken. But you'll have to find a reliable broker and create an account first. You can trade BTC right from TradingView charts — just choose a broker and connect to your account.
You can discuss Bitcoin (BTC) with other users in our public chats, Minds or in the comments to Ideas.