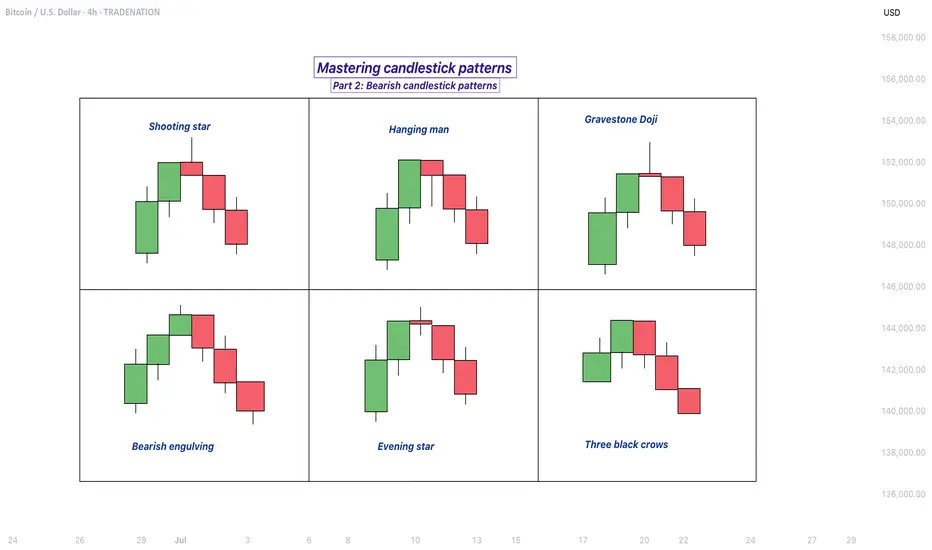
Mastering bearish candlestick patterns - How to use it!Bearish candlestick patterns are a cornerstone of technical analysis, relied upon by traders across financial markets to assess the likelihood of price reversals or continued downward trends. At their core, these patterns are visual representations of shifts in market sentiment, formed by the open, high, low, and close prices over one or several trading sessions. When recognized accurately and interpreted in context, bearish candlestick setups can alert market participants to the fading strength of buyers and the increasing presence of sellers, which often precedes downward price movements. Expanding on this, a comprehensive understanding of each pattern’s nuances, psychological underpinnings, and optimal trading applications can significantly enhance a trader’s analytical toolkit.
What will be discussed?
- What is a shooting star?
- What is a hanging man?
- What is a gravestone dojo?
- What is an evening star?
- What are the three black crows?
- How to trade the bearish candlestick patterns?
Shooting star
The shooting star pattern stands as a prominent candlestick configuration foreshadowing potential bearish reversals after an uptrend. This single-candle pattern is distinguished by a small real body situated near the lower end of the price range, a long upper shadow that is at least twice the length of the body, and little to no lower shadow. The psychological narrative implied by the shooting star is compelling: buyers initially control the session, pushing prices sharply higher, but by the close, sellers have overwhelmed this optimism, pulling the price back down to near or below the opening point. This abrupt shift in control suggests that the bullish momentum is waning, priming the market for a price correction or reversal.
Hanging man
The hanging man, while visually similar to the hammer pattern of bullish reversals, is distinctly bearish because of its position at the top of an established uptrend. This single-candle pattern features a small body at the upper part of the trading range and a markedly long lower shadow, again with minimal or absent upper shadow. During the session, substantial selling pressure drives prices down, accounting for the extended lower shadow, yet buyers temporarily regain some control, recovering much of the loss by the close. Despite this late-session recovery, the appearance of the hanging man warns traders that sellers are growing more aggressive – especially if the next candle confirms the weakness with a lower close.
Gravestone doji
A classic and somewhat ominous formation, the gravestone doji is a specialized form of doji candlestick that carries even greater weight when it appears after a rising market. Here, the open, close, and low are all clustered near the session’s low, forming a long upper shadow with no lower shadow. This structure vividly illustrates a dramatic shift in sentiment: buyers propel prices higher during the session, only to be met by intense selling which pushes prices back to the opening level by the close. This failed rally, marked by the upper wick, reflects the exhaustion of buying interest and the potential onset of bearish dominance.
Bearish engulfing
Turning to multi-candle setups, the bearish engulfing pattern is a powerful, two-bar reversal pattern. The initial candle is bullish and typically a continuation of the prevailing uptrend, but the second candle is bearish and must open above and close below the body of the first candle, “engulfing” it completely. The transition from a relatively small upward move to a much larger downward move highlights a rapid escalation in sell-side enthusiasm. Importantly, the larger the second candle and the greater the volume accompanying it, the more reliable the signal.
Evening star
The evening star expands the analysis further into a three-candlestick formation, representing a storyline of shifting market dynamics. The pattern commences with a long bullish candle, followed by an indecisive small candle (the star) that gaps above the previous close, and concludes with a large bearish candle that closes deep into the first candle’s body. The evening star is especially meaningful because it narrates a transition from bullish exhaustion to bearish control over three sessions, making it a robust signal of a pending trend reversal. The reliability of the evening star increases if the bearish candle is accompanied by high volume, confirming a surge in selling pressure.
Three black crows
Among the most striking bearish signals is the three black crows pattern. It comprises three consecutive large bearish candles, each opening within the body of the previous candle and closing successively lower. This pattern demonstrates relentless selling over several sessions, erasing prior gains and indicating that bearish sentiment is in full swing. Collectively, the three black crows can shift market psychology significantly when they appear after a lengthy uptrend, especially if accompanied by increased trading volume.
How to trade the bearish candlestick patterns?
Effectively using bearish candlestick patterns in a trading strategy requires more than mere recognition of shapes. The context in which these patterns emerge matters greatly; traders should analyze preceding price action, the scope of the trend, and any converging signals from other technical tools such as momentum oscillators or volume indicators. Confirmation is a best practice, waiting for a subsequent session that continues in the bearish direction can filter out false signals and decrease the chances of whipsaw trades.
In practice, traders may use these patterns to identify short-selling opportunities, define entry and exit points, or adjust stop-loss levels to protect profits as a trend appears to reverse. Risk management is crucial, as no pattern is infallible. Position sizing, stop-loss placement, and ongoing evaluation of the broader market environment all contribute to the prudent use of candlestick analysis. By integrating these patterns into a comprehensive market analysis framework, traders are better positioned to interpret crowd psychology, anticipate significant reversals, and navigate the complexities of price movement with a higher degree of confidence and skill.
-------------------------
Disclosure: I am part of Trade Nation's Influencer program and receive a monthly fee for using their TradingView charts in my analysis.
Thanks for your support. If you enjoyed this analysis, make sure to follow me so you don't miss the next one. And if you found it helpful, feel free to drop a like 👍 and leave a comment 💬, I’d love to hear your thoughts!
BTCUSD trade ideas
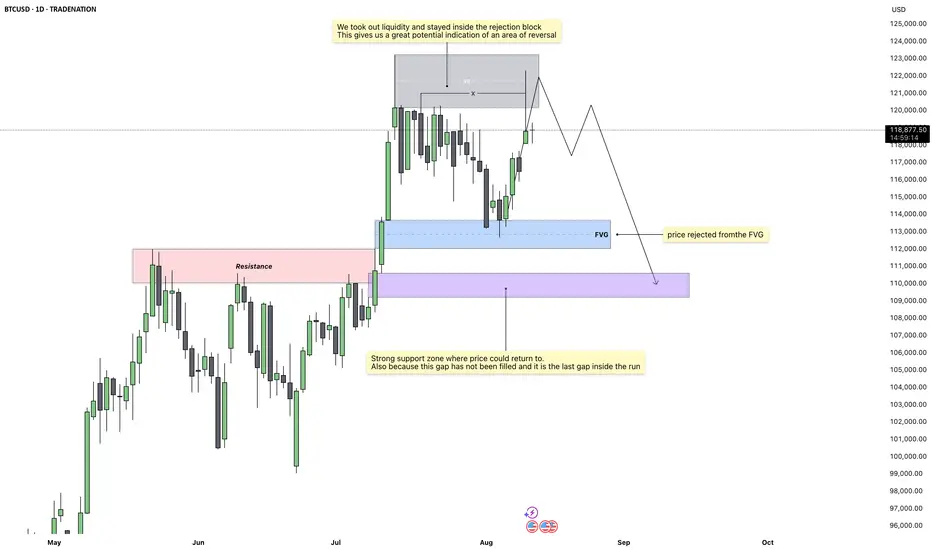
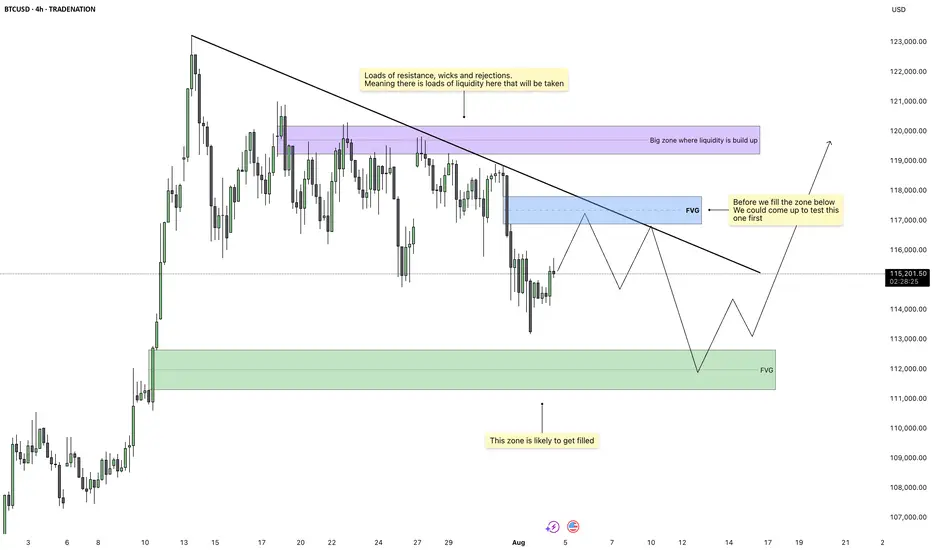
Bitcoin – The Last Stop Before the DropMarket Overview
Price action on the daily chart has shown a decisive move into a key rejection block after taking out recent liquidity. This is a classic sign of exhaustion in the current move, suggesting that momentum may now begin to shift in the opposite direction. The daily close reinforced this idea, showing a clear respect for higher-timeframe resistance levels.
Rejection Block Context
The 4H and daily rejection blocks have aligned, creating a strong confluence zone where sellers have stepped in before. Price did not just test this area, it closed within it, which often indicates a high probability of reversal. This setup builds confidence that the market could be preparing for a retracement.
Liquidity Sweep Confirmation
Before the rejection occurred, price ran through a cluster of resting liquidity above recent highs. This liquidity grab often acts as the fuel for a reversal, as it traps late buyers and allows larger players to shift price in the opposite direction.
Fair Value Gap Target
Below current price, there remains an unfilled gap which is the final gap inside the current run. Historical price behavior shows that such gaps tend to get filled before a fresh move can develop. This unfilled zone provides a clear downside target.
Bearish Scenario
If the rejection holds, I expect price to work its way lower toward the 110k range, filling that remaining gap before any sustained bullish move can resume.
Conclusion
With liquidity taken, a clean rejection from higher-timeframe resistance, and an untouched gap below, the chart is aligning for a potential retracement. I am watching for continued weakness to confirm the move toward the 110k region.
Disclosure: I am part of Trade Nation's Influencer program and receive a monthly fee for using their TradingView charts in my analysis.
___________________________________
Thanks for your support!
If you found this idea helpful or learned something new, drop a like 👍 and leave a comment, I’d love to hear your thoughts! 🚀
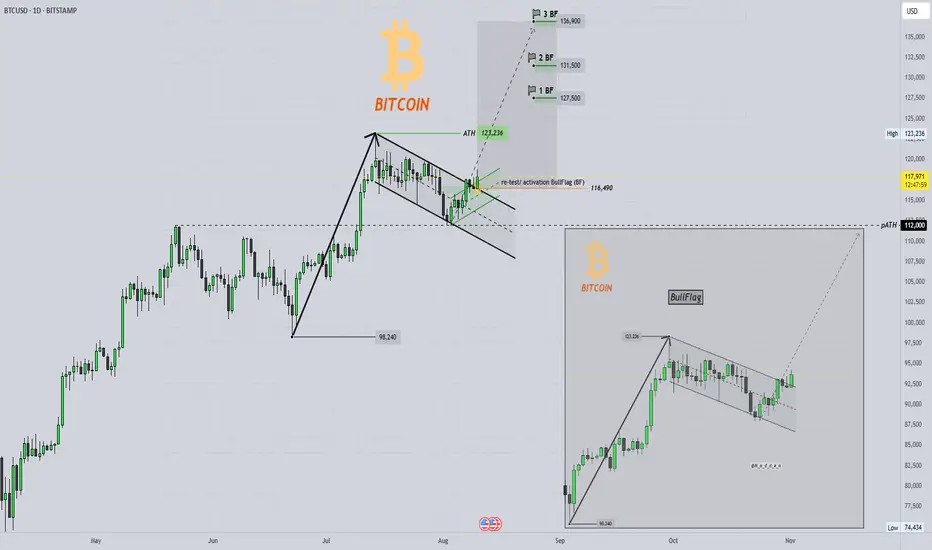
BITCOIN Bullflag and new all-time high ?!BULL FLAG and new all-time high 👀⏰
📇BTC daily-chart (BITSTAMP) and 💡everything important in the chart !
Bitcoin has broken out of its sideways consolidation and has recently successfully tested this channel (bull flag), thereby activating a potential bull flag.
The resulting targets (see example) are based on the low of approximately $98,240 and the sharp rise to the current all-time high of $123,236.
See the flags at the top with the corresponding price-targets 🏁 👀
💥Rising blue diagonal line for the previous support
💥From an indicator perspective, a possible bullish cross is imminent in the MACD-Indicator and bearish momentum may continue to decline ...
💥Finally, the bull flag (textbook) as an example of a chart pattern.
🔥Please also take a look at my last idea, as there are certain similarities based on this...
🎯 If you like this idea, please leave me a 🚀 and follow for updates 🔥⏰
Furthermore, any criticism is welcome as well as any suggestions etc. - You're also very welcome to share this idea.
I wish you a pleasant Sunday and a good start to the week & successful trading decisions 💪
M_a_d_d_e_n ✌
NOTE: The above information represents my idea and is not an investment/trading recommendation! Without any guarantee & exclusion of liability!
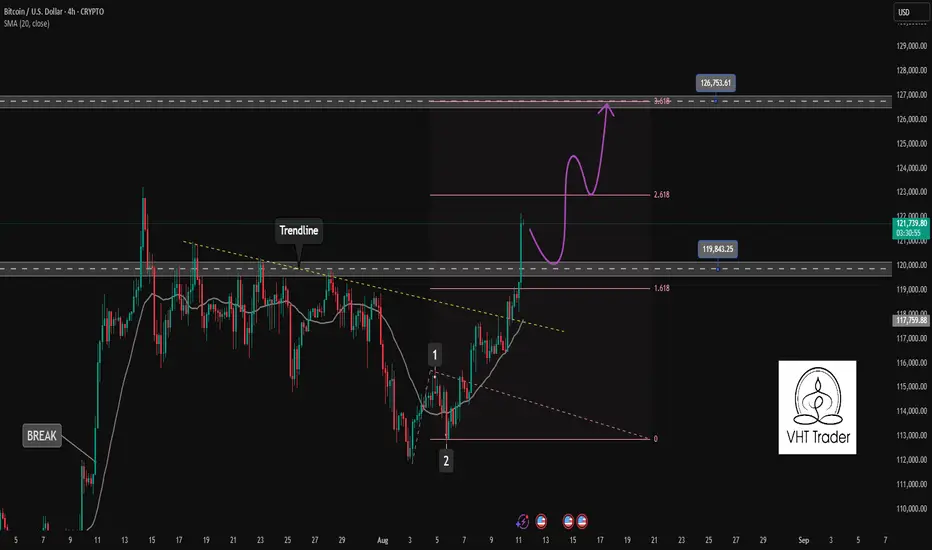
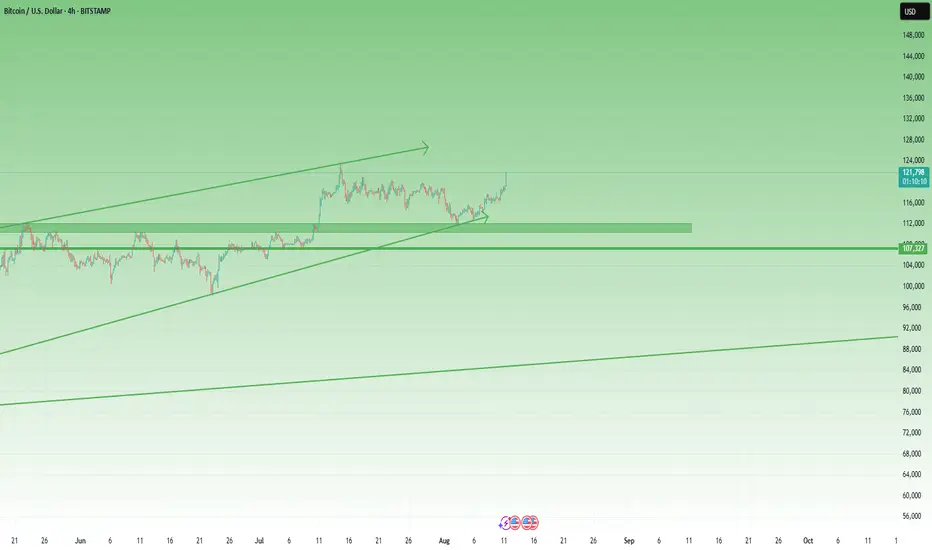
Bitcoin: 120K Break To Push 130Ks?Bitcoin has rallied off the buy signal that I wrote about over the previous week. In order to confirm follow through, price needs to CLOSE decisively above 120K this week. This means a solid candle close, NO pin bars. This needs to be followed by a new candle that breaks the previous candle high quickly, and NOT close weak. The blue rectangle on the chart represents a consolidation resistance where price is likely to test and potentially reject. The question that the market needs to answer is: can price push through this without any effort, OR does it get stuck and start to form bearish candles or reversals?
The wave count that I have been referring to in previous analysis is still intact. Subwave 4 never overlapped subwave 1 which means this move is most likely subwave 5. If you are maintaining a profit, it would be wise to trail your stop at least by two previous candle lows on this time frame. At this moment there is NO reason to sell since there is nothing but strength, BUT understand that it can change at a moments notice. It is within reason to wait and see IF price breaks out and if you are long from my price suggestion in my previous analysis, you have the luxury and flexibility to wait it out.
I regularly bring this up during my analysis streams, Wave 5's, ESPECIALLY 5th of 5th waves (which is what this is), imply that the market is highly vulnerable but this WILL not be obvious in any way. Wave 5's can be interpreted as the next wave to follow is LIKELY a corrective structure. This may take some weeks or longer to play out, but knowing that this is a Wave 5 should tell you that risk on the LONG side is ELEVATED. Increasing risk at these levels (same goes for the stock market) is unwise in my humble opinion. Price can run into the 130Ks or higher before it peaks there is NO way to know with any certainty (unless you are Michael Saylor).
Potential catalysts over the next few months can easily change things (NFP, CPI, FOMC meetings). What determines value, especially over the short term is the perception of the future and NOT reality. All it takes is a new "narrative" to proliferate.
Thank you for considering my analysis and perspective.

BITCOIN Bounced on its 1D MA50. Bull Flag breaking soon?Bitcoin (BTCUSD) made a beautiful technical rebound on its 1D MA50 (blue trend-line), testing and holding it on 3 separate 1D candles. This has caused a short-term rebound so far, taking the price to the top of the Channel Down.
As we mentioned on previous analysis, if BTC breaks above that Channel, it will be technically confirmed as a Bull Flag, similar to the May 20 - June 20 pattern. Interestingly enough, that one was confirmed by a 1D MACD Bullish Cross, a formation that the MACD is about to make again. However it is not conclusive as 1 out of the last 3 such sequences was false.
In any case, if the break-out does take place, we are ahead of potentially two targets. Short-term $140000, which would be a +25.45% Bullish Leg, such as the one that led to the current Flag and medium-term $148000, which is the 2.0 Fibonacci extension.
Which Target do you think we'll hit, if any? Feel free to let us know in the comments section below!
-------------------------------------------------------------------------------
** Please LIKE 👍, FOLLOW ✅, SHARE 🙌 and COMMENT ✍ if you enjoy this idea! Also share your ideas and charts in the comments section below! This is best way to keep it relevant, support us, keep the content here free and allow the idea to reach as many people as possible. **
-------------------------------------------------------------------------------
💸💸💸💸💸💸
👇 👇 👇 👇 👇 👇

Bitcoin - The magical $1.000.000 level!🚀Bitcoin ( CRYPTO:BTCUSD ) is not done yet:
🔎Analysis summary:
Over the course of the past couple of months, we have been witnessing a bullish continuation on Bitcoin. After the all time high breakout, there is a high chance that this bullrun will continue and Bitcoin might even retest the resistance trendline at seven digits in the near future.
📝Levels to watch:
$1.000.000
SwingTraderPhil
SwingTrading.Simplified. | Investing.Simplified. | #LONGTERMVISION

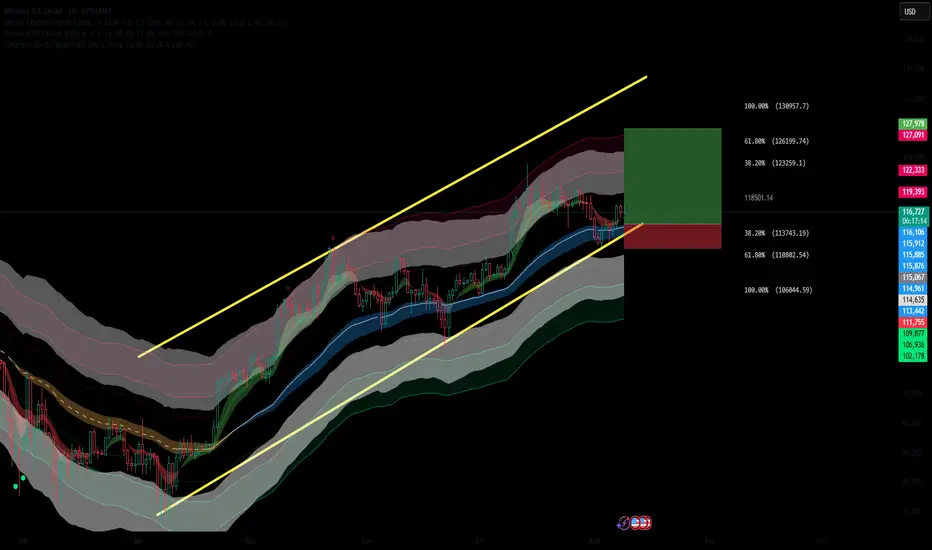
BTC Holding Strong: Fibonacci Levels Point to $130KBITSTAMP:BTCUSD is holding above a key dynamic support zone at the lower boundary of its ascending channel, with current price action signaling a potential continuation to the upside. This long setup is supported by multiple bullish confluences.
✅ Bullish Confluences:
Fibonacci Retracement Support: Price respected the 38.2%–61.8% Fib retracement zone between $113,769 and $110,828, confirming a strong demand area.
Trend Structure: Clear higher low formation on the daily chart, maintaining the bullish channel pattern.
EMA Cloud Support: Price remains above the multi-band EMA cloud, showing sustained bullish pressure and trend bias.
Channel Support: Bounce from the ascending channel’s lower trendline, keeping structure intact.
Bullish Candlestick Formation: Daily candle holding above key support with buying pressure evident.
Ideal entry would be between 113k and 114500.
🎯 Fibonacci-Based Targets:
TP1 – $123,285 (38.2%): Initial resistance and reaction zone.
TP2 – $126,225 (61.8%): Mid-extension target, aligns with prior swing high zone.
TP3 – $130,983 (100%): Full measured move to the channel top.
SL: Placed just below the 61.8% retracement (~$110,800), protecting against a breakdown of the bullish structure.
BITCOIN - IMPORTANT BREAKOUT !Hello Traders!
The Bitcoin failed to create a new lower low!
The price broke the resistance line!
So, I expect a bullish move🚀
____________
TARGET: 122700🎯

BTCUSD is running wave 3 of the Elliott wave pattern✏️BTCUSD forms a bullish wave after the end of the correction wave at the support zone around 112000. The bullish Dow 2 pattern is formed when there is confirmation of a candle above 115500. Currently, BTCUSD is running wave 3 of the Elliot wave theory and the absolute principle is not to trade against the trend of the main wave. Wait for the profit-taking wave of investors so that the BTC price can adjust to buy towards the Fibonacci zone 3.618.
📉 Key Levels
Buy Trigger: Retest and rejection at the support zone 120,000
Target 127000
Leave your comments on the idea. I am happy to read your views.
Bitcoin - Imbalance Fill Before Liquidity ExpansionBitcoin is trading inside a compressing structure beneath a clean descending trendline. Price action has been choppy but controlled, creating multiple zones of inefficiency that remain unfilled. We’re currently positioned between two major Fair Value Gaps, one above and one below, which gives us a clear roadmap. The broader market context suggests accumulation beneath key resistance, and the chart structure points toward a two-legged play before any breakout.
First Target: Upper Imbalance and Liquidity Trap
The first objective for price is to reach into the Fair Value Gap sitting just above current levels. This zone overlaps with the trendline and is backed by several wicks and failed breakouts, which likely means liquidity is built up there. Price may push through this area to trigger stop losses and induce breakout buying, only to reverse shortly after. The imbalance makes it an attractive magnet for price and a likely turning point once filled.
Retracement Move: Clean-Up Below
After sweeping the highs and filling the upper imbalance, price is expected to rotate back down. The area below holds an untouched Fair Value Gap from a previous bullish impulse, now acting as a demand zone. Once the upper inefficiency is filled, the market should drop into this zone to rebalance. This move will also help clear internal liquidity from the structure formed during the short-term rise.
Trendline, Inducement, and Execution Layers
The descending trendline plays a critical role here. With many traders watching it for a breakout or rejection, it acts as inducement. A false break or a touch just above the trendline may trigger entries in the wrong direction. The optimal move would be for price to react from the upper imbalance, reject at or just above the trendline, then fall into the lower zone, where we look for confirmation of reversal or continuation.
Final Expansion: Breakout After Cleanup
Once both Fair Value Gaps are filled and internal liquidity is cleared, Bitcoin will be in a clean position to rally. The area above the prior wicks and rejections is likely to hold significant liquidity, and the final move would aim to sweep that. This would complete the full cycle of imbalance fill, liquidity grab, and directional expansion. Price is unlikely to sustain a move higher until both zones have been addressed.
Conclusion
This setup focuses on efficient price delivery between key imbalances. Expect a short-term push up into the upper FVG and liquidity cluster, followed by a clean rejection into the lower demand zone. Once both sides are filled, Bitcoin should be ready for a real move higher, targeting liquidity above the current range. Let the market complete the cycle before looking for continuation.
Disclosure: I am part of Trade Nation's Influencer program and receive a monthly fee for using their TradingView charts in my analysis.
___________________________________
Thanks for your support!
If you found this idea helpful or learned something new, drop a like 👍 and leave a comment, I’d love to hear your thoughts! 🚀
BITCOIN Can $160k be the Top???Bitcoin (BTCUSD) closed last week on strong bullish fashion as it completed a formidable green 1W candle following a technical bounce on its 1D MA50 (red trend-line). This is a strong bullish signal as every time the (orange) Fibonacci Channel rebounded on its 1D MA50 after a 1W MA50 (blue trend-line) bounce, BTC extended the uptrend towards a new technical Higher High.
Based on the 1W LMACD, we could be roughly half-way (blue circle) through such a Bullish Leg. As you can see, those Bullish Legs have typically made rounded Tops (red Arcs), with the last two both breaking above the Fib Channel's 0.236 level. At the same time, on the horizontal Fib level, the sequence has applied significant importance to every .618 and .0 interval, with peaks on the 0.618, 1.0, 1.618, 2.0, 2.618. Now what's left realistically before the end of the Cycle at the end of the year are 3.0 and 3.618.
As a result, a rather modest potential Top projection is $160000, which is even conveniently placed just below the 0.236 Channel Fib from late October onwards.
Do you think that could be a potential Cycle Top candidate? Feel free to let us know in the comments section below!
-------------------------------------------------------------------------------
** Please LIKE 👍, FOLLOW ✅, SHARE 🙌 and COMMENT ✍ if you enjoy this idea! Also share your ideas and charts in the comments section below! This is best way to keep it relevant, support us, keep the content here free and allow the idea to reach as many people as possible. **
-------------------------------------------------------------------------------
💸💸💸💸💸💸
👇 👇 👇 👇 👇 👇

BTC 1d forecastBTC WILL GO DOWN from 11-20 of August till the end of Aug (25 +/-1day)
From there we are PUMPING till beg of Nov, from there DUMP till mid Dec and one last PUMP til mid JAN beg FEB!
Than - THE END!!!! FINISH! Sayanara

Bitcoin(BTC): History Never Lies | 3-5 Months Before Bear MarketBull Market - Bear Market - Accumulation - Expansion - Reaccumulation: this is the pattern we have been going with since 2012, where currently, after some help from Trump, in combination with the 2024 halving, we had really good upside momentum, which formed the new ATH and led us into the bull run that we have been looking for (by we I mean most traders).
Now, since the last time we shared this kind of analysis on the markets, we have successfully entered the bull market, where currently, based on previous bull runs, we still have around 90-150 days left of further upside movement, which would be a perfect opportunity for altcoins to have their momentum as well.
But bear in mind, each cycle is different, so we have to be ready for anything. What we see is that 2026 should be a bearish year, so be ready for that!
Swallow Academy

BTC BOUNCED 1D MA50 BTC DAILY
3 candles 🔒 holding tight, price ready to explode from top of Channel Down! Break this channel = Bull Flag confirmed, just like May-June!
MACD bullish cross loading… but 1/3 can be traps — stay sharp! ⚠️
🎯 Targets:
• $140K short-term 🚀
• $148K medium-term 🚀🚀
This move is LOADED — don’t blink!
Subscribe ✍️, share 🙌 & join the hype wave NOW!

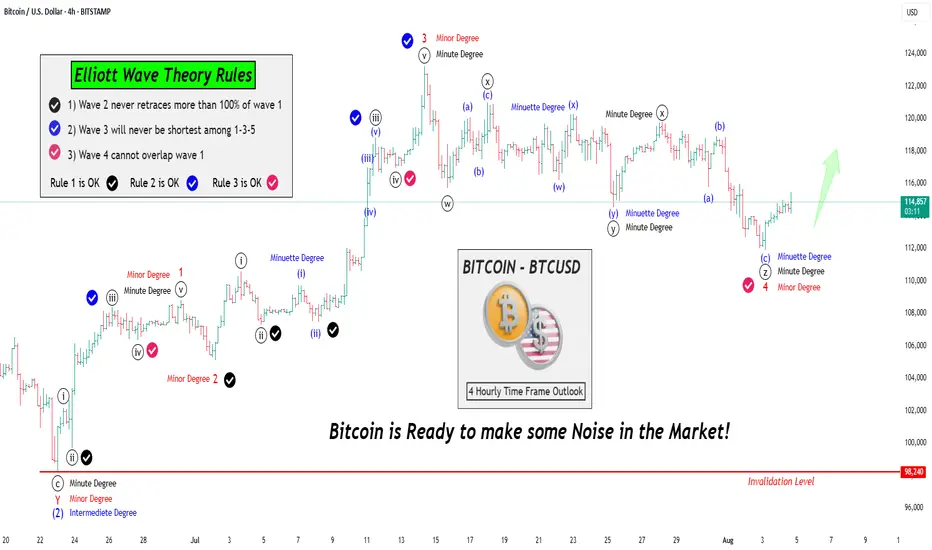
Let's learn & Apply Elliott Wave Rules on chart: BTCUSD BitcoinHello Friends,
Welcome to RK_Chaarts,
Friends, Today we are going to learn 3 Rules of the Elliott Wave theory, there are three principles and some patterns. Impulses move in a 1-2-3-4-5 pattern, either as an impulse or a motive wave. However, within impulses, there are three rules:
Rule No 1:
Wave 2 will never retrace more than 100% of Wave 1.
Rule No 2:
Wave 3 will never be the shortest among Waves 1, 3, and 5; it can be the largest, but never the smallest.
Rule No 3:
Wave 4 cannot overlap Wave 1, except in diagonals or triangles; in impulses, it cannot overlap.
We've checked these three rules and marked them with separate tick marks on the chart with different colors, making them clearly visible. You can review the chart and verify these rules yourself, learning how wave principles are applied and checked.
We've explained all this through a drawing on the chart, so we won't elaborate further here. Moving forward, let's analyze what the wave theory suggests about the current market trend. This entire analysis is shared for Educational purposes only.
I hope you'll consider this educational post as a learning resource, Definitely, I encourage you to review the chart as an image or picture to better understand the concepts we've worked hard to explain.
Our effort will be successful if you gain a deeper understanding and learn something new from this post. If you find this helpful and informative, our hard work will have paid off. Please keep this in mind as you review the material.
Now let's explore how wave counts within wave counts, or lower degrees within higher degrees, unfold through complete wave theory patterns and following theory Rules all the times.
Let's take a closer look at the Bitcoin chart we've analyzed using Elliott Waves. From this perspective, it's clear that the Intermediate Degree Wave (2) concluded around June 23rd.
After this, we observe that the internal wave counts of the lower degree, specifically Wave 1-2-3 (in red) have completed their cycle of Minor degree. Furthermore, Red Wave 4 of same Minor degree has been moving sideways, characterized by a downward trend.
Notably, the fall of Red Wave 4 is classified as a Minor Degree movement. Interestingly, this downward movement appears to have terminated in an even lower degree, namely the Minute Degree, which we've marked in black as ((w))-((x))-((y))-((xx))-((z)) that means Wave 4 of Minor degree (in Red) is complete.
Given that Red Wave 4 Minor has reached its conclusion, it's highly plausible that Wave 5 has initiated. This development suggests that Bitcoin is poised to make a significant move.
Moving on to the analysis, we observe that:
- Rule 1: Wave 2 has not retraced more than 100% of Wave 1, so this rule is intact.
- Rule 2: Wave 3 is not the shortest among Waves 1, 3, and 5, so this rule is also valid.
- Rule 3: Wave 4 does not overlap Wave 1, so this rule is also satisfied.
Bitcoin is all set to shake things up! We eagerly anticipate further rallies in the market.
This post is shared purely for educational purpose & it’s Not a trading advice.
I am not Sebi registered analyst.
My studies are for educational purpose only.
Please Consult your financial advisor before trading or investing.
I am not responsible for any kinds of your profits and your losses.
Most investors treat trading as a hobby because they have a full-time job doing something else.
However, If you treat trading like a business, it will pay you like a business.
If you treat like a hobby, hobbies don't pay, they cost you...!
Hope this post is helpful to community
Thanks
RK💕
Disclaimer and Risk Warning.
The analysis and discussion provided on in.tradingview.com is intended for educational purposes only and should not be relied upon for trading decisions. RK_Chaarts is not an investment adviser and the information provided here should not be taken as professional investment advice. Before buying or selling any investments, securities, or precious metals, it is recommended that you conduct your own due diligence. RK_Chaarts does not share in your profits and will not take responsibility for any losses you may incur. So Please Consult your financial advisor before trading or investing.
BTC Bulls Back in Control – 130K in SightIn my previous BTC analysis, I highlighted that the price was sitting right in a confluence support zone, with strong odds for a bullish reversal.
That scenario played out well — bulls regained control. After a retest of the low pruces in the middle of last week and a modest initial bounce, momentum accelerated today, pushing BTC close to its previous all-time high at the time of writing.
Looking ahead, I don’t expect the old ATH to be a major obstacle for buyers. A clean break above should open the path toward 130K+ as the next logical upside target.
For now, as long as BTC trades above 114K, bulls have no reason for concern.
BTCUSD SHOW WEEKNESS & BEARS ARE GETTING READY TO TAKE OVER As explain on the chart, im looking to see if we BREAK SUPPORT mention on the chart
Once we take that SUPPORT i will go for SELL
Will update as soon i go in
Good weekend everyone :)

Bitcoin, Ethereum Breakout: 401(k) funds & the next "Altseason"Bitcoin is up 10% in August, driven by strong ETF inflows and a game-changing executive order allowing 401(k) retirement funds to invest in cryptocurrencies, potentially bringing trillions of dollars into the sector.
Technically, Bitcoin and Ethereum are breaking out toward multi-year highs, with BTC leading and ETH close behind—setting the stage for a possible "altseason" if these levels hold and capital rotates into altcoins.
This content is not directed to residents of the EU or UK. Any opinions, news, research, analyses, prices or other information contained on this website is provided as general market commentary and does not constitute investment advice. ThinkMarkets will not accept liability for any loss or damage including, without limitation, to any loss of profit which may arise directly or indirectly from use of or reliance on such information.

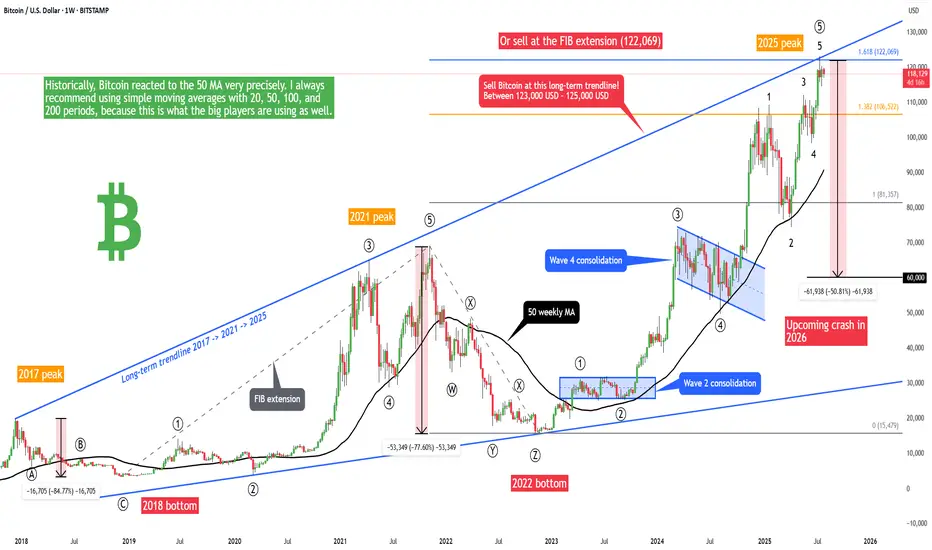
Bitcoin - 50% crash is starting! (2017 trendline, huge warning)Bitcoin is in the final stage of the bullish cycle, and we want to look for the best price to sell and prepare for the 2025/2026 bear market! The best price to sell Bitcoin is at the 1.618 FIB extension or at the main long-term 2017-2021-2025 trendline. This is exactly at 122,069, as we can see on the chart. And 2 weeks ago, Bitcoin hit both the Fibonacci level and trendline! So this is a strong sell signal.
Buying Bitcoin at the tipity top of a bullish cycle is not the best idea, because we will see 60,000 USD per Bitcoin in 2026! From the Elliott Wave perspective, there is probably only 1 high-probability scenario, and it's this ending diagonal pattern (rising wedge). I think we will see a final 2 waves on Bitcoin to form an ending diagonal wedge pattern (1-2-3-4-5). Bitcoin just finished wave 5 and is starting a brand new corrective pattern.
But you can be more conservative and wait for more confirmations, such as a break of the 50-week moving average. Waiting for such confirmations in general gives us a higher chance of success but a lower risk-to-reward ratio; in other words, you can't catch the top. I always recommend using simple moving averages with 20, 50, 100, and 200 periods because this is what the big players are using as well. These MAs are very popular among giant institutions, banks, and investors.
What's more, Bitcoin seasonality is telling us that August and September are the most bearish months for Bitcoin statistically. So you probably want to sell before a sell-off kicks in.
Write a comment with your altcoin + hit the like button, and I will make an analysis for you in response. Trading is not hard if you have a good coach! This is not a trade setup, as there is no stop-loss or profit target. I share my trades privately. Thank you, and I wish you successful trades!
BTCUSD-BOUNCED 1D MA503 candles 🔒 holding tight, price ready to explode from top of Channel Down! Break this channel = Bull Flag confirmed, just like May-June!
MACD bullish cross loading… but 1/3 can be traps — stay sharp! ⚠️
🎯 Targets:
• $140K short-term 🚀
• $148K medium-term 🚀🚀
This move is LOADED — don’t blink!

Charting Synesthesia🏛️ Research Notes
There are known phenomena in physics that continues to remind me about markets, which partially influenced my perception of price action and reflected in topology.
In space, speed itself doesn’t cause discomforts — only acceleration does. In markets, trend direction isn’t what stresses traders, it’s the rate of change (volatility spikes, momentum surges). A slow, constant uptrend can feel comfortable, but sudden thrusts (news shocks, liquidity squeezes) presses them against the seat.
No matter how hard you accelerate, you can’t exceed light speed. Markets also have practical velocity limits such as liquidity constraints, margin requirements, volatility halts which contribute to proportions in movements). Beyond certain speeds, moves become self-limiting because liquidity providers back away or exchanges impose breakers.
Aberration of Light → Focus Shift in Market Attention
As you accelerate, stars seem to shift forward in view. In markets, as momentum builds, your perception of what matters narrows. What I mean is liquidity, news, and setups ahead dominate, while the “sky behind” (past fundamentals or long-term signals) fades. The market narrative contracts into a single front-facing beam: what’s next, not what’s past.
Doppler Effect → Price Action Distorts Information
Moving away from Earth, you see time slow down behind you; moving toward something, time speeds up. In markets, when price runs away from fundamentals, old data feels stale and irrelevant (red-shifted). In fast rallies or panics, information feels accelerated and urgent (blue-shifted) — traders act as if the clock is ticking faster. (Has nothing to do with the color gradient I use on chart.)
Terrell–Penrose Rotation → Illusion
At high speed, objects don’t look contracted, they look rotated due to delayed light arrival. In markets, patterns rarely appear exactly as the textbook shows because we’re always looking at “delayed” sentiment. What looks like a simple breakout might just be a rotated perspective of deeper structure.
Time Dilation → Compression of Trading Horizon
Travelers age slower, as from their view, a distant journey seems shorter. In markets, when immersed in high-frequency movement, traders experience time compression (dozens of opportunities in minutes). From outside (a swing trader’s view), that same period looks like a small blip in a larger trend.
Length Contraction → Path Shortening During High Momentum
Near light speed, distances shrink in the direction of travel. In markets, when momentum is extreme, the “distance” to a target level (Fibonacci, prior high) feels shorter, so price reaches it much faster than normal expectation.

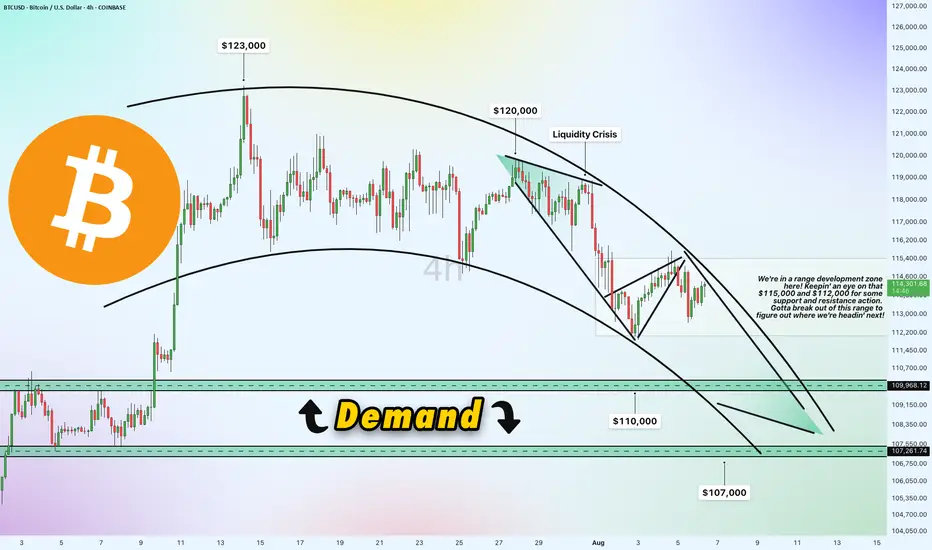
Bitcoin 4h Chart Update [Tight Range / Breakout Opportunities]Breakout Opportunities
We're in a range development zone here! The chart shows Bitcoin (BTC/USD) trading within a tight range, with key levels at $115,000 and $112,000 acting as critical support and resistance zones. The price recently peaked near $123,000 but has since pulled back, forming a liquidity crisis zone around $120,000 where selling pressure kicked in. A breakout above $115,000 could signal a move toward $120,000 or higher, while a drop below $112,000 might push it toward the demand zone. Gotta break out of this range to figure out where we're headin' next!
Demand Zone
$110,000 & $107,000
Price slipped down from $120,000 due to a lack of buying liquidity, potentially it will land into a demand zone between $110,000 and $107,000. This area could act as a strong support level where buyers might step in. If the price holds here, it could bounce back toward the $112,000-$115,000 range. However, a failure to hold this zone might see it test lower support around $107,000 or even $105,000.
Direction and Possible Ranges
Upward Potential: If Bitcoin breaks above $115,000 with strong volume, the next targets could be $120,000 (liquidity crisis zone) and potentially $123,000, aligning with recent highs. A sustained move above $120,000 might open the door to $125,000 or beyond.
Downward Risk: Should the price fail to hold above $112,000 and break below, it could slide into the demand zone ($110,000-$107,000). Further weakness might push it toward $105,000, a psychological and technical support level.
Current Trend: The chart shows a descending trendline from the $123,000 peak, suggesting bearish pressure unless a decisive breakout occurs. The 4-hour timeframe indicates indecision, with the range-bound action hinting at a potential volatile move once direction is confirmed.
Keep an eye on these levels for the next big move!
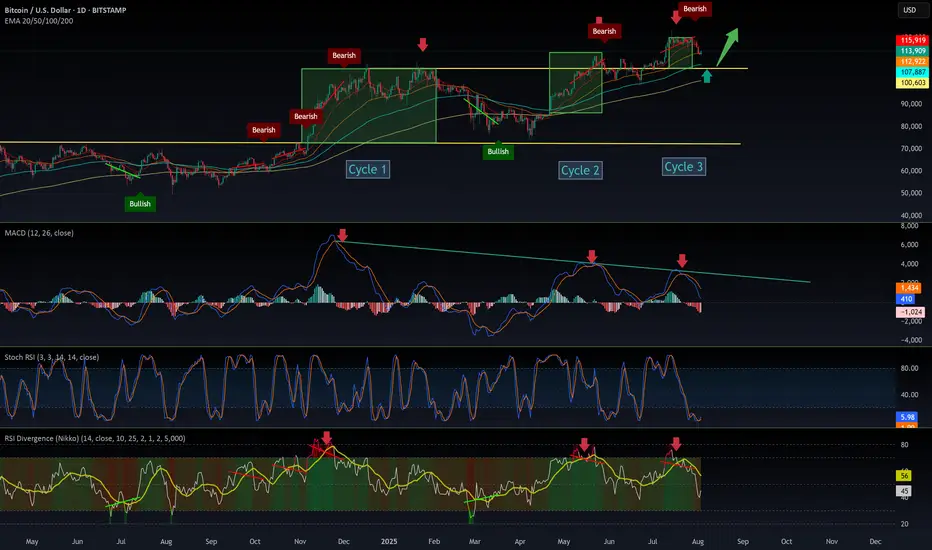
$BTC New Cycle: It’s Hard Not to Notice the ShiftSince December 2024, CRYPTOCAP:BTC has been closely following the SPX500, forming three similar cycles—each decreasing in intensity and shorter in duration.
The similarities are striking, especially when analyzing the MACD and RSI.
Each cycle ends with a bearish divergence.
Each cycle sees a rebound or bottom during consolidation, often touching the top of the previous cycle.
Most importantly, the cycles are accelerating.
However, it’s difficult to draw a definitive conclusion. These patterns are new in Bitcoin’s history, and there's no past reference for such institutional-driven behavior.
I believe the entry of institutions is reshaping Bitcoin’s rhythm. Their strategy is accumulation, not speculation, which brings more stability but also alters traditional crypto cycles.
What do you think will be the consequences of this shift?
Drop your thoughts in the comments👇