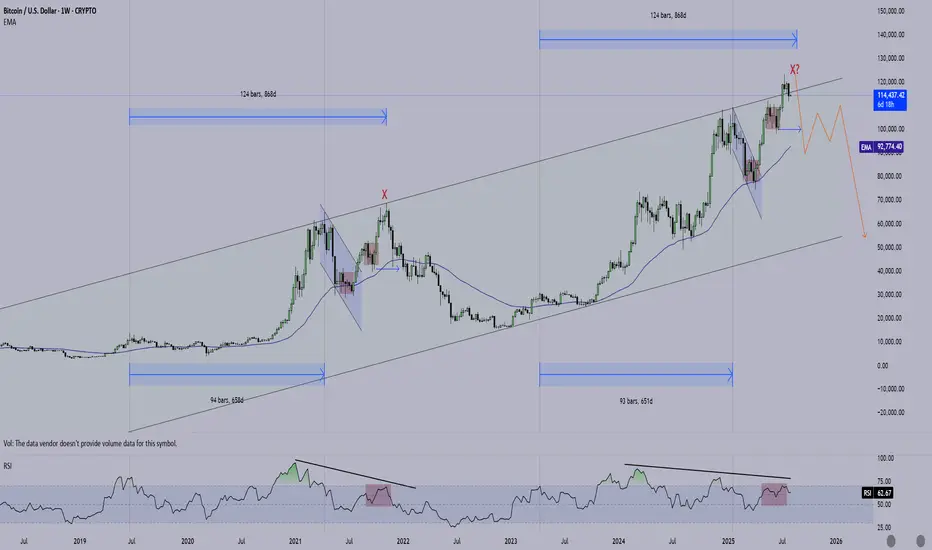
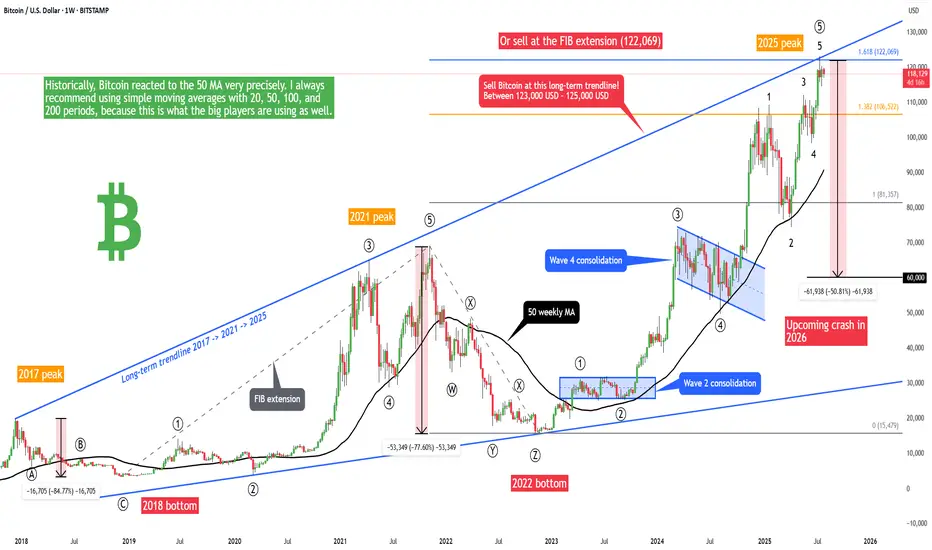
Bitcoin - 50% crash is starting! (2017 trendline, huge warning)Bitcoin is in the final stage of the bullish cycle, and we want to look for the best price to sell and prepare for the 2025/2026 bear market! The best price to sell Bitcoin is at the 1.618 FIB extension or at the main long-term 2017-2021-2025 trendline. This is exactly at 122,069, as we can see on the chart. And 2 weeks ago, Bitcoin hit both the Fibonacci level and trendline! So this is a strong sell signal.
Buying Bitcoin at the tipity top of a bullish cycle is not the best idea, because we will see 60,000 USD per Bitcoin in 2026! From the Elliott Wave perspective, there is probably only 1 high-probability scenario, and it's this ending diagonal pattern (rising wedge). I think we will see a final 2 waves on Bitcoin to form an ending diagonal wedge pattern (1-2-3-4-5). Bitcoin just finished wave 5 and is starting a brand new corrective pattern.
But you can be more conservative and wait for more confirmations, such as a break of the 50-week moving average. Waiting for such confirmations in general gives us a higher chance of success but a lower risk-to-reward ratio; in other words, you can't catch the top. I always recommend using simple moving averages with 20, 50, 100, and 200 periods because this is what the big players are using as well. These MAs are very popular among giant institutions, banks, and investors.
What's more, Bitcoin seasonality is telling us that August and September are the most bearish months for Bitcoin statistically. So you probably want to sell before a sell-off kicks in.
Write a comment with your altcoin + hit the like button, and I will make an analysis for you in response. Trading is not hard if you have a good coach! This is not a trade setup, as there is no stop-loss or profit target. I share my trades privately. Thank you, and I wish you successful trades!
BTCUSD trade ideas
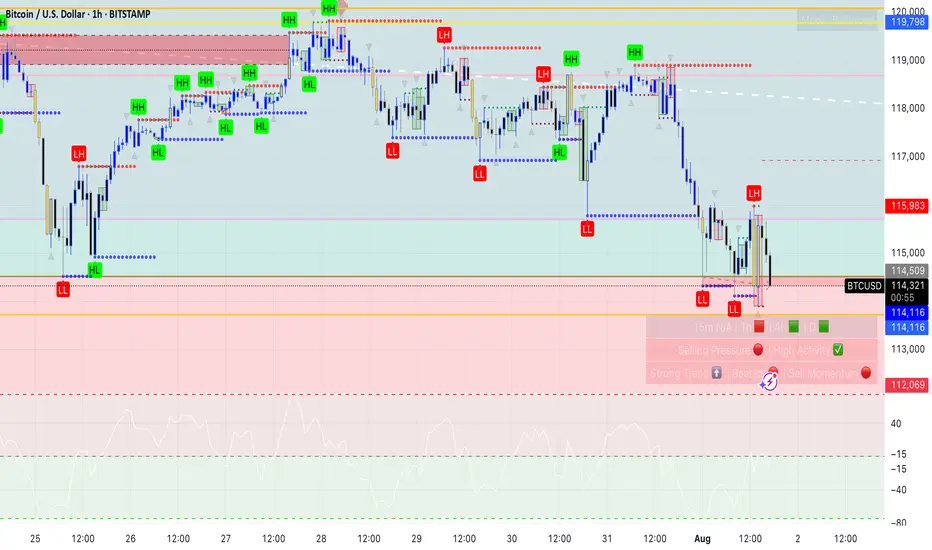
Bitcoin: 113K Support Bounce Buy Signal.Bitcoin has retraced thanks mostly to "unexpected" revisions to labor market statistics. While this move has many making outrageous forecasts, price has simply retraced to the 113K support levels and has generated a swing trade long signal (break of 114K). IF the momentum stays intact, it is within reason to anticipate a test of the low 120K's while a more aggressive expectations would be a break out into the 130K's. Keep in mind if 123K is broken, even by a small amount, that would confirm the current movement as the wave 5 of 5 which means it becomes the most vulnerable to a broader correction.
This NFP report and BLS situation is the perfect example of a catalyst that NO ONE in the financial "expert" space saw coming. Even Chairman Powell on Wednesday was pointing out how stable employment growth has been and emphasized the importance of this statistic for their rate decisions. Which means the Federal Reserve is making decisions based on totally inaccurate data. Which also means the entire market has been priced completely wrong for months. My point is, "official" information that you may be basing your investments on can be totally inaccurate and can be revealed out of nowhere. This risk alone puts every investor at the mercy of the market and why it is so important to recognize the limitations of ANY market information through the lens of RISK management.
I have been writing about a potential bullish range breakout beyond 120K for a test of the 130s OR if the range support breaks instead, to watch for a test of the key support at 113K. There is NO way to know which way the market will choose in advance, it all depends on the outcomes of specific events which act as catalysts for one scenario or the other.
This is why being knowledgeable about wave counts and other forecasting techniques can be very helpful in terms of gauging risk and potential. And based on this, AS LONG AS the 108K area is NOT overlapped, the current price structure is still within the boundaries of a bullish sub wave 4. This is why I am still short term bullish on Bitcoin and why I believe the current buy signal has potential to test at least the low 120's in the coming weeks. IF the 108K area is broken instead, that reduce the chances of a short term bullish break out, and may be the proof that the broader Wave 5 structure is complete.
The risk at this point can be measure from the 112K low area and nearest profit objective 118K which offers an attractive reward/risk. Measure everything from RISK first, and always be prepared to be wrong. If the market pays, consider it a gift.
Thank you for considering my analysis and perspective.

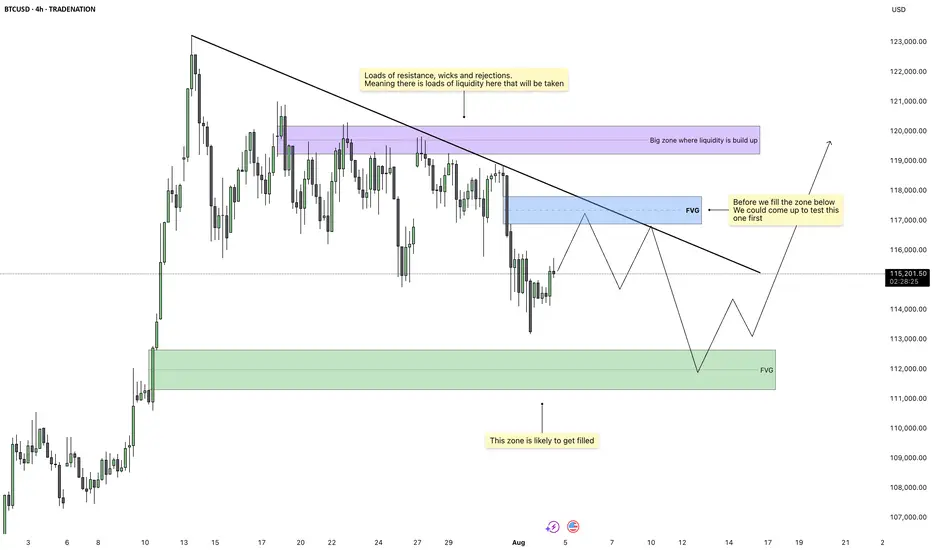
Bitcoin - Imbalance Fill Before Liquidity ExpansionBitcoin is trading inside a compressing structure beneath a clean descending trendline. Price action has been choppy but controlled, creating multiple zones of inefficiency that remain unfilled. We’re currently positioned between two major Fair Value Gaps, one above and one below, which gives us a clear roadmap. The broader market context suggests accumulation beneath key resistance, and the chart structure points toward a two-legged play before any breakout.
First Target: Upper Imbalance and Liquidity Trap
The first objective for price is to reach into the Fair Value Gap sitting just above current levels. This zone overlaps with the trendline and is backed by several wicks and failed breakouts, which likely means liquidity is built up there. Price may push through this area to trigger stop losses and induce breakout buying, only to reverse shortly after. The imbalance makes it an attractive magnet for price and a likely turning point once filled.
Retracement Move: Clean-Up Below
After sweeping the highs and filling the upper imbalance, price is expected to rotate back down. The area below holds an untouched Fair Value Gap from a previous bullish impulse, now acting as a demand zone. Once the upper inefficiency is filled, the market should drop into this zone to rebalance. This move will also help clear internal liquidity from the structure formed during the short-term rise.
Trendline, Inducement, and Execution Layers
The descending trendline plays a critical role here. With many traders watching it for a breakout or rejection, it acts as inducement. A false break or a touch just above the trendline may trigger entries in the wrong direction. The optimal move would be for price to react from the upper imbalance, reject at or just above the trendline, then fall into the lower zone, where we look for confirmation of reversal or continuation.
Final Expansion: Breakout After Cleanup
Once both Fair Value Gaps are filled and internal liquidity is cleared, Bitcoin will be in a clean position to rally. The area above the prior wicks and rejections is likely to hold significant liquidity, and the final move would aim to sweep that. This would complete the full cycle of imbalance fill, liquidity grab, and directional expansion. Price is unlikely to sustain a move higher until both zones have been addressed.
Conclusion
This setup focuses on efficient price delivery between key imbalances. Expect a short-term push up into the upper FVG and liquidity cluster, followed by a clean rejection into the lower demand zone. Once both sides are filled, Bitcoin should be ready for a real move higher, targeting liquidity above the current range. Let the market complete the cycle before looking for continuation.
Disclosure: I am part of Trade Nation's Influencer program and receive a monthly fee for using their TradingView charts in my analysis.
___________________________________
Thanks for your support!
If you found this idea helpful or learned something new, drop a like 👍 and leave a comment, I’d love to hear your thoughts! 🚀
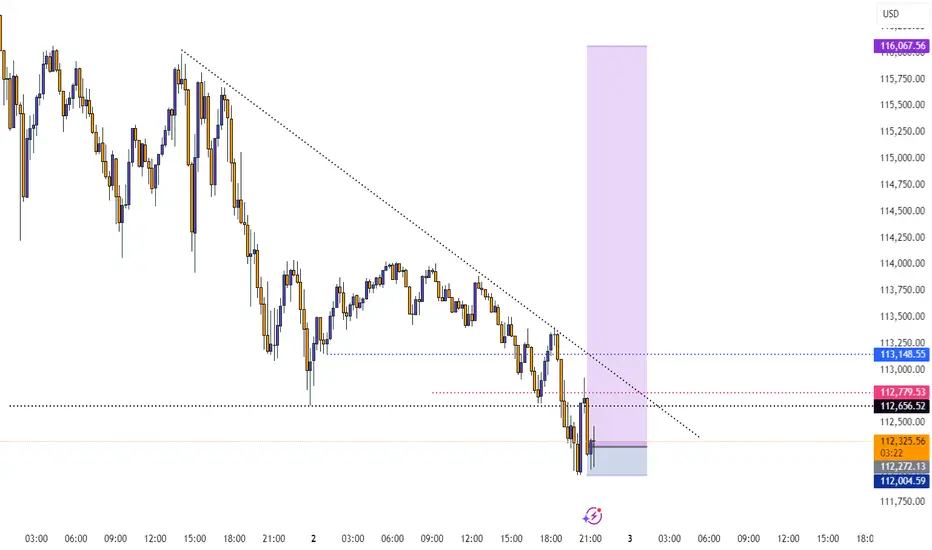
BTCUSD – Is the Correction Over? Key Support Holding so FarLast week was a red one for Bitcoin, with price declining day after day, and losses accelerating into Thursday and Friday.
However, yesterday’s low around 112K landed perfectly at a strong confluence support: a key horizontal level aligned with the ascending trendline from April.
Despite the drop, the broader structure remains firmly bullish. So far, this move looks like a normal correction within an uptrend — nothing more.
Looking ahead, I expect a reversal from this support. If bulls can reclaim the 117.5K–118K zone, the path toward a new all-time high opens up again.
🔍 Bias: Bullish
🎯 I consider this current level a good swing trade opportunity, with at least a 1:2 risk–reward potential.

BITCOIN- Charging Towards 122k Momentum Building BTC/USD Long Setup – Targeting 122K 🔥
Bitcoin is holding strong above 118500, signaling bullish momentum.
✅ Price broke key resistance & forming higher lows.
🟢 Current structure favors buy-side continuation with next major target at 122000.
Support Zones:
🔹 117800 – intraday bullish retest
🔹 116500 – strong demand zone
Resistance Ahead:
🔸 120200 – short-term reaction
🔸 122000 – major target
🚀 Expecting bullish wave continuation.
If momentum sustains above 118K, 122K breakout highly probable!
#BTC #Bitcoin #CryptoSetup #BTCUSD #CryptoTrading #BTC122K #ChartAnalysis #BullishBreakout
Adding to our first bitcoin sell position now We are adding to our first sell position on bitcoin because we are to see more sell off from here

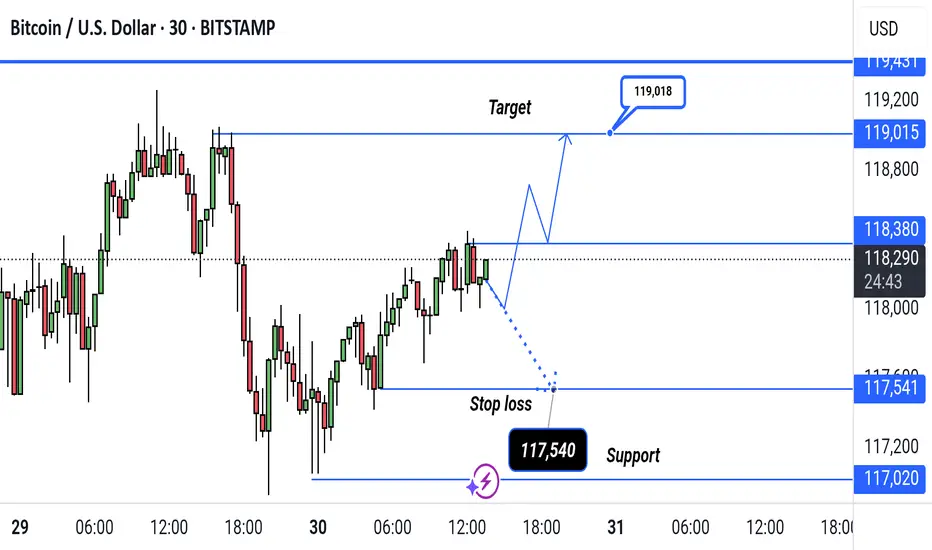
BTC/USD Bullish Breakout Setup – Targeting 119,018BTC/USD 30-Min Chart Setup:
Price is currently at 118,271, approaching resistance at 118,380. A bullish breakout could target 119,018, while a drop below 117,540 (stop loss) may signal downside toward support at 117,020.
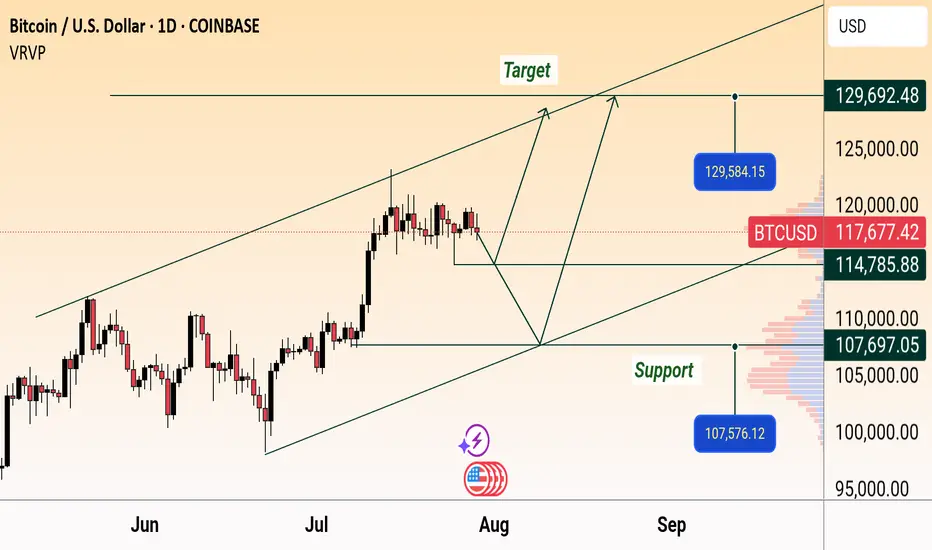
BTC/USD Daily Outlook: Support & Target Levels IdentifiedBitcoin (BTC/USD) Daily Chart Analysis:
Price is currently at $117,758.70, showing a slight decline. Key support levels are marked at $114,785.88 and $107,576.12, while targets are projected near $129,584.15 and $129,692.48. Chart suggests a possible upward channel, with both bullish and bearish scenarios mapped.
BITCOIN Will Go Lower! Sell!
Please, check our technical outlook for BITCOIN.
Time Frame: 9h
Current Trend: Bearish
Sentiment: Overbought (based on 7-period RSI)
Forecast: Bearish
The market is trading around a solid horizontal structure 113,260.21.
The above observations make me that the market will inevitably achieve 107,826.27 level.
P.S
We determine oversold/overbought condition with RSI indicator.
When it drops below 30 - the market is considered to be oversold.
When it bounces above 70 - the market is considered to be overbought.
Disclosure: I am part of Trade Nation's Influencer program and receive a monthly fee for using their TradingView charts in my analysis.
Like and subscribe and comment my ideas if you enjoy them!

BTCUSD Short Setup – 4H Bitcoin has broken below a key dynamic support zone, and current price action signals a potential continuation to the downside. This short entry is supported by multiple technical confluences:
🔻 Bearish Confluences:
Fibonacci Retracement Rejection: Price rejected the 61.8% Fib retracement zone near $114,978, confirming a potential local top.
Trend Structure: Clear lower high, lower low structure forming on 4H – momentum favors sellers.
EMA Cloud Pressure: Price is decisively below the multi-band EMA cloud, showing sustained bearish pressure and trend bias.
Volume Profile Gap: Price is entering a low-volume node between $113.8k and $112k, increasing likelihood of a sharp move down.
Bearish Candlestick Pattern: A strong bearish engulfing candle formed after the retracement – a classic reversal confirmation.
🎯 Fibonacci-Based Targets:
TP1 – $11205 (38.2%): Initial demand zone and minor support.
TP2 – $11024 (61.8%): Mid-extension level, aligns with prior consolidation.
TP3 – $10731 (100%): Full measured move target if the downtrend accelerates.
SL: Placed just above the recent swing high at $11678, protecting against false breakouts.
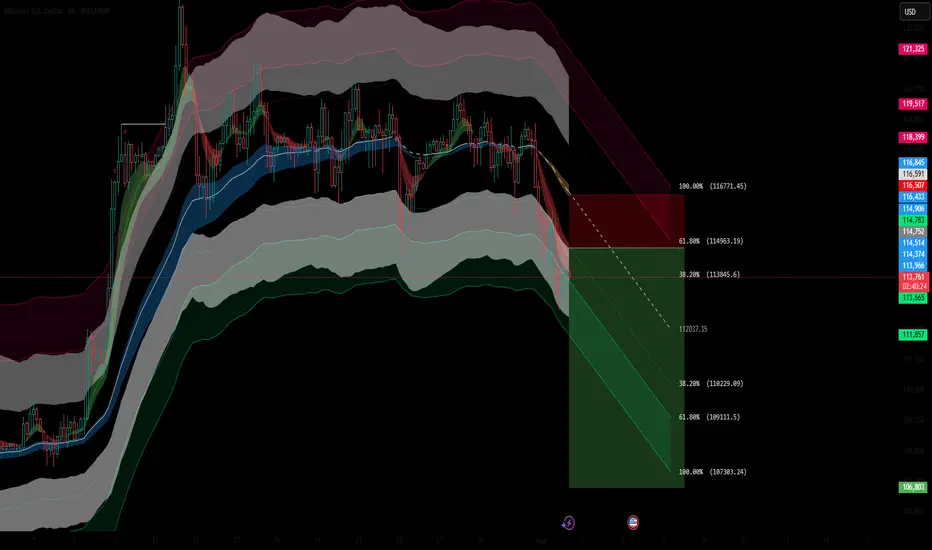
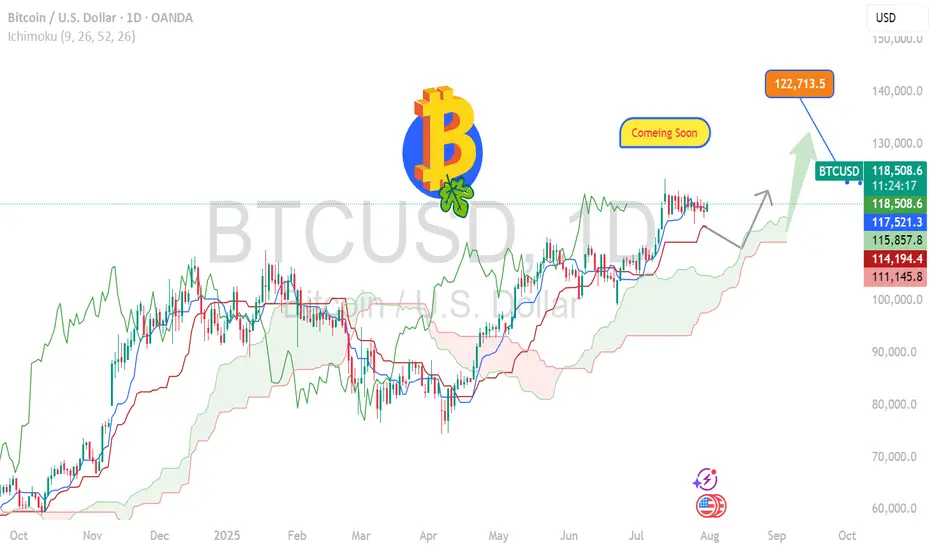
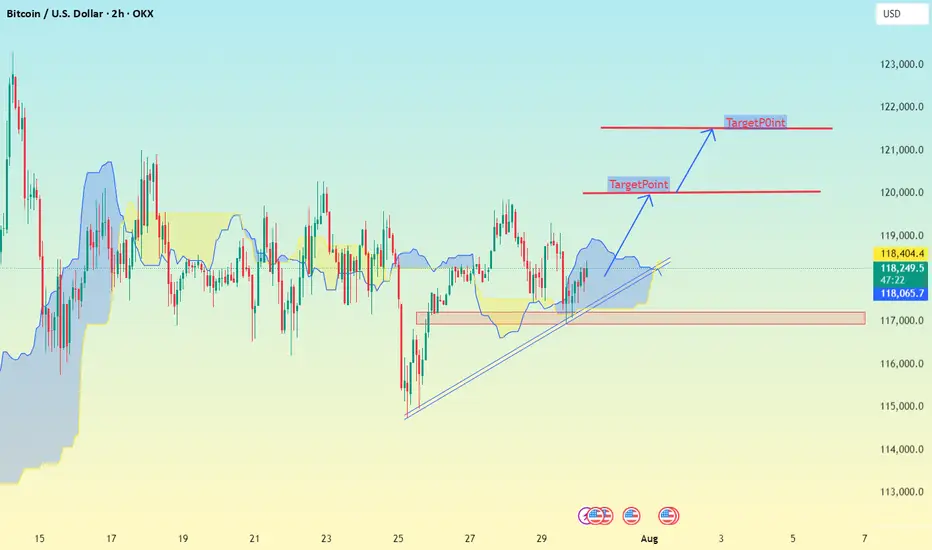
Chart Analysis (2h Timeframe)✅ Chart Analysis (2h Timeframe)
MY using Ichimoku Cloud, support/resistance zones, and trend lines.
Price is currently around 118,319 USD.
It has broken out of the Ichimoku cloud and is respecting the trendline support, indicating bullish momentum.
---
🎯 Upside Target Levels
🔵 Target 1:
Level: ~120,000 USD
Reason: Horizontal resistance (clearly marked)
Action: Minor profit-taking or partial exit
🔵 Target 2 (Main):
Level: ~122,000 USD
Reason: Second resistance zone & projected move from breakout
Action: Ideal full target zone
---
🔻 Support & Invalidations
🟡 Immediate Support Zone:
Levels:
118,404
118,296
118,065
These are dynamic Ichimoku & short-term support levels
Bitcoin longBitcoin retracement at 113.000 - 114.000 range, testing the support, 1H timeframe.
Liquidating positions on the level. Then long after testing the support.
BTCUSD PRICE MIGHT FALL!Price has a high tendency to drop from the current price of 113k as trend breaks. I anticipate a sell opportunity from this market. My target profit level is 107k

Do you think I'm joking ???As I said, Bitcoin broke the triangle, and now with a slight price correction(109k), it could surge to $150k , and you still think I'm joking!!
Previous analysis

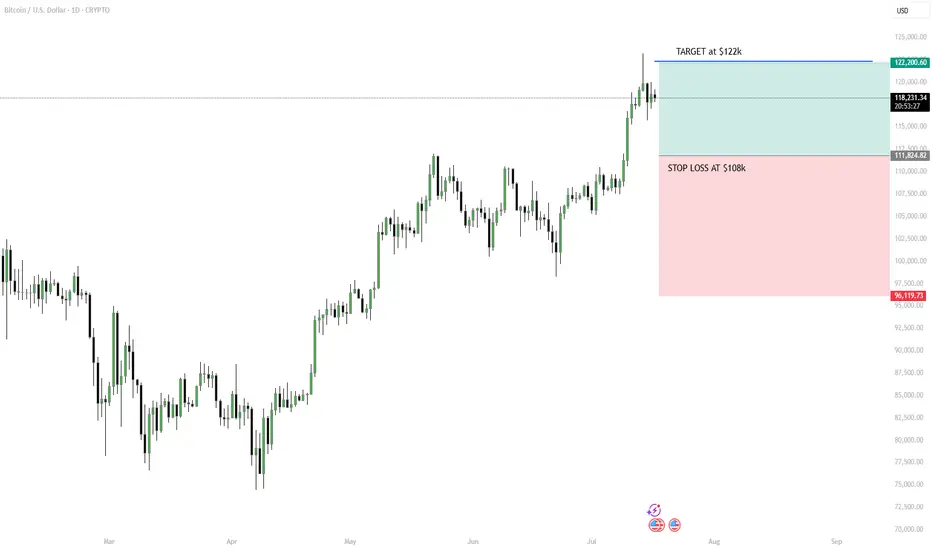
Strategy: “Breakout Bounce” – Buy the Retest, Ride the WaveHello Traders! BTC has broken out above $118K–$120K after a strong uptrend. Now it’s pausing, and a short-term pullback looks likely. Instead of buying the top, we wait for the price to retest previous resistance (around $112K–$114K), which could turn into support.
MY PLAN:
Wait for pullback to $112K–$114K zone.
Look for a bullish candle (daily or 4H) to confirm entry.
Target: $122K short-term or trail stop if trend continues.
Stop loss: Below $108K to manage risk.
Tip: Don’t chase. Be patient, follow the setup, and use proper risk management.
Please leave a comment and don't forget to support a fellow trader! Also, you can leave in the comments your target and plan ideas!
Have a great day y'all!
-Neo
Potential Roadmap for BTC/USD In the next 30-40 daysVolatility incoming. It seems like BTC/USD is heading down to sweep some liquidity range at around 107-110,000.
However, market will recover after that, we are still in the "buy the dip" scenario.
End of August, I can personally still bet that BTC will sit higher than the current level

BRIEFING Week #31 : S&P ATH may have been a TrapHere's your weekly update ! Brought to you each weekend with years of track-record history..
Don't forget to hit the like/follow button if you feel like this post deserves it ;)
That's the best way to support me and help pushing this content to other users.
Kindly,
Phil

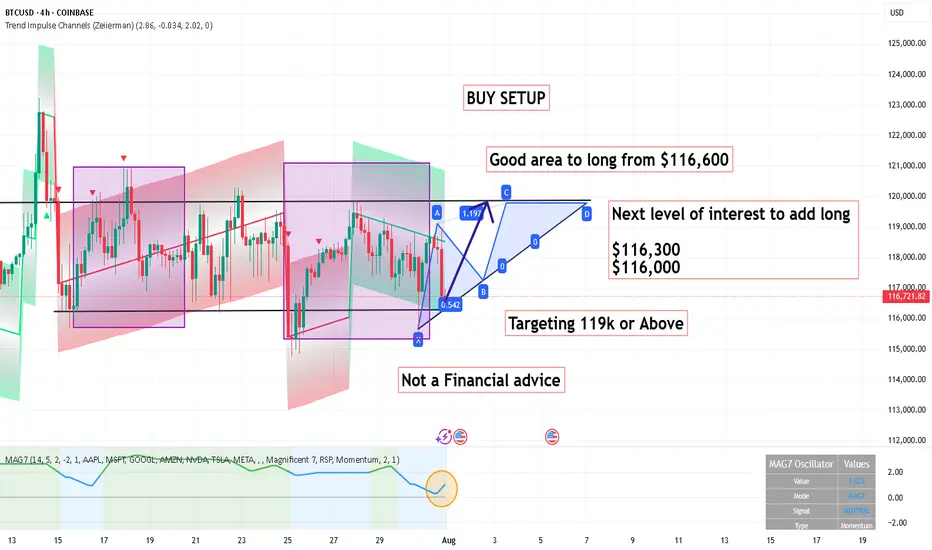
BUY SETUP ,Good area to long from $116,600BUY SETUP
Good area to long from $116,600
Next level of interest to add long
$116,300
$116,000
Targeting 119k or Above
Its not a Financial advice
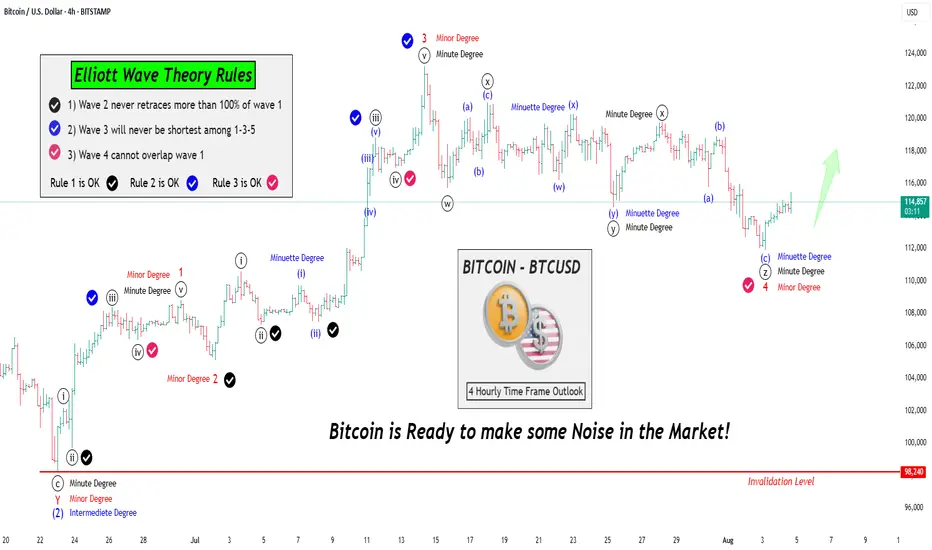
Let's learn & Apply Elliott Wave Rules on chart: BTCUSD BitcoinHello Friends,
Welcome to RK_Chaarts,
Friends, Today we are going to learn 3 Rules of the Elliott Wave theory, there are three principles and some patterns. Impulses move in a 1-2-3-4-5 pattern, either as an impulse or a motive wave. However, within impulses, there are three rules:
Rule No 1:
Wave 2 will never retrace more than 100% of Wave 1.
Rule No 2:
Wave 3 will never be the shortest among Waves 1, 3, and 5; it can be the largest, but never the smallest.
Rule No 3:
Wave 4 cannot overlap Wave 1, except in diagonals or triangles; in impulses, it cannot overlap.
We've checked these three rules and marked them with separate tick marks on the chart with different colors, making them clearly visible. You can review the chart and verify these rules yourself, learning how wave principles are applied and checked.
We've explained all this through a drawing on the chart, so we won't elaborate further here. Moving forward, let's analyze what the wave theory suggests about the current market trend. This entire analysis is shared for Educational purposes only.
I hope you'll consider this educational post as a learning resource, Definitely, I encourage you to review the chart as an image or picture to better understand the concepts we've worked hard to explain.
Our effort will be successful if you gain a deeper understanding and learn something new from this post. If you find this helpful and informative, our hard work will have paid off. Please keep this in mind as you review the material.
Now let's explore how wave counts within wave counts, or lower degrees within higher degrees, unfold through complete wave theory patterns and following theory Rules all the times.
Let's take a closer look at the Bitcoin chart we've analyzed using Elliott Waves. From this perspective, it's clear that the Intermediate Degree Wave (2) concluded around June 23rd.
After this, we observe that the internal wave counts of the lower degree, specifically Wave 1-2-3 (in red) have completed their cycle of Minor degree. Furthermore, Red Wave 4 of same Minor degree has been moving sideways, characterized by a downward trend.
Notably, the fall of Red Wave 4 is classified as a Minor Degree movement. Interestingly, this downward movement appears to have terminated in an even lower degree, namely the Minute Degree, which we've marked in black as ((w))-((x))-((y))-((xx))-((z)) that means Wave 4 of Minor degree (in Red) is complete.
Given that Red Wave 4 Minor has reached its conclusion, it's highly plausible that Wave 5 has initiated. This development suggests that Bitcoin is poised to make a significant move.
Moving on to the analysis, we observe that:
- Rule 1: Wave 2 has not retraced more than 100% of Wave 1, so this rule is intact.
- Rule 2: Wave 3 is not the shortest among Waves 1, 3, and 5, so this rule is also valid.
- Rule 3: Wave 4 does not overlap Wave 1, so this rule is also satisfied.
Bitcoin is all set to shake things up! We eagerly anticipate further rallies in the market.
This post is shared purely for educational purpose & it’s Not a trading advice.
I am not Sebi registered analyst.
My studies are for educational purpose only.
Please Consult your financial advisor before trading or investing.
I am not responsible for any kinds of your profits and your losses.
Most investors treat trading as a hobby because they have a full-time job doing something else.
However, If you treat trading like a business, it will pay you like a business.
If you treat like a hobby, hobbies don't pay, they cost you...!
Hope this post is helpful to community
Thanks
RK💕
Disclaimer and Risk Warning.
The analysis and discussion provided on in.tradingview.com is intended for educational purposes only and should not be relied upon for trading decisions. RK_Chaarts is not an investment adviser and the information provided here should not be taken as professional investment advice. Before buying or selling any investments, securities, or precious metals, it is recommended that you conduct your own due diligence. RK_Chaarts does not share in your profits and will not take responsibility for any losses you may incur. So Please Consult your financial advisor before trading or investing.
BITCOIN's Situation (1h) !!!The price is within an ascending triangle, which could be encouraging. However, since crypto doesn't always follow patterns, it might break down from below and correct to around $116K!
Best regards CobraVanguard.💚

BTC-M2 / Cycle End?Do you see what I am seeing? It appears that M2 is significantly dipping at the end of September. I'd bet my BTC that will be the cycle ending. Remain vigilant!
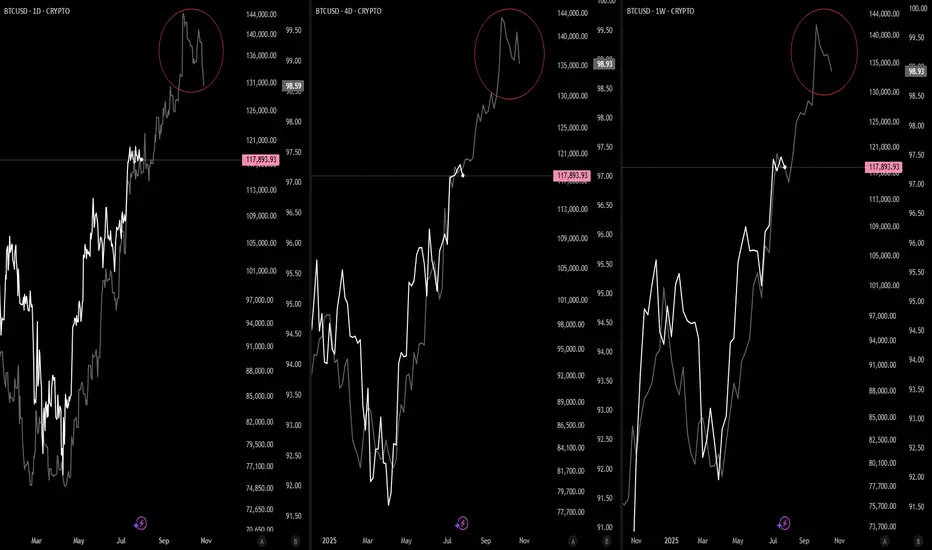
BTC: could this be it? It might be too early to tell, but this could be the top. Strong divergence in Weekly chart, but would only be confirmed if we breakdown the support levels as price can potentially push up into failure. Just a caveat, I can easily be wrong here.