5-20-25 WARNING : Bitcoin Sets Up MASSIVE Double-Top WarningI highlighted this incredible price/technical pattern in my morning Plan Your Trade video. But, I thought it was important enough to create a separate video highlighting this incredible Double-Top warning and to try to tell all of my followers to start actively protecting capital over the next 2-3+ weeks.
As much as I would like to say this won't happen (meaning some type of crisis event or global financial crisis) causing a collapse in Bitcoin (and the US/Global markets) - but I believe the continued constraints on the global markets, related to Trump's policies and attempts to reduce US govt spending) will act as a devaluation event for global economies.
Think about it for a minute...
1. If the US is able to remove $500-900 Billion in fraud/waste/NGO spending (of which, a portion of that spending is dedicated to supporting global initiatives/spending), this will result in a contraction (in some form) for some global economies.
2. If the US is able to negotiate more favorable tariff rates for US goods supplied to the world (where foreign nations reduce or eliminate tariffs on US goods), this will also act as a reduction in economic income for many foreign nations.
3. These combined and continued efforts to restructure the US economy into a strong and more dynamic global economic driver (more fairly balanced in terms of global trade) will come at the expense of breaking away from what has traditionally been untouched.
This breaking of the past, in terms of what nations expected related to US spending and tariffs on US Goods, may represent a 15-25% (or more) contraction in foreign economic activity.
If this disruption from "what was normal" results in the US Fed, or global central banks, taking emergency measures to address short-falls in their economies, this could prompt a series of events that could result in a broad devaluation type of event (very similar to what happened after COVID in 2022-2023).
That event was prompted by the US Fed raising rates trying to stop inflation. This event could be the result of slower/lower economic outputs/expectations related to the changing tariff rates and the reduction in US spending throughout the world. Central Banks and regional governments may attempt to provide some type of capital stimulus to transition through this phase - but I see that as "building a bigger bubble - just waiting to pop".
The smart move for global central banks is to follow the US's lead and start to move towards more austerity/accountability regarding their own economies/spending and attempt to let the devaluation price phase play out.
Either way, time will tell if I'm correct or not.
You have been warned. IMO, you have about 3-6 weeks before BTCUSD potentially tops and may roll into a very strong breakdown phase.
Get Some.
#trading #research #investing #tradingalgos #tradingsignals #cycles #fibonacci #elliotwave #modelingsystems #stocks #bitcoin #btcusd #cryptos #spy #gold #nq #investing #trading #spytrading #spymarket #tradingmarket #stockmarket #silver
BTCUSD trade ideas

Bitcoin: 106K Breakout To 113K Resistance.Bitcoin is attempting to break out of a minor consolidation which is a typical momentum continuation pattern. The updated wave count illustrates the potential (113K area) IF this breakout follows through over the coming week. While the structure is clearly bullish, I suspect this is a 5th of a 5th wave relative to the wave structure dating back to the 2017 peak (weekly chart). For traders this offers plenty of opportunities particularly on the long side, BUT for investors this means the higher it goes, the GREATER the risk. In other words, a break out to new highs should be considered an opportunity to take profits or reduce risk. Wave 5's typically appear to be the "best" time to get involved in a market, but offer the LEAST potential and the greatest risk.
I was not able to write my analysis over the previous week because I was hosting the ICTC 2025 (link in signature). My analysis the week before that was still bullish but I was anticipating a broader retrace which never materialized. Again the key in this game is ADJUSTING, not getting stuck on opinions. IF the 106K is compromised, and the daily candle closes strong, the breakout is more likely to follow through. This can lead price back to the 109K all time high. Since Wave 5's typically go higher than the Wave 3 peak, the next price objective is the 113K area which is proportional to Wave 1 on this impulse (similar length) when projected from the consolidation breakout (see illustration).
It is possible that Wave 5 can extend further, because the broader price structure is bullish. The mistake to avoid is thinking "it's just getting started". The further it goes, the greater the risk. Longer term investors are MOST vulnerable in situations like this because they are more likely to follow the "hype" that surrounds such moves while be completely ignorant to the shrinking shorter term potential. Wave 5's often characterize the idea that the majority of participants who were going to buy have bought, which means there will be much less potential demand in the near future.
This concept is NOT to be confused with long term fundamentals which often don't change. What changes is the sentiment and sentiment is what motivates price. The recent corrective move to the 76K low also illustrates this phenomenon. Fundamentally there was no reason for price to be pushing such lows. Such a move was provoked by the "perceived" risks brought on by the tariff drama which we know now was nothing more than a knee jerk reaction and an enormous buying opportunity for those who have the ability to see through the hype (read my analysis of that time).
In my opinion the best way to navigate this market is on smaller time frames. Anywhere from 1 minute to 4H offers more precise price references to mitigate risk from. Another consideration is if you plan to trade the broader time frame, use smaller than usual sizing if you plan to dollar cost average into higher prices. The trend is clearly BULLISH which means support levels are more likely to hold while resistances are likely to break. Expect more from longs and LESS from shorts. Short setups, while tempting are going to be lower probability. This should only be done by more experienced traders who understand how to manage the elevated risk. This is the mindset I will maintain UNTIL the market proves otherwise.
Thank you for considering my analysis and perspective.

BTC/USD Bullish Setup: Double Bottom Breakout Targeting $110,000 Trade Setup Analysis
1. Support & Resistance Zones
Support Zone (Buy Zone):
Highlighted in purple, between $103,764 and $104,633, with a noted stop loss area near $104,061.
Resistance/Target Zone (Take Profit Area):
Around $109,878 – $110,002 labeled as “EA TARGET POINT”.
2. Double Bottom Pattern (Bullish Signal)
There are two orange circles at the bottom, indicating a double bottom pattern—often a bullish reversal signal.
This is supported by a neckline break near the entry point at $104,534.
3. Moving Averages
Two moving averages are displayed:
Likely a short-term MA (red) and a medium/long-term MA (blue).
The price crossing above both suggests bullish momentum.
4. Trade Plan
Entry Point: Around $104,534
Stop Loss: Below $104,061
Take Profit (Target): $109,878 – $110,002
Risk/Reward Ratio: High, given the tight stop and wide target.
📈 Price Projection
The blue arrowed path suggests:
A minor dip or consolidation near $104,534, followed by a strong upward move toward the target zone.
The movement outlines a classic cup-and-handle or double-bottom breakout pattern.
🧠 Conclusion
This is a bullish trading setup for BTC/USD with a favorable risk-reward ratio. The chart suggests:
Buying near $104,534
Stop loss just below support
Targeting a move to ~$110,000

BITCOIN This Cycle's peak zone is $150k - $200k.Bitcoin (BTCUSD) is extending its gains week after week since the April 07 bottom on the 1W MA50, which as we've analyzed extensively its a new Higher Low launchpad for the new (current) Bullish Leg, the way it's been consistently doing on the Higher Lows trend-line since the start of this Bull Cycle.
It's in fact the very same Higher Lows trend-line it had during both previous Cycles, which ended up peaking on the Logarithmic Growth Curve's (LGC) top 2 zones (red), breaking also above the 2 SD above band (orange) of the Mayer Multiple Bands (MMB).
This time the price has 'only' broken above the 1 SD MMB (grey), while having breached into just the lower pink LGC zone. This highlights the theory of Diminishing Returns but at the same time also shows the strong upside potential of the market while subject to these conditions.
So assuming it won't hit by the end of this Cycle the 2 SD MMB nor the top 2 zones of the LGC, the bad case scenario seems to be topping the lower pink LGC zone and the good case scenario topping the upper pink LGC zone. Those two give a profit taking range of 150 - 200k respectively and based on the Sine Waves, we should peak around October 2025.
Is that your profit taking zone as well for this Cycle? Feel free to let us know in the comments section below!
-------------------------------------------------------------------------------
** Please LIKE 👍, FOLLOW ✅, SHARE 🙌 and COMMENT ✍ if you enjoy this idea! Also share your ideas and charts in the comments section below! This is best way to keep it relevant, support us, keep the content here free and allow the idea to reach as many people as possible. **
-------------------------------------------------------------------------------
💸💸💸💸💸💸
👇 👇 👇 👇 👇 👇

The Bitcoin “Big Short”: Whales Are Quietly Leaving the PartyBitcoin just broke $111,000. Headlines are celebrating. Retail is euphoric. But under the surface, on-chain data tells a very different story: wallets holding over $1,000,000 in BTC—commonly referred to as whales—are quietly exiting.
According to Glassnode, the number of $1M+ wallets has dropped by nearly 9% over the last 60 days, even as price soared to new highs. This isn't a coincidence. It's the classic distribution phase—whales cashing out while late-stage buyers, lured in by ETF hype and bullish momentum, absorb the risk.
Bloomberg Crypto reported this month that over $10 billion in BTC has been moved from cold storage to exchanges, much of it from long-dormant wallets and miner reserves. This pattern echoes what we saw before the 2021 crash—strategic selling into strength.
ETFs: Fuel and Trap
Spot Bitcoin ETFs were pitched as the final gateway to mass adoption. In reality, they’re a liquidity funnel. Retail investors pile in via retirement accounts and brokerages, buying exposure—but not the asset itself. Meanwhile, institutional whales sell BTC into these passive flows.
As Bloomberg’s ETF Weekly noted in May 2025, “The majority of ETF inflows are retail-led, while OTC desks are reporting increased large-lot sell requests.” It’s a perfect storm: passive inflows mask whale exits, and the average buyer is blind to what’s really happening on-chain.
On-Chain Red Flags
The blockchain doesn’t lie. Key warning signs are flashing:
$1M+ wallets falling: Down from ~139K to ~126K since March.
Exchange reserves rising: Indicating coins are being positioned for liquidation.
Long-term holder profit-taking: SOPR is above 1.6—profit margins not seen since the last major top.
Dormant coins awakening: Older UTXOs (2+ years) are being spent at the fastest rate since late 2021.
Even miners are capitulating. Miner-held balances are down 12% YTD, and transfer spikes suggest they're taking advantage of inflated prices to fund operations.
Why It Matters
This isn’t FUD. It’s math. When the most informed market participants offload supply into a leveraged, overextended retail-driven rally, the result is rarely soft. If BTC loses key support around $95K, the slide to $60K—or lower—could be violent and fast.
The chart may look bullish. But the blockchain shows distribution, not accumulation. The whales aren’t tweeting. They’re cashing out.
Retail is late to the party. The smart money is already gone.
Golden Cross? No Thanks!! Here’s How to Get In Early.📉 “Golden Cross? No Thanks. Here’s How to Get In Early.”
By FXProfessor
Everyone’s hyped about the Golden Cross again...
📰 “Bullish Signal!”
📈 “50 SMA crossed the 200!”
🎉 “Party time!”
Let me stop you right there.
If you’re waiting for that cross to go long —
You’re not late.
You’re definitely late.
The Golden Cross is a lagging indication.
It’s the afterparty. The smart money already had the drinks and left.
🔍 Here's the deal:
✅ Golden Cross forms after the move
✅ Price is usually already up double digits
✅ Sometimes it triggers right before a top
✅ Even EMAs (which I prefer) are still confirmation tools
✅ The real edge? Structure. Trendlines. Pressure zones.
📊 What I use instead:
-Custom EMAs that react faster
-My signature parallelogram method for early pressure
-Focus on trendlines and structure
-Above all — logic, not hype
- Fundamentals first!
For example, while the Golden Cross just printed, I was already watching $74,394 and $79,000.
Why? Because pressure builds before indicators react.
That's where the best entries live.
So next time someone posts
“Golden Cross confirmed!” 😏 Just smile and remember:
By the time the cross lights up, I’m already halfway to the next target.
Use EMAs if you like. But structure comes first.
That’s where the party starts.
One Love,
The FXProfessor 🧠📈
Disclosure: I am happy to be part of the Trade Nation's Influencer program and receive a monthly fee for using their TradingView charts in my analysis. Awesome people who care about the TRADER FIRST!

Bitcoin - Here we have the all time high!Bitcoin - CRYPTO:BTCUSD - is just getting started:
(click chart above to see the in depth analysis👆🏻)
It was really just a matter of time until we see a new all time high on Bitcoin. Consindering that over the past two months alone, Bitcoin rose another +50%, this was a clear indication that bulls are taking over. But this all time high is clearly not the end of the bullrun.
Levels to watch: $300.000
Keep your long term vision!
Philip (BasicTrading)

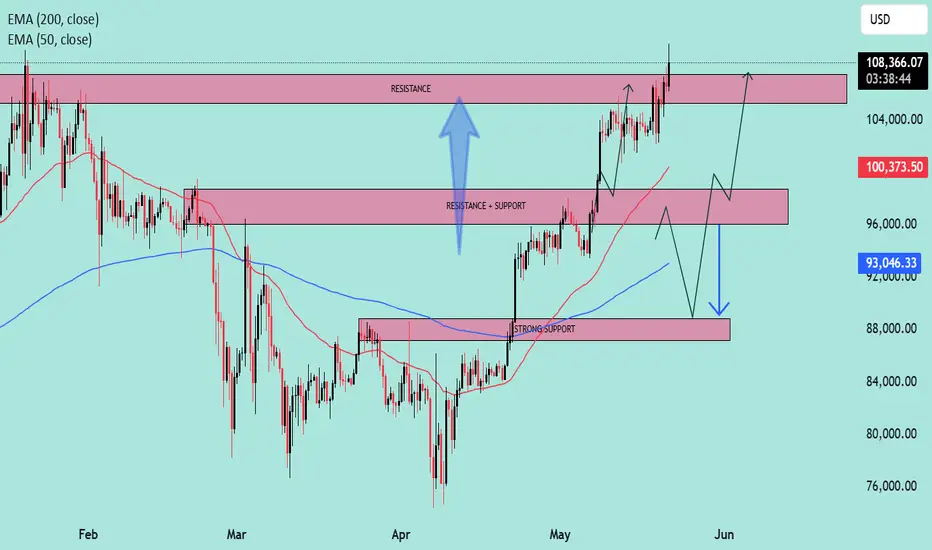
BTC/USD..4H CHART PATTERN..Here’s a structured trade plan based on me *BTCUSD SELL* entry:
### *Trade Plan: BTCUSD SELL @ 105,300*
*Risk-Reward Ratio:* ~1:2.5 (assuming stop loss at resistance)
#### *Key Levels:*
- *Entry:* *105,300*
- *Stop Loss (SL):* *107,300* (above resistance, ~1.9% risk)
- *Take Profit (TP):* *93,600* (~11.1% downside target)
#### *Risk Management:*
- *Risk per Trade:* Adjust position size so that a move to SL loses an amount im comfortable with (e.g., 1-2% of capital).
- *Leverage:* If trading with leverage, ensure it’s low enough to avoid liquidation (e.g., 3-5x for conservative plays).
#### *Additional Notes:*
1. *Confirmation:* Wait for bearish rejection (e.g., pinbar, RSI divergence) near *107,300* before entering.
2. *Partial Profit-Taking:* Consider closing 50% at *~99,500* (midway TP) and trailing SL for the rest.
3. *Market Context:* Monitor Bitcoin sentiment (ETF flows, macro news) as breaks above *107,300* could invalidate the setup.
*Alternative Scenario:*
- If price breaks *107,300, the bearish thesis weakens—watch for a retest-then-rally toward **110,000*.
Would you like help refining the setup or analyzing supporting indicators (e.g., RSI, volume)?

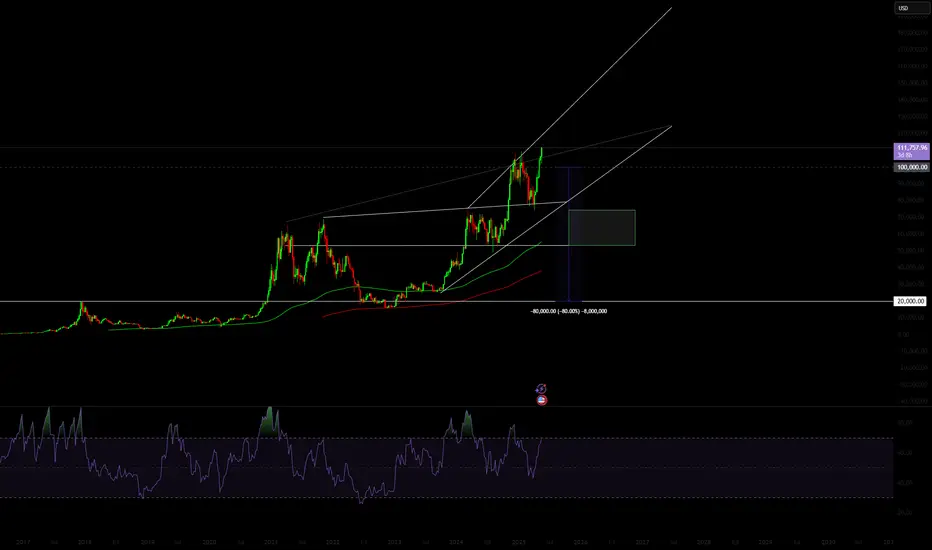
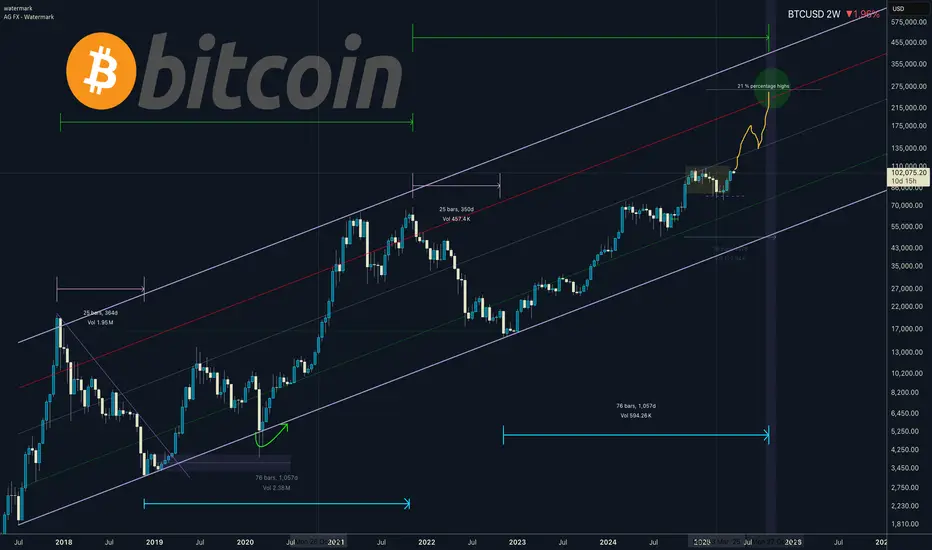
Bitcoin - Final pump to 120k, then 60k in 2026Bitcoin is in the final stage of the bullish cycle, and we want to look for the best price to sell and prepare for the 2025/2026 bear market! The best price to sell Bitcoin is at the 1.618 FIB extension or at the main long-term 2017-2021-2025 trendline. This is exactly at 122,069, as we can see on the chart.
Buying Bitcoin at the tipity top of a bullish cycle is not the best idea, because we will see 60,000 USD per bitcoin in 2026! From the Elliott Wave perspective, there is probably only 1 high-probability scenario, and it's this ending diagonal pattern (rising wedge). I think we will see a final 2 waves on Bitcoin to form an ending diagonal wedge pattern (1-2-3-4-5). Bitcoin is in wave 3.
I am also bullish because of the 50-week moving average. Historically, Bitcoin reacted to this MA very precisely. I always recommend using simple moving averages with 20, 50, 100, and 200 periods because this is what the big players are using as well. These MAs are very popular among giant institutions, banks, and investors.
Write a comment with your altcoin + hit the like button, and I will make an analysis for you in response. Trading is not hard if you have a good coach! It is not a trade setup, as there is no stop-loss or profit target. I share my trades privately. Thank you, and I wish you successful trades!

BTCUSD NEXT MOVE (EXPECTING MILD CORRECTION)(23-05-2025)Go through the analysis carefully, and do trade accordingly.
Anup 'BIAS for BTCUSD (23-05-2025) (SHORT TERM)
Current price- 1111000
"if Price stay below 1,12,000 then next target is 1,10,000, 1,08,000 and 1,06,000 above that 1,13,000.
-POSSIBILITY-1
Wait (as geopolitical situation are worsening )
-POSSIBILITY-2
Wait (as geopolitical situation are worsening)
Best of luck
Never risk 2% of principal to follow any position.
Support us by liking and sharing the post.

SPY/QQQ Plan Your Trade For 5-21 : Inside-BreakawayI've been very clear over the past few weeks that I believe the markets are poised for a rollover/topping pattern and I believe BTCUSD is showing us exactly how/when that rollover top is going to play out (June 1-June 9).
In the meantime, I believe the SPY/QQQ are entering a more volatile "early topping" formation while still in an uptrend (Bullish).
I urge traders to start watching various sectors for weakness and keeping your eyes open for any signs the market could be moving into a sideways price rotation.
I think the rollover top will be aligned with some financial event (trade/tariff/other) that will result in a broad disruption of the US/Global markets. And I believe BTCUSD will lead the move by about 4-7+ days.
Gold and Silver are starting to move higher again. That is a sure sign that traders are now more actively seeking to hedge global risks (again).
I believe this move higher in metals may continue through this week and into next week (looking for that top in the SPY/QQQ).
Follow my detailed BTCUSD video to learn why BTCUSD may continue to try to push a bit higher before topping and moving into a broad price decline.
Get some..
#trading #research #investing #tradingalgos #tradingsignals #cycles #fibonacci #elliotwave #modelingsystems #stocks #bitcoin #btcusd #cryptos #spy #gold #nq #investing #trading #spytrading #spymarket #tradingmarket #stockmarket #silver

BITCOIN is attempting to converge with past Cycles!Bitcoin (BTCUSD) is experiencing the weakest Bull Cycle in its history, a natural product of the Theory of Diminishing Returns (TDM).
This chart couldn't have put it better as we show all Cycles since BTC's first day, one on top of the other. Naturally the first Cycles were the most aggressive, witnessing extraordinary gains as the upside potential of a fresh market was enormous in its early days.
The 2015 - 2017 (blue trend-line) and 2019 - 2021 (black trend-line) Bull Cycles have been harmonized to a more traditional capital market state and this is obvious on their trend-lines, which exhibit similar parallel price action. Whenever the two diverged, they converged at some point during the Cycle.
The current Cycle (2023 - 2025) following the late February 2025 divergence, is now attempting to converge again with its strong rebound in the past 6 weeks. Being however within a Channel Up throughout the entirety of the Cycle, it appears that it will do so in a structured way and as the TDM suggests, will offer weaker gains.
What we can project, as we've shown on previous studies in great detail, is the timing of the Cycle Top. Based on past Cycles, it should be within October - December 2025. Timing your exit strategy can perhaps be more effective than assigning a certain Target, even though the peak is expected to be anywhere within the $150k - $200k range.
So do you agree that the rise we're witnessing is the Cycle's attempt to converge with past ones and close the gap before it tops? Feel free to let us know in the comments section below!
-------------------------------------------------------------------------------
** Please LIKE 👍, FOLLOW ✅, SHARE 🙌 and COMMENT ✍ if you enjoy this idea! Also share your ideas and charts in the comments section below! This is best way to keep it relevant, support us, keep the content here free and allow the idea to reach as many people as possible. **
-------------------------------------------------------------------------------
💸💸💸💸💸💸
👇 👇 👇 👇 👇 👇

A 1.61 Break Usually Means Massive UpsideBTC has a current top on the 1.61. Heading into 1.61 fibs I always tend to lead with a bias of a reversal because if it happens it's massive and if I am wrong I'll usually make a bit of money in a short term reaction off it anyway.
If the 1.61 has a reaction and then later sustains a breakout - that's a very different situation.
After clean 1.61 breaks is the time to make good money on the long side. The first run into it I consider risky, but if it breaks then it's green light.
If BTC is able to hold and sustain the 1.61 break - then I think the next major jump leg goes to $140K. This may be a stall/pullback level but we'd probably then trade through to next resistances.
Pure fib levels would have a top forecast around 240K. Given the typical overshoots we tend to have, this would more likely be around 300K.
Things get really interesting if the 1.61 break holds.

BITCOIN Ultimate Cycle Zones breakdown! See when to sell!Bitcoin (BTCUSD) is extending its amazing rebound on its 1W MA50 (blue trend-line), having recovered all of the losses sustained following the U.S. - Chine Trade War. Based on this Cycle's pattern, this 1W MA50 rebound is technically the new Bullish Leg, essentially its 4th of this Cycle.
Among all this, we managed to identify another cyclical pattern, separating the Cycle in terms of Activity Zones:
Naturally its very bottom is what we call the 'Best Buy Zone' (green), where BTC's earliest and most optimal buy opportunities existed. That ranges within the 0.0 and 1.0 Fibonacci levels.
Above that it's the 'Final Buy Zone' (yellow) where in relative efficieny terms, the last long-term buy opportunities existed. That Zone consists of the 1.0 and 2.0 Fibonacci levels.
Third in line is the 'First TP Zone' (orange) where long-term investors who seek lower risk, can start taking profit on their positions. The range on that is the 2.0 - 3.0 Fibonacci levels.
Lastly it's the 'Fina TP Zone' (red) where obviously it is the last opportunity (and with the greatest return but also elevated risk) to take profits before the Cycle prices its Top. This consists of the 3.0 - 4.0 Fibonacci range.
As you may have noticed, each Zone has a .618 interval (highlighted in blue). Zone 1 has the 0.618 Fib, Zone 2 the 1.618 Fib, Zone 3 the 2.618 Fib and one 4 the 3.618 Fib. This is where (so far) the price has made a first consolidation - correction after the start of the new Bullish Leg and before it gets completed at the top Fib. The last such consolidation was from mid December 2024 to late January 2025 and as you see those tend to be significant marks.
This model shows that the current Bullish Leg should prepare us for the Final TP Zone and its first stop is the 3.0 Fib at $135k. This is the bottom of the Final TP Zone and the first region that long-term investors should consider taking profits. The key 3.618 Fib extension is at $210k and in our opinion is the absolute max level we should look to sell all positions as chronologically Cycle wise the trend falls there towards the end of the year, which is where all Cycles topped. A 4.0 Fib test is highly unlikely to take place within this Cycle, unless macroeconomic fundamentals (extreme adoption and/or monetary intervention) kick in and that sits at $280k.
But what do you think? Do you agree with this Zones break-down and if yes are you considering taking profits at 135000? Feel free to let us know in the comments section below!
-------------------------------------------------------------------------------
** Please LIKE 👍, FOLLOW ✅, SHARE 🙌 and COMMENT ✍ if you enjoy this idea! Also share your ideas and charts in the comments section below! This is best way to keep it relevant, support us, keep the content here free and allow the idea to reach as many people as possible. **
-------------------------------------------------------------------------------
💸💸💸💸💸💸
👇 👇 👇 👇 👇 👇

Hellena | BITCOIN (4H): LONG to resistance area of 110,000.Colleagues, I believe that the upward movement is not over yet, so I move wave “3” higher as prolonged.
I believe that the price will reach a strong resistance level of 110,000.
A small correction is possible, as usual.
Manage your capital correctly and competently! Only enter trades based on reliable patterns!

Technical Levels Respected – BTC Reaches $108K Target what next?📍 BTC Target Hit with Precision!
✅ As predicted in the previous analysis, Bitcoin has successfully tapped the $108K resistance zone — clean and technical execution!
📊 My chart spoke in advance... and the market listened.
🎯 Why miss out on these accurate forecasts?
📉 My strategies are not just random lines — they’re built on solid market structure, EMAs, and key price action zones.
📢 Let’s stay connected!
🧠 I’m committed to sharing educational content and professional trading insights to help you grow as a trader.
💡 Whether you're a beginner or seasoned trader, there’s always something new to learn with me.
📚 Join the journey — learn, trade, and win!
📩 DM or follow to get consistent updates and chart breakdowns.
🚀 Let’s trade smart, not hard!
Failure to Break the 1.61 Could Get Really Bad. I've recently posted the implied breakout plan if BTC can get through the 1.61 zone. The expected strength and levels of this move are important to map in at this point and especially important for bears to understand because if we break then the move can happen with no big pullbacks.
In the event of the 1.61 break, that's when we tend to really see the big rally move that people have been saying you have to be positioned for while we were heading into the big correction. Now would be the time a sustainable breakout would be made and there'd be easy money to be made on the long side if it breaks.
For an analogous example the forecast I made of NVDA going from 500 to 1,000 was based on this same kind of break.
But if we make a failure to break the 1.61 those can get all sorts of nasty. It usually starts with a quick return to the 1.27 and when the 1.27 has broken that's usually a full failure of the trend. When looked at after the fact, it's obvious the 1.27 break was an important moment in the trend.
Making this an exceptionally important point for BTC. If the breakout can be sustained there's a lot of good ops following local structure. Stops can be set under it and you can look to hit 1:5 + RR trades on all the corrective moves. Trailing stops on this could work out extremely well, the first major resistance after a 1.61 break being 140K.
If the attempt to break the 1.61 fails, it'll usually start with a big shock move and develop into a cruel bear market.
Now would be a time to be wise about risk to both sides. For trades, it's highly likely we soon head into extremely profitable markets.
Which side we break to is largely irrelevant, a simple style of move is predicted to either side once the 1.61 decision is made.
But I'll tell you one thing, if the 1.27 ends up failing that would be expected to get very nasty. The kinda nasty we're apparently not allowed to say is possible about things like BTC ...
If you have exposure to this, on either side, you should be very careful if it begins to go against you.
A major trend decision is likely made soon.
A bear move would typically start with some shock news and capitulation sell off. Would be aware of that if something weird happened.

#BITCOIN HISTORY IS ABOUT TO REPEAT !!#Bitcoin HISTORY IS ABOUT TO REPEAT! 🔥
The next move is obvious…
🔹 November 2023: Major breakout led to a 140% rally
🔹 October 2024: Another breakout fueled a 50% move
🔹 Now — May 2025: We are currently observing the Semmeler structure; will it break out again? 👀
New ATH loading... 🚀
CRYPTOCAP:BTC BITSTAMP:BTCUSD BINANCE:BTCUSDT

get in loser, we're going to 1M.gm,
before i share my in-depth analysis, i just wanted to share a piece of my mind on how i approach this market:
there are many valid trajectories constantly at play. most people only ever see one; and they get emotionally attached to it. it’s usually the one that validates their own internal bias. they follow people who align with their belief system, and they end up in an echo chamber of regurgitated information, all in the name of pride and ego.
there’s nothing wrong with that, but you won’t find any of that on my page.
when i create a projection, i’m not just drawing it out. i spend a thousand hours tuning into the vibe... i become it. temporarily, i am the trajectory, which allows me to speak from its perspective on a deep, intuitive level. i’m not here to convince you that my idea is playing out. i’m just showing you that it’s one of many valid trajectories in this market.
this one here just happens to be my primary.
it has been for years, and it will remain my primary until we, at the very least, reach 752k.
now, that might sound mind-boggling to a lot of people, especially those still tuned into outdated belief systems or the mainstream media, which is incredibly gloomy right now.
----
what i have before you is a bullish nest that took 3 years to form;
a structure built with precision and patience,
and it's about to rip faces once the third wave explosively and unexpectedly begins.
i’ve color-coded all the waves for your convenience,
and i come to you this morning with a simple heads-up:
a monumental breakout is about to unfold.
and the harsh truth is,
you’re probably not going to be a part of it
because you got shaken out right before it began.
---
🌙
---

BITCOIN is going to 250K easily and even higherHey what's up traders here is my thesis why 250k is in play and not that difficult to reach.
First of all the game has changed. It's not anymore driven by stacking more BTC by you or me. It's institutional game now. I will give you some numbers for perspective.
As you can see here - individuals selling why big boys buying.
Supply and demand game.
The will ever be only 21 Million BTC. By the way Your goal should be to own at least 2.1 BTC. There is only 165 000 BTC is mined in a year - Now watch the demand.
ETF s - 500K BTC bought last year
Corporations (MSTR, Metaplanet) - 250 BTC
They already bought more than 3 years supply now we got
Goverment buys - This year could buy couple hundred thousands
Where these bitcoins will come from, it could come only from people who will be willing to sell which is in higher prices.
Is economy playing role ?
Yes , overall it can help, if we have no recession , Tariffs etc.. but overall it will not stop or affect adoption. Look in to 2020 lows it was Best Buy during the covid, same like 2023 low - Best Buy when Russia invaded Ukraine , Recently Tariffs fear and it was also great buy at 75K.
Global liquidity - M2 money supply
Bitcoin is driven by 4 years cycles affected by halvings but mainly by M2 money supply which is also expanding in the 4 years cycles to simplify - more central banks printing fiat is devaluated and BTC is rising and they are now printing a lot and they will print even more because US has to pay 9 trillion interest on their debt soon. That is why the trump is forcing FED Powell to cut rates.
Available BTC on exchanges is still draining if these big players continue with this pace it will be all gone soon.
So here you have it - There is more demand than supply for many future years driven by institutional adoption, governments and global liquidity.
bearish Divergence on BTC 1HBTC is forming a bearish Divergnece on the 1h timeframe. I expect a 10-15% drop from here. Might just test 100k as support 15% retracement in wcs.

Bitcoin: The CME Futures PREMIUM, New All-Time High ConfirmedOk, you got me, I will reveal my secrets to you. I only do this because I love you and I want to give you true value. Great content that you can truly trust because it is based on real market data. Just watch!
» Bitcoin CME Futures price: $104,425 (BOOM!)
» Bitcoin BTCUSDT Spot price: $103,600 (Checkmate)
There is a premium on Bitcoin futures price. This means the market is bullish, plain and simple. You can bet your house, a hotel and your wife on the fact that Bitcoin will soon hit a new All-Time High.
The signals are in.
You can fight me in the comments section or you can simply agree and follow me.
Namaste.

BTCUSD Analysis Today: Technical and On-Chain !In this video, I will share my BTCUSD analysis by providing my complete technical and on-chain insights, so you can watch it to improve your crypto trading skillset. The video is structured in 4 parts, first I will be performing my complete technical analysis, then I will be moving to the on-chain data analysis, then I will be moving to the liquidation maps analysis and lastly, I will be putting together these 3 different types of analysis.
