Btcusd techinical analysis.Btcusd techinical analysis next move posibale at h1 time.not finchinal advice.
BTCUSD trade ideas

BTCUSD has boken up Trendline and SupportBTCUSD has boken up Trendline and Support, It may retrace futhur before regaining bullishness.

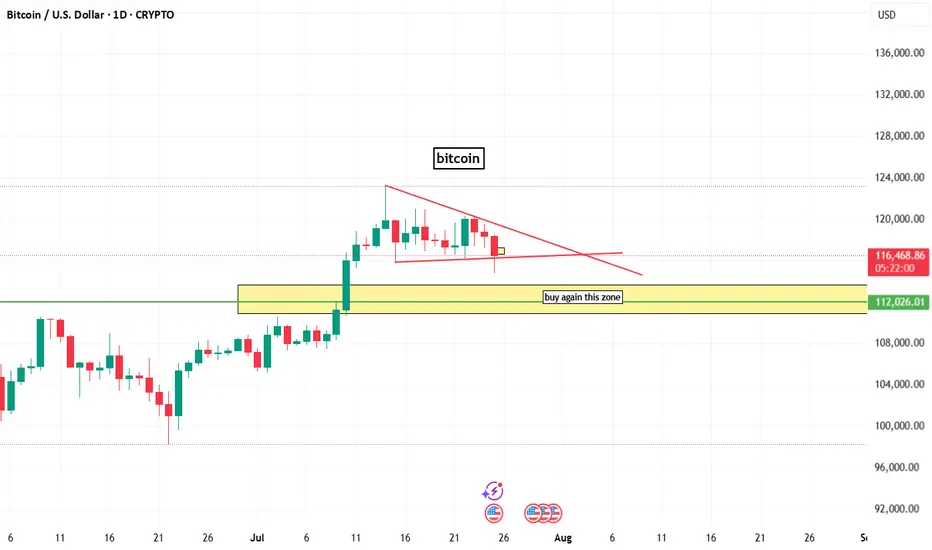
bitcoin chart analysisbitcoin chart analysis on daily time frame
here a buy zone that indicated by box and line.
and on chart bitcoin bullish but lower time frame btc is berrish.
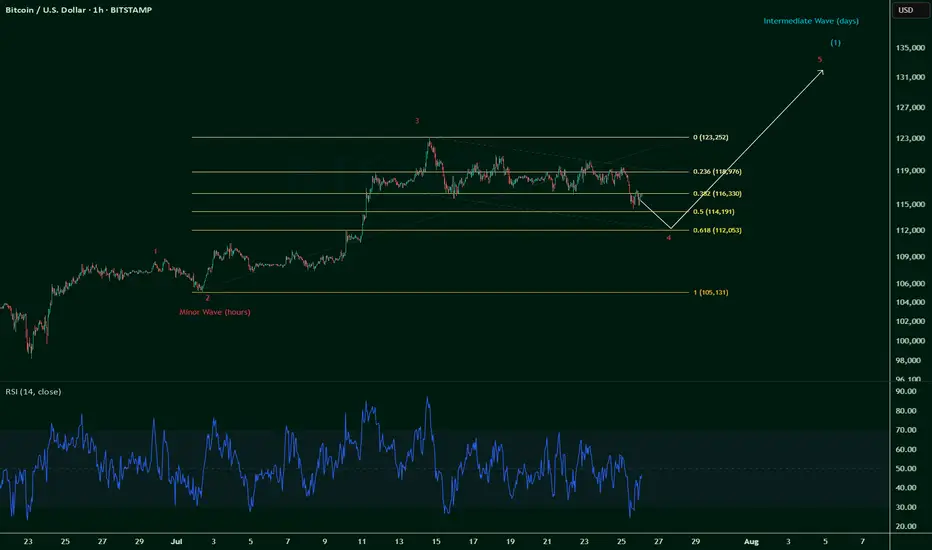
$BTC breaks $115k invalidates Wave 5 -- still Wave 4 correction.So it was a long squeeze after all, and one that was coming.
The initial thoughts were that we're on a Wave 5 up and counting:
But we're brought back down to earth as CRYPTOCAP:BTC breaks below $115k, invalidating a Wave 5 count.
So, it's official: we're still on a Wave 4 correction, which can go as low as 0.618 fib towards $112k.
Now painting a likely scenario given that Wave 2 correction only moved 0.236 fib ~ 0.328 fib (Wave 2 & Wave 4 often contrast):
This could play out till end July or even all the way into early August, which if comes to fruition, could signal for a bullish August.
And August has historically almost always been a bearish month (8 red historical months out of 12).
Pinch me.
The sell trigger for Bitcoin is being activated.After breaking out of the channel and pulling back to the lower boundary (previous support) of the channel, we expect the price to decline.
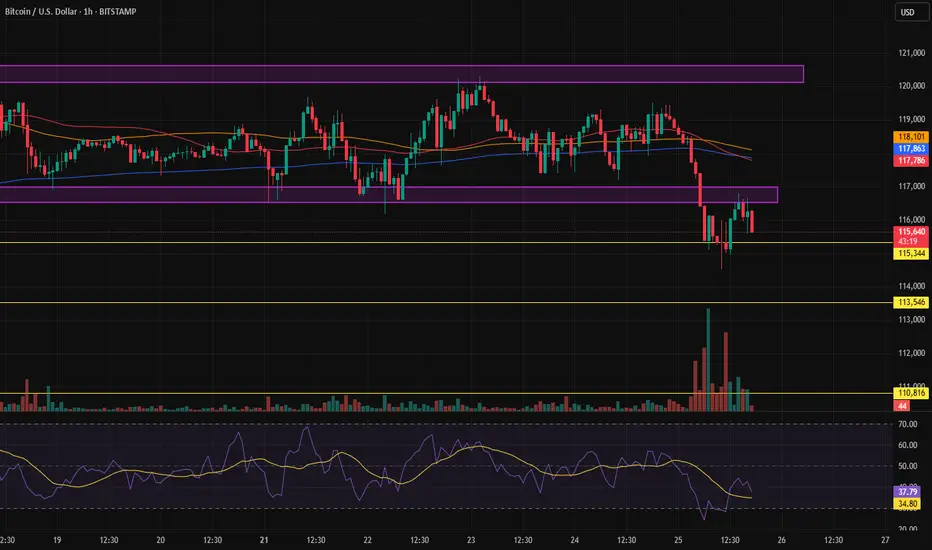
BTCUSDT pauses before the next big moveAfter a strong breakout in early July, BTCUSDT is now consolidating within a clear range between 116,000 and 120,000 USD. The price has repeatedly bounced from the bottom and faced rejection at the top, forming a well-defined sideways pattern on the H4 chart.
The EMA34 and EMA89 are providing solid support to this accumulation phase. If the 116,000 support zone holds and volume confirms, Bitcoin could resume its previous uptrend and aim for the 124,000 level.
At the moment, this looks like a “breather” zone before the market picks its next direction.
Personally, I’m still expecting another bullish leg—how about you?

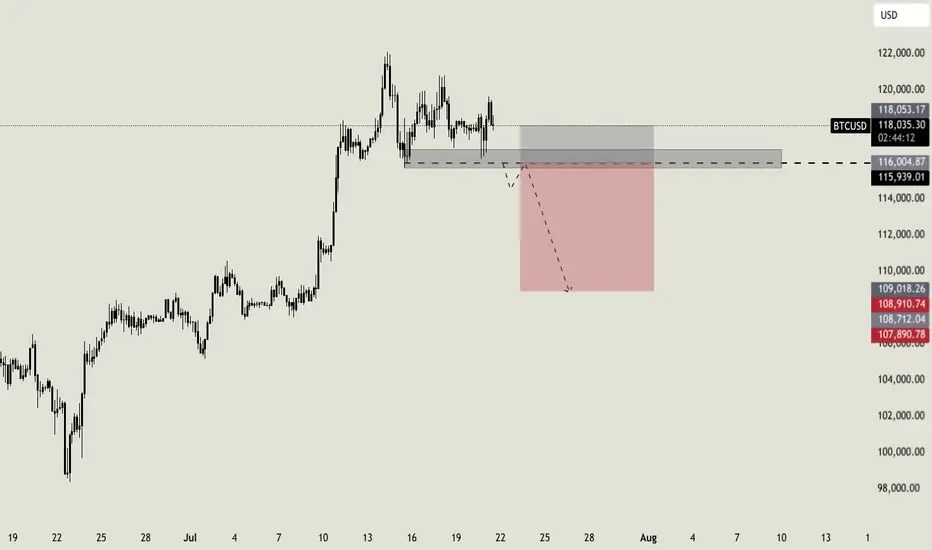
Bitcoin short setupBTC is ranging on top, this means next leg is preparing. Most traders are positioned long, that's why i think price will sink after a break below my key area. I will wait a break and a retrace before entering short, targeting the $109.000 area
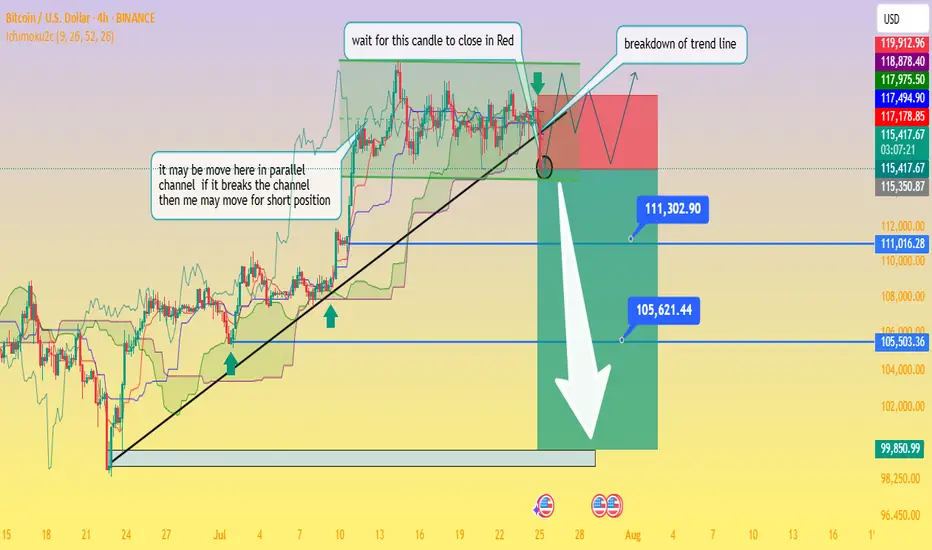
Critical Breakdown: BTC/USD Poised to Fall — Waiting on H4 CloseAnalysis of the BTC/USD 4‑Hour Chart
From the chart you provided, here's how the technical situation looks:
Ascending trendline support has been tested multiple times and was recently breached this afternoon, signaling a possible shift from the bullish setup to a bearish continuation.
The price is now trapped within a descending triangle formation beneath a well‑defined swing high resistance zone. This reflects indecision in the market, with neither buyers nor sellers in clear control
Business Insider
+15
Fxglory Ltd
+15
Bitcoin News
+15
.
Key levels to monitor:
Support zone: ~$115,500, extending down to ~$111,300 and ~$105,600 as deeper targets if bearish momentum strengthens.
Resistance zone: ~$119,000–120,000 area, forming strong overhead supply
Economies.com
DailyForex
Bitcoin News
.
The chart’s annotations align with a classic breakout strategy—with the caveat: wait for a confirmed close below the trendline before considering short positions (as noted in your “wait for this candle to close in red” comment).
Breakout confirmation would likely pave the way toward your indicated profit zones near ~$111k and ~$105k, with a larger potential down to ~$99.8k if further downside pressure builds.
🔍 What the Broader Market Signals
Technical sentiment from sources covering today’s analysis shows BTC/USD hovering just under $120,000, stuck within the defined range of $115.5k support to $120k resistance
Economies.com
.
While there’s still neutral momentum in indicators like RSI and MACD, the short-term direction leans bearish if the breakdown is confirmed on the H4 timeframe
Fxglory Ltd
.
Analysts emphasize that sustained movement above $116.5k could retarget resistance near $119–120k. A failure there and a move below $115.5k may thrust price deeper toward your downside zones
DailyForex
.
✅ Trading Strategy Overview
Scenario Trigger Target Levels
Bearish Breakdown H4 candle closes below trendline ~$115.5k $111.3k → $105.6k → possible $99.8k zone
Bullish Rejection Bounce back above ~$116.5k and trending above resistance $119k–120k retest, potential breakout if sustained
Neutral / Wait-and-see No decisive candle close yet Hold for confirmation
⛳ Final Thoughts
chart highlights a critical point: don’t act prematurely. Wait for a decisive H4 candle close below the trendline before committing to shorts. Confirmed bearish action around the breakout could open the path to the lower targets you identified. However, if price rebounds above support and climbs above $116.5k, a short-term retest of $119k–120k is still in range.
Traders should maintain prudent risk management—watching the unfolding price action around these pivot points without overreaching. Let me know if you'd like help crafting entry/exit zones or risk profiles for this setup!
BTCUSD BUYING can expect a bullish move from bitcoin as it has dropped a fair amount and can extract a reversal to the up side due to being oversold
BTCUSD Daily Analysis – Golden Pocket Hold Before a Bullish?🧠 Chart Description & Market Structure:
The BTCUSD daily chart is showing a consolidation phase after forming a local high near $123,231. Currently, the price is retracing and approaching a key Fibonacci retracement zone between the 0.5 level ($115,557) and 0.618 level ($113,740) — also known as the Golden Pocket, which is often a strong reversal area.
---
📈 Bullish Scenario:
If the price holds within or just above the 0.5–0.618 Fibonacci zone (highlighted in yellow) and forms a bullish reversal candlestick (like a hammer, bullish engulfing, or pin bar), there’s a high probability for BTC to resume its uptrend.
Bullish upside targets include:
$119,842 as minor resistance.
$123,231 as the previous swing high and a key breakout confirmation.
A successful break above $123,231 could send BTC toward the next major targets around $128K–$132K.
---
📉 Bearish Scenario:
If the price fails to hold the 0.618 Fibonacci level ($113,740) and breaks down below the key psychological support at $111,500, a deeper correction may occur.
Downside targets:
$108K–$106K as the next major support zone.
A break below this could lead to the formation of a lower high structure and potentially trigger a bearish continuation.
---
📊 Pattern Observations:
Potential Bullish Flag or Rectangle Consolidation: The price action suggests horizontal consolidation after a strong rally — possibly a re-accumulation zone before a bullish continuation.
Golden Pocket Retest: Price is currently testing the Fibonacci 0.5–0.618 zone, often targeted by institutional buyers and technical traders as a potential entry point.
---
🧭 Key Levels to Watch:
Major Resistance: $123,231 (swing high)
Minor Resistance: $119,842
Fibonacci 0.5: $115,557
Fibonacci 0.618: $113,740
Key Support: $111,500
---
🔖 Conclusion:
BTC is currently in a decision zone. Price action within the $115,500–$113,700 range will be crucial. Will this be a healthy retracement before the next leg up — or the beginning of a deeper correction?
#BTCUSD #BitcoinAnalysis #CryptoTA #FibonacciRetracement #CryptoChart #BitcoinDaily #BullishSetup #BearishSetup #CryptoMarket

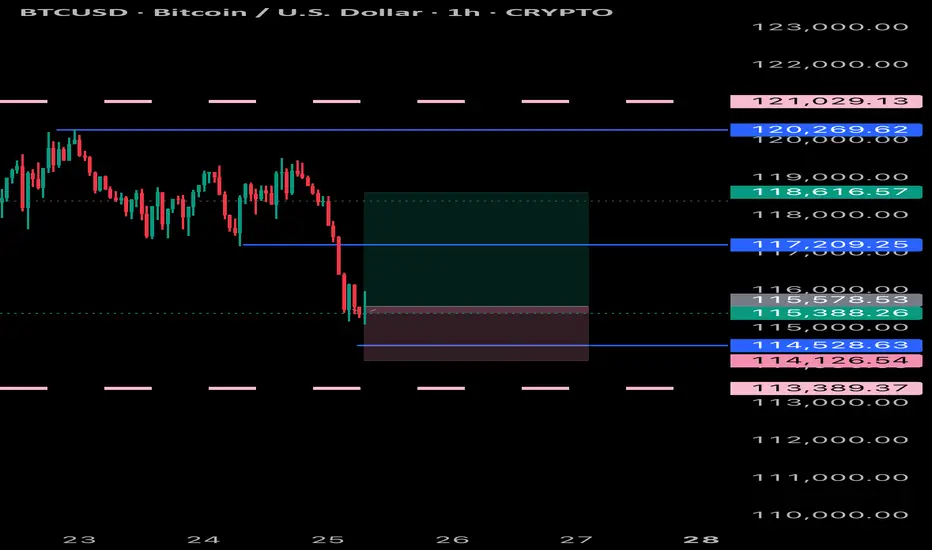
BTC/USD – 4H Technical and Fundamental AnalysisBTC/USD – 4H Technical and Fundamental Analysis
BTC/USD saw sharp downside pressure today, driven by a wave of long position liquidations—exceeding $800 million across the crypto market in the past 24 hours. The sudden shift triggered panic selling, dragging Bitcoin below its psychological and technical support near $116,000. Broader crypto market sentiment turned risk-off as large investors reduced exposure, accelerating the sell-off.
Fundamentally, the market remains cautious amid a lack of positive macroeconomic catalysts for risk assets. Speculation about stricter U.S. regulatory oversight and declining inflows into crypto ETFs also dampened sentiment. Combined with hawkish remarks from Fed officials, which keep interest rates elevated, appetite for high-risk assets like Bitcoin weakened further.
From a technical perspective, BTC/USD broke below the major support level of $116,000, confirming bearish pressure. This breakdown followed a period of consolidation, with price failing to maintain bullish momentum. A liquidity hunt appears to be underway, with price revisiting the zone to trap breakout traders before resuming its move.
We are now watching for a confirmed 4H candle close below the liquidity zone. Once confirmed, a short setup is validated, with targets aligned with the next key support zone.
📍 Sell Setup
Entry: Sell Limit at 115,980.00
Stop Loss: 117,985.00
Take Profit: 111,940.00
📌 Disclaimer:
This is not financial advice. Always wait for proper confirmation before executing trades. Manage risk wisely and trade what you see—not what you feel.

BTC/USD Technical Analysis — Educational BreakdownBTC/USD Technical Analysis — Educational Breakdown
🧠 Key Observations:
🔹 Market Structure: Break of Structure (BOS) Confirmations
The chart highlights multiple BOS points, showing clear transitions in market structure – a strong indication of bullish momentum building up after prior consolidation and retracements.
🔹 Support Zone (Demand Area): 115,355 – 117,403
This area has acted as a liquidity pool where buyers previously stepped in, forming the base for new BOS formations. A retest of this level could offer a high-probability long entry.
🔹 Resistance Zone (Supply Area): 123,375 Region
This marked level is a prior high and expected profit-taking or potential short-trigger zone. Price is likely to target this level if bullish momentum continues.
⸻
📈 EMA Analysis (20/50/100/200)
• Stacked Bullishly: EMAs are layered with the shorter-term EMAs (20/50) above the longer-term ones (100/200), suggesting trend continuation to the upside.
• Price reclaiming above all EMAs signals momentum is shifting from accumulation to expansion.
⸻
🔮 Potential Scenario:
1. Bullish Retest Play
A pullback toward the demand/support zone (116k–117.4k) can present a high-RR entry.
2. Continuation Toward Resistance
If price holds above the EMAs and structure, we could see a push toward 123,375, where profit booking may occur.
⸻
📌 Market Sentiment Bias: Bullish
• Structure: Bullish BOS
• Momentum: Above all EMAs
• Volume Profile: High acceptance near

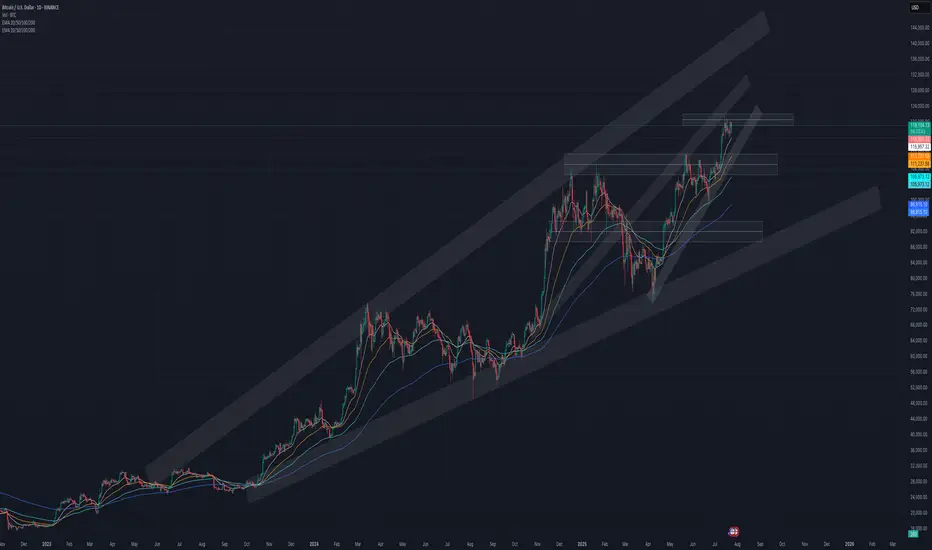
Revsiting $150k - $200k Bitcoin (AND Next Bear Market Bottom)In this video I revisit my 2-year old study showing the potential path for Bitcoin to $150k to $200k and not only how we might get there, but the 11 reasons WHY we can this cycle.
This is the same Fibonacci series that predicted the 2021 cycle high at the 3.618 (Log chart) and used the same way this cycle, with some interesting 2025 forecasts of:
1.618 - $100k
2.618 - $150k
3.618 - $200k
There are quite a few confluences that we get to $150k like the measured moves from both the recent mini bull flag, but also the larger one from earlier this year.
** Also I touch on revisiting my study from 2 years ago where I may have discovered the retracemebnt multiple that correctlty predicted and held the 2022 lowes around $16k. **
It's a VERY interesting number you all will recognize (buy may not agree with).
Let me know what you think.

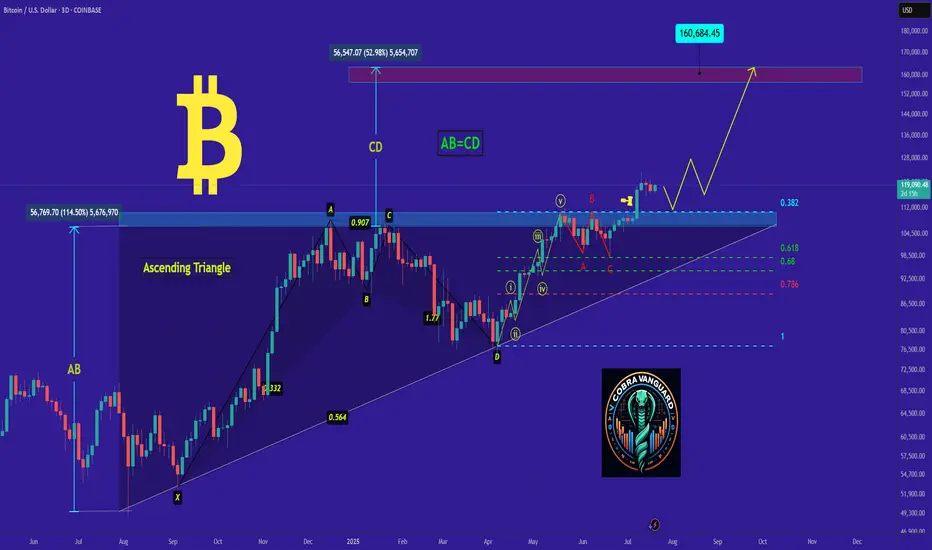
𝐛𝐢𝐭𝐜𝐨𝐢𝐧's Situation, A Comprehensive Analysis !!!As I said, Bitcoin broke the triangle, and now with a slight price correction, it could surge to $160,000, and you still think I'm joking!!
Previous analysis
BTC, zoom out!!!Based on your prediction that Bitcoin will change at a rate of 5% every year, the price of Bitcoin would be $124,709.55 in 2026, $151,585.24 in 2030, $193,465.44 in 2035, and $246,916.38 in 2040. Scroll down to view the complete table showing the predicted price of Bitcoin and the projected ROI for each year.
$BTCUSD bullish short term before Intermediary Wave 1 pullbackSupercycle (years): Wave (III)
Cycle (months): Wave III
Primary (weeks): Wave ((3))
Intermediate (days): Wave (1)
Minor (4H): Wave 5
Looks bullish in the short term.
Let's Go!

Long -Market Moving in an uptrend
-Market consolidating at a support level
-Market has broken and tested counter down trend trendline.

Will Bitcoin be the beneficiary of Gold's downside?It looks like bitcoin might be in bullish wedge formation. Will gold be the beneficiary of potential more gold downside?

BTC # Bitcoin (BTC/USD) 30-minute chartThis Bitcoin (BTC/USD) 30-minute chart shows a symmetrical triangle pattern forming, with price action compressing between a descending resistance (red trendline) and an ascending support (gray trendline). The price is currently near the apex of the triangle at $118,149, suggesting a potential breakout or breakdown soon. Key support and resistance levels are marked at $115,200 and $120,200 (blue lines). A breakout above the red line could indicate bullish momentum, while a drop below the gray support may signal bearish continuation. Traders should watch for a decisive move outside the triangle for confirmation.
thanking you

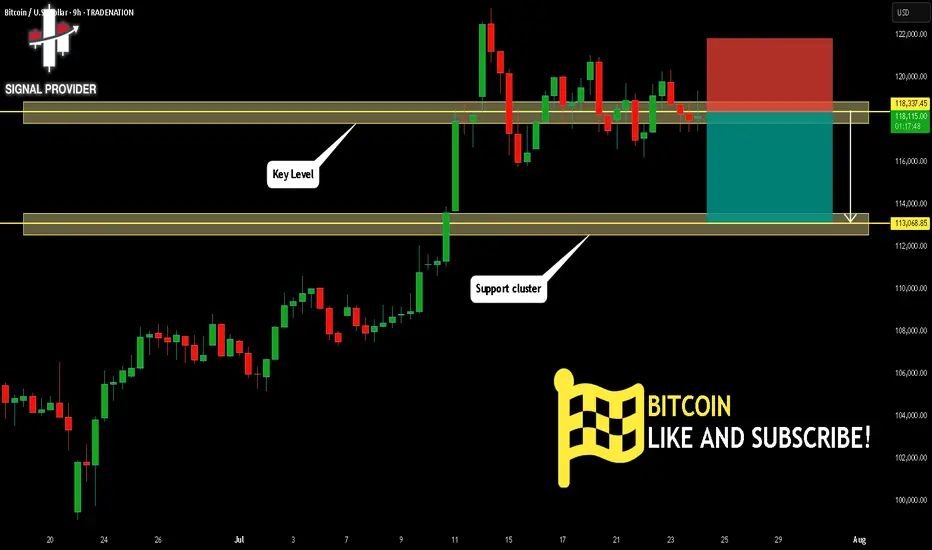
BITCOIN Will Fall! Short!
Take a look at our analysis for BITCOIN.
Time Frame: 9h
Current Trend: Bearish
Sentiment: Overbought (based on 7-period RSI)
Forecast: Bearish
The market is approaching a key horizontal level 118,337.45.
Considering the today's price action, probabilities will be high to see a movement to 113,068.85.
P.S
We determine oversold/overbought condition with RSI indicator.
When it drops below 30 - the market is considered to be oversold.
When it bounces above 70 - the market is considered to be overbought.
Disclosure: I am part of Trade Nation's Influencer program and receive a monthly fee for using their TradingView charts in my analysis.
Like and subscribe and comment my ideas if you enjoy them!
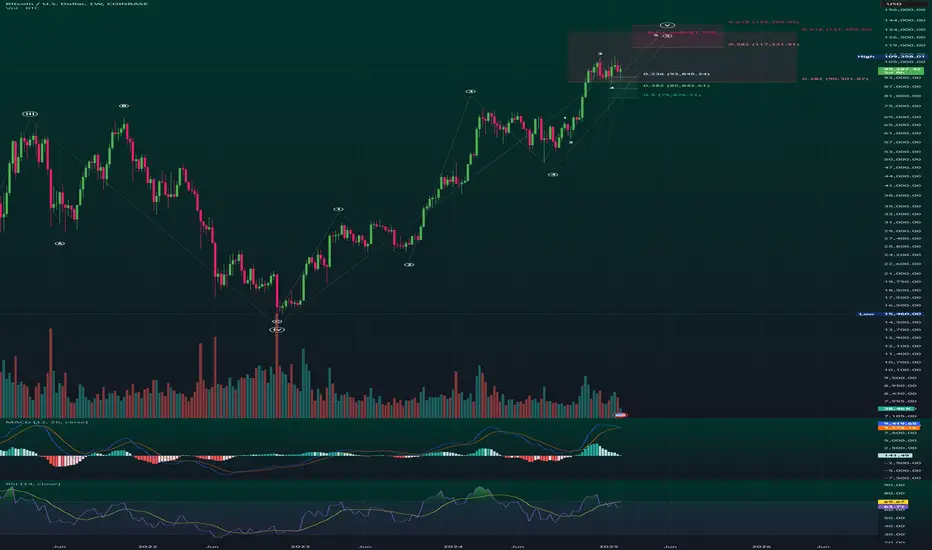
Bitcoin (BTC/USD) Weekly Analysis. Bull Market Top1️⃣ Key Market Structure - Elliott Wave Analysis
📉 Elliott Wave Progression:
BTC is in Wave 5️⃣, which historically marks the last bullish impulse before a potential correction.
Wave 3️⃣ was strong, confirming the trend continuation.
Now BTC is approaching the potential Bull Market Top 🚀.
🟢 Current Market Position:
BTC is forming Wave 5, targeting $117K - $139K as per Fibonacci extensions.
The final Wave 5 completion zone is projected within this range.
2️⃣ Fibonacci Retracement & Extension Levels
📊 Fibonacci Levels to Watch:
📍 0.236 Retracement: $93,845.34 ✅ (Minor pullback support)
📍 0.382 Retracement: $85,842.61 ✅ (Stronger correction zone)
📍 0.5 Retracement: $79,876.11 ⚠️ (Critical mid-level support)
🎯 0.382 Extension: $117,331.51 (Potential first target resistance)
🎯 0.618 Extension: $139,205.03 (Bull Market Top Projection)
📌 BTC Weekly High: $109,358.01
📈 BTC Current Price: ~$99,449.97
3️⃣ Technical Indicators - Confirmation Signals
📊 MACD (Momentum Indicator)
✅ MACD Histogram is still positive ➝ Confirming bullish momentum.
⚠️ Flattening MACD lines ➝ Indicates momentum might be slowing.
📊 RSI (Relative Strength Index):
🔼 RSI is near overbought zone (~69-70)
⚠️ Possible local top - BTC might need a correction before further upside
4️⃣ Key Support & Resistance Zones
🛑 Major Support Levels:
🟢 $93,800 (0.236 Fib - Short-term pullback zone)
🟢 $85,800 (0.382 Fib - Stronger correction zone)
🟢 $79,800 (0.5 Fib - Must hold support for long-term bullish trend)
🎯 Resistance Levels - Price Targets:
🔴 $109,000 (Current High - Short-term resistance)
🔴 $117,000 (First Major Resistance - 0.382 Fib Extension)
🚀 $131,000 - $139,000 (Bull Market Top Zone - 0.618 Fib Extension)
5️⃣ Trading Strategy & Market Outlook
💹 Bullish Bias Until BTC Breaks Below $93,800
🎯 Target Areas for TP (Take Profit):
✅ Conservative Traders: Exit near $109,000 - $117,000
✅ Higher Risk Targets: $131,000 - $139,000
⚠️ Risk Management:
🛑 Stop-loss: Below $93,000 to protect against a deeper correction.
📈 Scaling In: Consider adding positions if BTC retraces to the 0.382 ($85,800) or 0.5 ($79,800) Fibonacci level.
💡 Summary & Final Thoughts:
✅ BTC is in the final Elliott Wave 5 move, targeting a potential Bull Market Top of $131K - $139K based on Fibonacci extensions.
⚠️ However, RSI is overbought, and MACD momentum is slowing, meaning a pullback to $93K or $85K is possible before the next move higher.
🚀 Bullish until BTC breaks below key supports. Watch $109K and $117K for short-term resistance.
📊 Strategy: Hold long positions with profit-taking targets at $117K, $131K, and $139K. Use $93K as a support level for risk management.

BTCUSD As BTCUSD fell back to 118k, we’ve some good break of structure to the downside with some good momentum seen from the H4 timeframe. Could this be giving us some good bearish sentiment? Or it’s just one of the mini-fluctuations pullbacks as they accumulate enough orders to push the BTCUSD markets even higher.
