BTC #The chart depicts a 15-minute Bitcoin (BTC/USD)The chart depicts a 15-minute Bitcoin (BTC/USD) price action forming a cup and handle pattern, which is generally considered a bullish continuation pattern. The rounded base signifies consolidation, followed by a potential breakout above the $120,250 resistance zone (blue line). A breakout with volume could confirm upside momentum. The shaded grey area below (~$117,000) represents a support zone, crucial for invalidation of the pattern if breached.
thanking you
BTCUSD trade ideas

Continuation flag ?Looks like a continuation flag, thoughts?
ETH is in a pullback, BTC didnt have one,
looks like a strong bullish flag

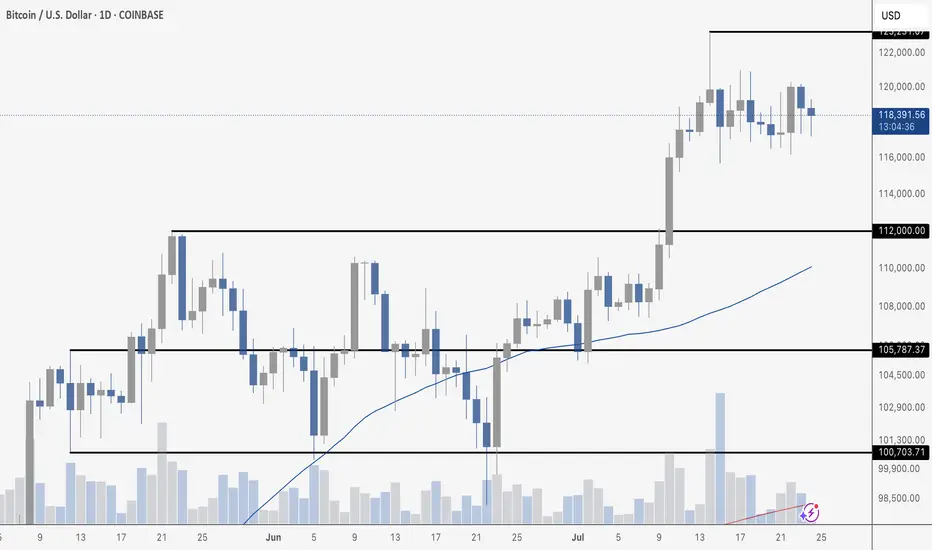
BTC CONSOLIDATESBitcoin is clearly consolidating after its recent breakout above $112K. Price is chopping between roughly $116K and $121K, taking a breather after last week’s rally. Tuesday marked the highest daily close in BTC history, but follow-through has been muted so far.
Volume is trending lower during this range-bound action, which is typical during consolidation. The 50-day moving average continues to rise and now sits around $110K, providing a strong cushion if price pulls back.
The structure remains bullish above $112K, but traders are watching for a breakout above $125K to confirm the next leg higher. Until then, expect more chop as the market digests gains.
Wind up before the big pitch!The longer we coil here, the more vicious the move up will be. Put your tray tables in the upright position and prepare for takeoff...

BTC Ready to Start to 125KMorning folks,
Better if you combine this update with previous idea. Now it seems that BTC stands in swamp action, flirting around 116K, which might be looking a bit bearish.
But by our view, this is not quite so. First is, triangle patterns as on daily chart as on 4H chart are look great and quite bullish. Pay attention that on 4H chart all sell-offs were bought out.
Our 1.16 lows that we set as vital ones for this scenario area still intact. So, it means that butterfly with 125K target that we discussed last time is also intact. I would say more. If you take a careful look at 1H chart - you could recognize reverse H&S pattern that could trigger all this stuff. It means that we're not in swamp, but at the point where the decision on long entry has to be made...
Take care
S.
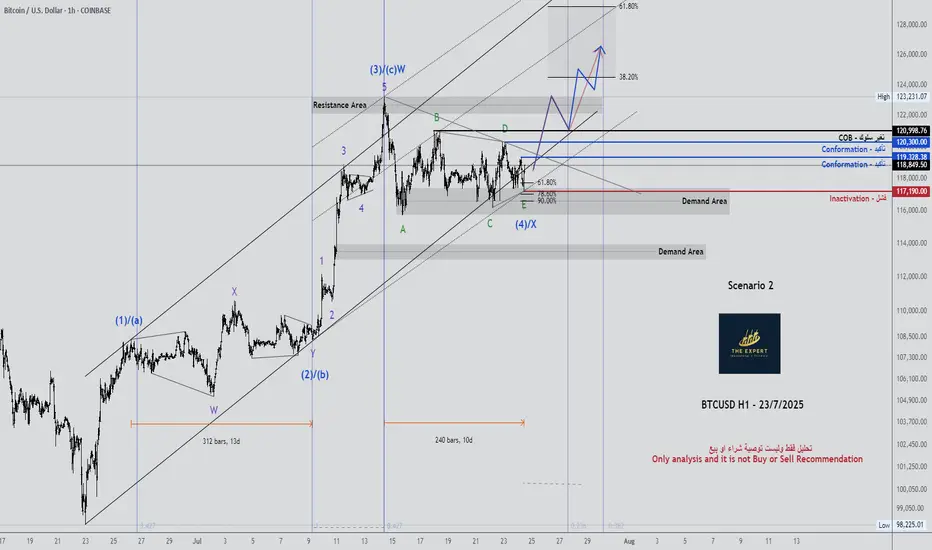
BTCUSD H1 - Updated 23/7/2025BTCUSD H1 - Updated 23/7/2025
chart has language
Only analysis and it is not Buy or Sell Recommendation.
Good-luck.
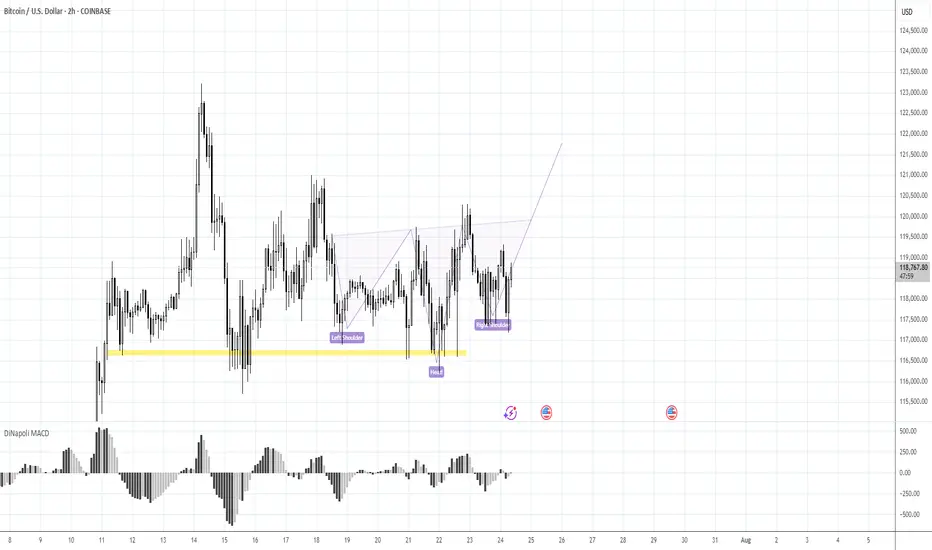
BTCUSD LOST SHORT-TERM BULLISH POTENTIALBTCUSD LOST SHORT-TERM BULLISH POTENTIAL
Bitcoin has been trading sideways since July 15th within a range of 116,000.00-120,000.00. Indicators show no signs of a new bullish/bearish trend.
How to trade sideways movements or range?
It is better to wait for a price to come close to one of the levels (support or resistance), then open buy/sell order. Or just pace a limit order and wait. Take-profit may be above/below the support/resistance levels with a stop-loss behind these levels (below for the support and above for the resistance).
So, the price decline towards 116,000.00 is expected, where potentially the price may rebound once again.

Use Base-Anchored Fibonacci Retracement Formula🔹 Step 1: Base-Anchored Fibonacci Retracement Formula
🧮 Retracementₓ = Base + (Range × x)
Inputs:
• 🟢 Base = $74,458.42
• 🔴 High = $112,006.33
• 📏 Range = $112,006.33 − $74,458.42 = $37,547.91
📐 BTC Retracement Levels (Upward from Base)
1️⃣ Fib 0.236
= 74,458.42 + (37,547.91 × 0.236)
= 74,458.42 + 8,862.92
= $83,321.34
2️⃣ Fib 0.382
= 74,458.42 + (37,547.91 × 0.382)
= 74,458.42 + 14,362.66
= $88,821.08
3️⃣ Fib 0.500
= 74,458.42 + (37,547.91 × 0.500)
= 74,458.42 + 18,773.96
= $93,232.38
4️⃣ Fib 0.618
= 74,458.42 + (37,547.91 × 0.618)
= 74,458.42 + 23,285.25
= $97,643.67
5️⃣ Fib 0.786
= 74,458.42 + (37,547.91 × 0.786)
= 74,458.42 + 29,597.78
= $104,056.20
6️⃣ Fib 1.000
= 74,458.42 + 37,547.91
= $112,006.33
🚀 BTC Extension Levels (Beyond High)
📈 Extensionₓ = High + (Range × x)
1️⃣ Fib 1.618
= 112,006.33 + (37,547.91 × 0.618)
= 112,006.33 + 23,285.25
= $135,291.58
2️⃣ Fib 2.618
= 112,006.33 + (37,547.91 × 1.618)
= 112,006.33 + 60,767.17
= $172,773.50
3️⃣ Fib 3.618
= 112,006.33 + (37,547.91 × 2.618)
= 112,006.33 + 98,249.08
= $210,255.41
📊 Final BTC Levels
🎯 Target 🧭 Fib Level 💰 Price
TP1 0.236 $83,321.34
TP2 0.382 $88,821.08
TP3 0.500 $93,232.38
TP4 (High) 1.000 $112,006.33
TP5 1.618 $135,291.58
EXT2 2.618 $172,773.50
EXT3 3.618 $210,255.41
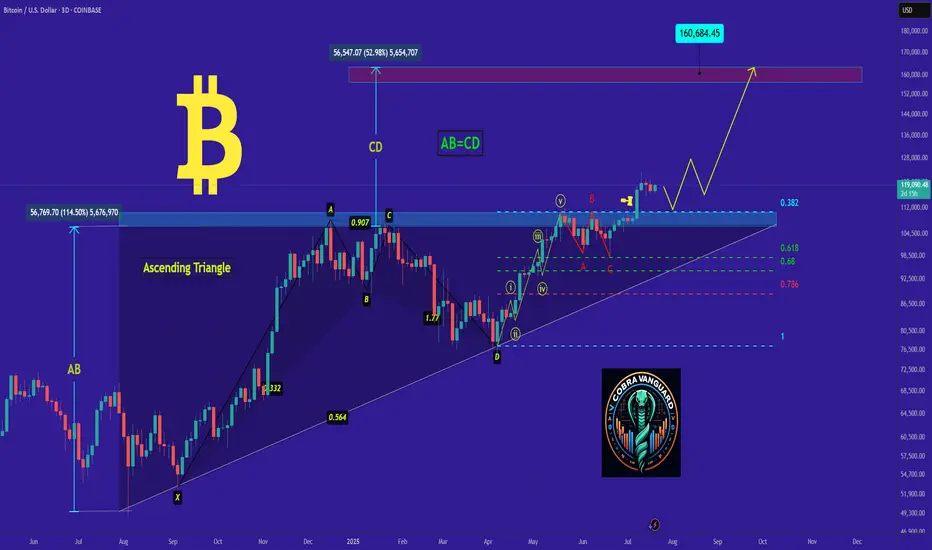
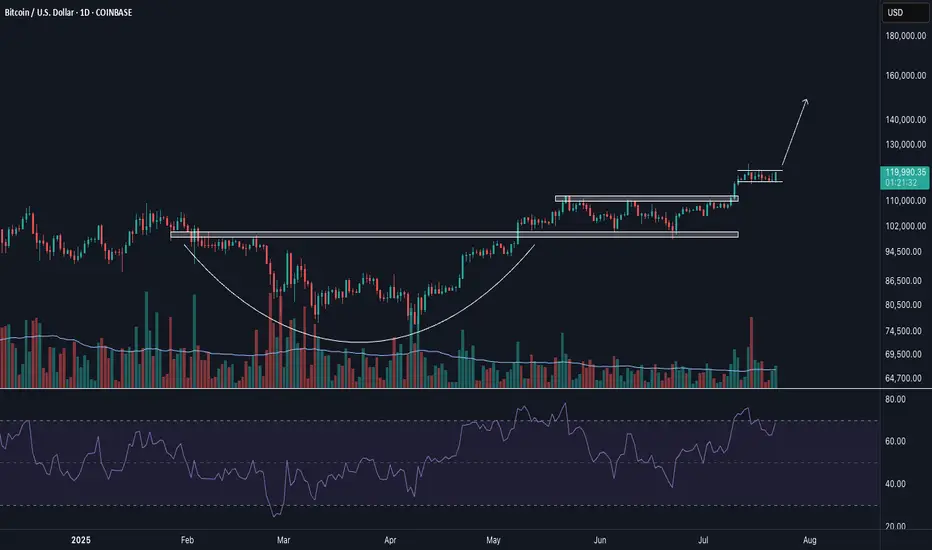
𝐛𝐢𝐭𝐜𝐨𝐢𝐧's Situation, A Comprehensive Analysis !!!As I said, Bitcoin broke the triangle, and now with a slight price correction, it could surge to $160,000, and you still think I'm joking!!
Previous analysis
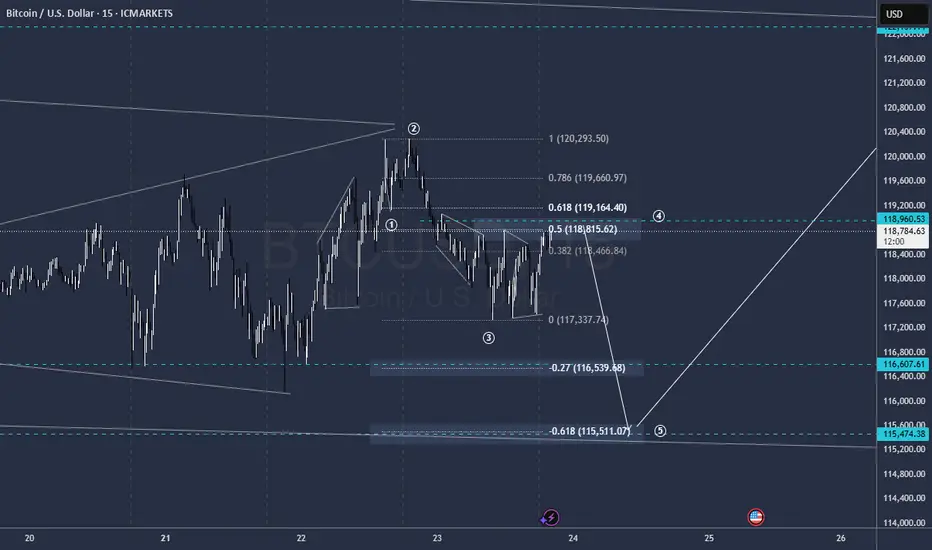
A good time to reentry Short BTCAlways i nice to reentry in profits
entry level 119.000
targets 116.600 / 115.600
SL 119.600
BTCUSD Bullish energy buildup supported at 114,850The BTCUSD remains in a bullish trend, with recent price action showing signs of a corrective pullback within the broader uptrend.
Support Zone: 114,850 – a key level from previous consolidation. Price is currently testing or approaching this level.
A bullish rebound from 114,850 would confirm ongoing upside momentum, with potential targets at:
122,900 – initial resistance
124,420 – psychological and structural level
126,250 – extended resistance on the longer-term chart
Bearish Scenario:
A confirmed break and daily close below 114,850 would weaken the bullish outlook and suggest deeper downside risk toward:
112,860 – minor support
110,825 – stronger support and potential demand zone
Outlook:
Bullish bias remains intact while the BTCUSD holds above 114,850. A sustained break below this level could shift momentum to the downside in the short term.
This communication is for informational purposes only and should not be viewed as any form of recommendation as to a particular course of action or as investment advice. It is not intended as an offer or solicitation for the purchase or sale of any financial instrument or as an official confirmation of any transaction. Opinions, estimates and assumptions expressed herein are made as of the date of this communication and are subject to change without notice. This communication has been prepared based upon information, including market prices, data and other information, believed to be reliable; however, Trade Nation does not warrant its completeness or accuracy. All market prices and market data contained in or attached to this communication are indicative and subject to change without notice.

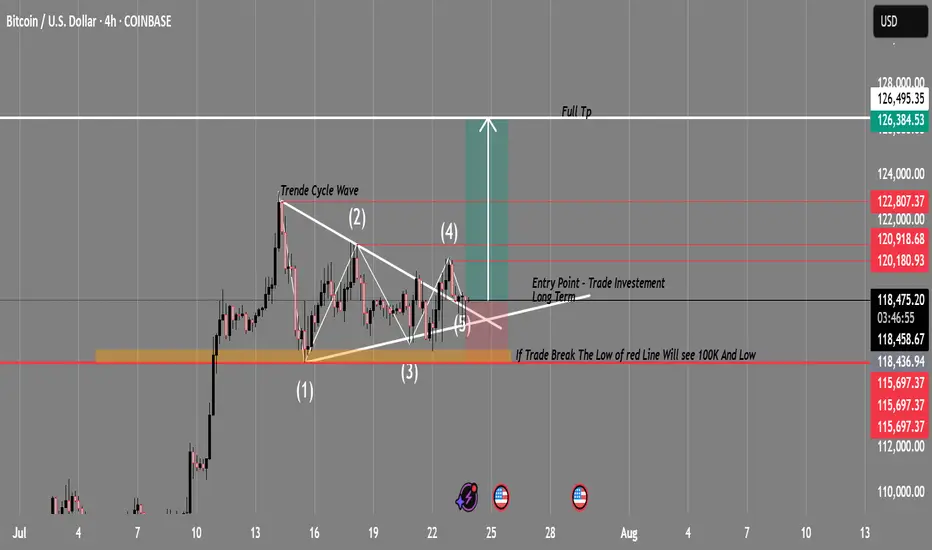
BTC/USD Swing Trade Setup | Breakout Imminent?Timeframe: 4H
Exchange: Coinbase
Strategy: Triangle Breakout + Wave Cycle Analysis
🔍 Technical Overview:
BTC is currently compressing within a symmetrical triangle pattern after completing a 5-wave cycle, suggesting a potential breakout is near. This structure indicates indecision — but also builds up momentum for a major move.
🔹 Wave Analysis: Complete cycle (1-5) within triangle
🔹 Support Zone: 115,697 (critical level — demand zone)
🔹 Resistance Breakout Target: 127,594 (measured move from triangle breakout)
🔹 Entry Point: Confirmed breakout above the triangle resistance (~118,500)
🔹 Invalidation: Strong 4H close below 115,697 = setup invalid
🔹 Risk/Reward: Favorable — breakout above resistance could trigger a strong bullish wave
🟢 Bullish Plan:
Entry: Break + Retest of upper trendline (~118,500)
Stop Loss: Below 115,697
Target 1: 122,800
Target 2: 126,384
Full TP: 127,594
🔴 Bearish Warning:
⚠️ “If price breaks the red support zone (115,697), BTC could drop sharply — possibly toward the 100K level and beyond.”
— a key invalidation level to monitor closely.
🧠 Conclusion:
This is a classic consolidation-to-breakout setup. Monitor volume and breakout confirmation before entering. If bullish momentum holds, this swing trade has great long-term potential.
💬 What do you think? Will BTC break bullish or drop to 100K? Drop your thoughts 👇
📌 Follow for real-time updates and future chart ideas!
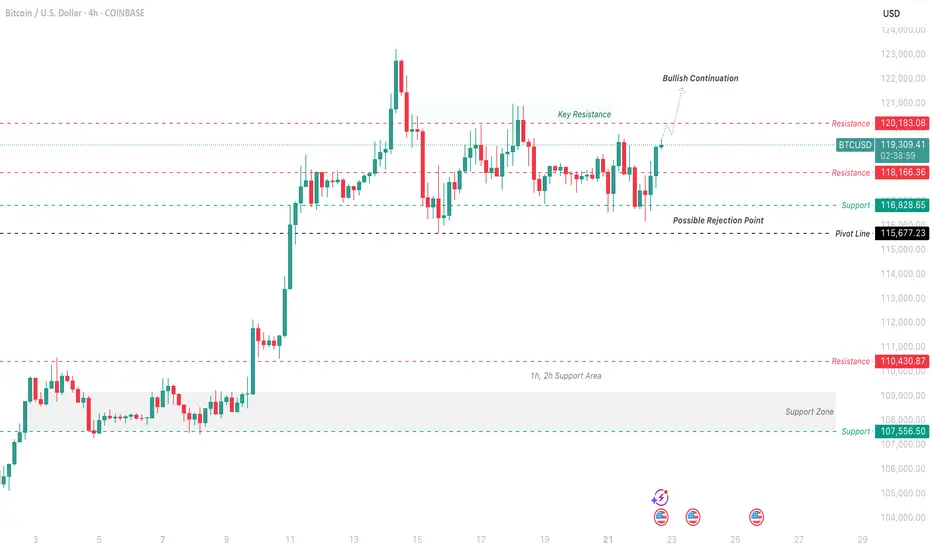
Bitcoin Price Analysis and Bullish Continuation PredictionThis analysis focuses on the Bitcoin/US Dollar 4-hour chart from Coinbase, highlighting a potential bullish continuation based on recent price action as of July 22, 2025. The chart shows a strong upward trend with a recent pullback, suggesting a possible rejection point near the pivot line at $115,672.23.
Putting myself in the reader’s shoes, I’d want to understand the key levels driving this prediction. The 1-hour and 2-hour support area around $107,656.23 has held firm, providing a solid base. The price recently approached the key resistance at $120,183.08, where it faced rejection, indicating a potential ceiling. If the price breaks above this resistance with strong volume, it could signal a continuation toward $123,000.00 or higher.
My thought process involves identifying the pivot point ($115,672.23) as a critical level. A bounce from this level, supported by the 1h/2h support zone, suggests bullish momentum. However, if the price fails to hold above $115,672.23 and drops below $107,656.23, it could invalidate this outlook, pointing to a deeper correction.
Profit Targets:
Short-term: $120,183.08 (key resistance)
Long-term: $123,000.00 (bullish continuation)
Stop Loss: $107,656.23 (below the 1h/2h support area)
These clearly defined targets and stop loss levels should help clarify the trade idea and manage risk effectively.
BuyRejection Level
Daily Volume
Market Structure Shift
London Session
Trend Line Break
Untapped Order Point
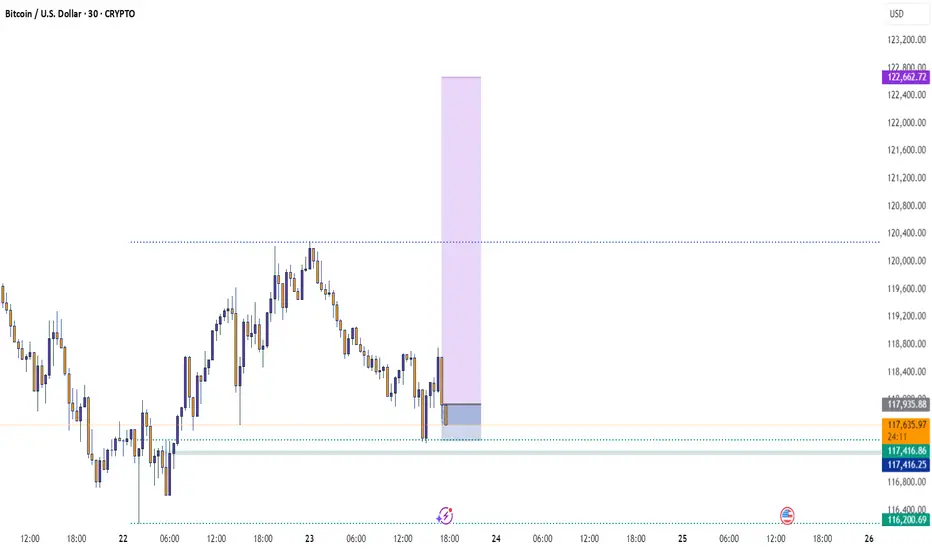
BTCUSD Analysis is Ready BTC/USD 30-min chart shows a potential bounce from the support zone around 116,187.5, aiming for a bullish move toward the target at 121,640.6. Price may retrace before pushing upward.

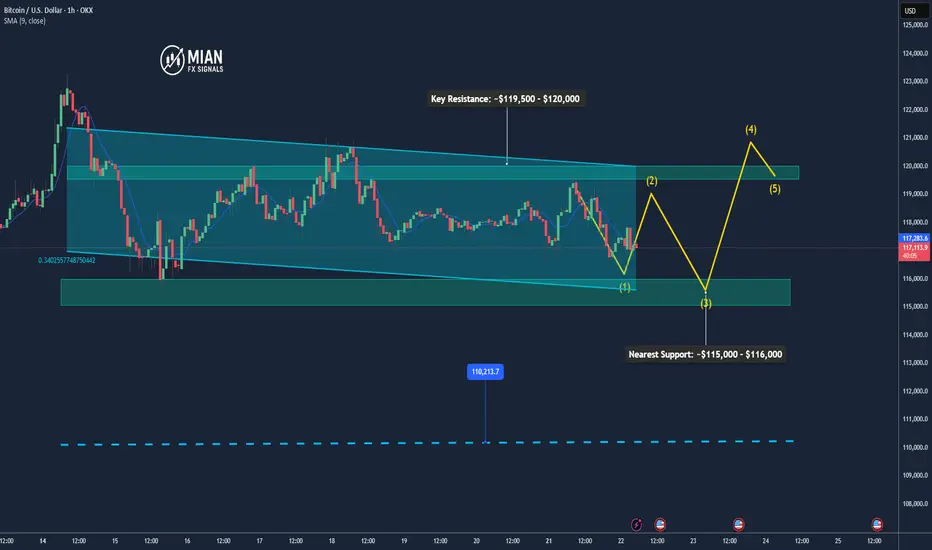
Bitcoin May Pull Back Slightly Before Resuming Uptrend📊 Market Overview
• Bitcoin is currently trading around $116,934, slightly down after hitting an intraday high of $119,524.
• The earlier rally was supported by inflows into Bitcoin ETFs, accumulation by major holders like Trump Media and MicroStrategy, and a pro-crypto regulatory stance in the U.S. (e.g., Genius Act, CLARITY Act).
• However, a surge in whale transfers to exchanges and declining BTC dominance suggests profit-taking and potential short-term volatility.
📉 Technical Analysis
• Key Resistance: ~$119,500 – $120,000 (intraday high and recent ATH)
• Nearest Support: ~$115,000 – $116,000, then $110,000
• EMA 09/20: Price is hovering around EMA 9/20 on H1–H4 timeframes, indicating a short-term uptrend but needing a pause or correction.
• Momentum / Volume: RSI is near overbought territory; falling volume hints at consolidation or a mild pullback. The overall trend remains bullish but slightly unstable.
📌 Opinion
Bitcoin is likely to pull back slightly in the short term toward the $115,000 – $116,000 zone due to profit-taking pressure, before potentially resuming the uptrend if it can break and hold above $119,500 – $120,000 with strong volume.
💡 Trade Setup
SELL BTC/USD at: $118,500 – $119,000
🎯 TP: $116,500
❌ SL: $120,000
BUY BTC/USD at: $115,000 – $116,000
🎯 TP: $118,500 – $119,500
❌ SL: $114,000
btc . july . w4 . d3 yesterday was beautiful. dOpen was vorhersehbar. wednesday brings liquidity. the chart might not look like much, but i see movement coming. resistance is obvious, price target is violent.

BITCOIN BREAKOUT IMMINENT (120K)The Trend is your Friend. Bitcoin’s current action is the kind of bull‐market digestion you want to see before the next big surge. We’ve powered up from roughly $50 K on the Trump‐election narrative to flirt with all‐time‐high territory around $112 K, and now we’re simply consolidating in a tight $100 K–$110 K range. What really grabs my attention is how volume has dried up inside that band: fewer sellers stepping up means less fuel for a deep pullback, and an ebb in liquidity often precedes the kind of compressed buildup that launches a sharp move. That liquidity squeeze tells me smart money is biding its time rather than panicking out, and that sets the stage for a clean breakout once a new catalyst arrives.
Technically, the setup could hardly be neater. The 10-, 21- and 50-period moving averages have converged, running almost in lockstep. When those averages come together like train tracks, it signals a market in “healthy pause” — neither exhausted by an overextended rally nor capitulating under bearish pressure. It’s the kind of feature you love to see: price has had its run, it’s caught its breath, and it’s ready to go again on fresh conviction. Meanwhile, the RSI sits squarely in the middle of its range, neither overbought nor oversold, meaning there’s plenty of room for buyers to step in without an immediate pullback risk from extreme readings. In other words, momentum indicators are calm, not frothy or fearful, which further supports the case for a measured upward thrust rather than a sudden crash.
On the macro side, fundamentals are lining up, too. Monthly passive inflows into Bitcoin ETPs and ETFs continue at a robust clip, with institutions quietly adding to their positions out of the spotlight. If the Fed pivots toward rate cuts later this year, capital that’s been chasing yield elsewhere could flow back into risk assets — and Bitcoin, with its “digital gold” narrative, stands to gain especially when you consider its roughly $2 trillion market cap versus gold’s $20 trillion. That leaves a lot of upside potential if institutional demand keeps accelerating. Even more compelling: real‐world use cases for blockchain—everything from proof‐of‐ownership to decentralized finance—continue to mature behind the scenes, reinforcing Bitcoin’s narrative as not just a speculative asset, but a foundational piece of tomorrow’s financial system.
Of course, we can’t ignore the risks. We’ve already seen Bitcoin price near $112 K once, and there’s always the chance it carves a frustrating double-top if it stalls again. External narratives—Middle‐East tensions, renewed Ukraine tensions, fresh tariff skirmishes—could throw cold water on the rally and trigger a quick sell-off. But given the current setup—low‐volume consolidation, converging moving averages, balanced RSI and steady capital flows—a 10 % push toward $120 K feels not just possible but probable. Keep your eye on $112 K as your breakout trigger, size your positions sensibly, and plan your stop-loss around the lower end of the range. If Bitcoin can clear that level on strong volume, we’re likely to see this bull market extend rather than roll over into a double-top scenario. Happy trading, stay disciplined, and let’s see where this market takes us next!

BITCOIN Accumulation Phase almost completed. Higher from here?Bitcoin (BTCUSD) is making a strong rebound on the bottom of its 1-month Channel Up and this analysis is in direct response to the one we published last week (July 15, see chart below), where we called this one-week consolidation:
We won't be going into too much detail then, as you can see the price made the Accumulation 2 Phase, after an identical +25.9% Bullish Leg, same as April's and by breaking below the 4H MA50 (blue trend-line), it hit the 0.236 Fibonacci retracement level.
As per the May 05 fractal hit, as long as the 4H MA100 (green trend-line) supports this Channel Up, the market should start Bullish Leg 3 towards Accumulation Phase 3 and eventually peak at around +43% from its start at $140000.
Do you think the pattern will continue to be repeated in the exact same order? Feel free to let us know in the comments section below!
-------------------------------------------------------------------------------
** Please LIKE 👍, FOLLOW ✅, SHARE 🙌 and COMMENT ✍ if you enjoy this idea! Also share your ideas and charts in the comments section below! This is best way to keep it relevant, support us, keep the content here free and allow the idea to reach as many people as possible. **
-------------------------------------------------------------------------------
💸💸💸💸💸💸
👇 👇 👇 👇 👇 👇

BTC Bulls Defend Key Zone Eyes on $123K Breakout ExtensionBitcoin has successfully completed a breakout above the prior weekly high structure, followed by a healthy pullback which is currently unfolding into a bullish pennant formation. The key highlight is how price is retesting the neckline zone with precision, which now doubles as a strong immediate buyback zone.
The reaction from this level is already showing strong bullish momentum, with price gearing up to challenge the previous ATH. A breakout above that resistance should unlock the path toward the projected $116.5k and $123.4k targets as shown on the chart. Failure to hold the Immediate Buyback Zone opens the door toward the Strong Demand Zone, which remains a valid re-accumulation point within this bullish cycle.
Stay sharp. The structure remains intact unless the neckline fails decisively.

StairsteppingBitcoin ready for another breakout. If this is anything like previous cycles, likely see a 3-4 month uptrend that goes parabolic and off this screen.
Macro + regulatory tailwinds
BTCUSDBUY Call retest must
Quick trade setup 30min
Risk free your trade once reach point metioned
Looks bullish move

Bitcoin profit booking at this Price level 119675 Bitcoin is making higher high and giving flag fathernow in a range bound zone due to profit booking and and Here we may take a short trade sell 119500, sl-121800, tgt 1108500, 99500🚩🚩
