BTC IDEAConfluence of Weekly FVG and Daily EBP (Engulfing Bar Play), entry on 4 hour when order block formed (defined by series of red down candles on 4 hour time-frame). Target 1:3 risk reward.
BTCUSD trade ideas

BBTCUSD long setupBTCUSD long setup
Entry - 111900.0
Stop Loss - 110670.0
Target - 123120.0
Risk Reward - 1:9.12


Bitcoin Range for August?Historically August has been a tough month for crypto in the past with mostly flat to negative returns. For that reason, although not a perfect science, I would not be surprised if we see a rangebound environment continuation for BTC.
So what would that look like? Structurally there are three thirds to the range, currently price is looking to break through into the upper third after bouncing off the bottom third bullish orderblock.
Trade setups will naturally present themselves as rotational plays both bullish and bearish at the extremes of each of the thirds but much larger trades from the range top and bottom.
Altcoins are lagging behind BTC structurally so where BTC has been choppy for a few weeks, most large cap alts have hit their highs and are now looking to settle into a range before the next leg up.

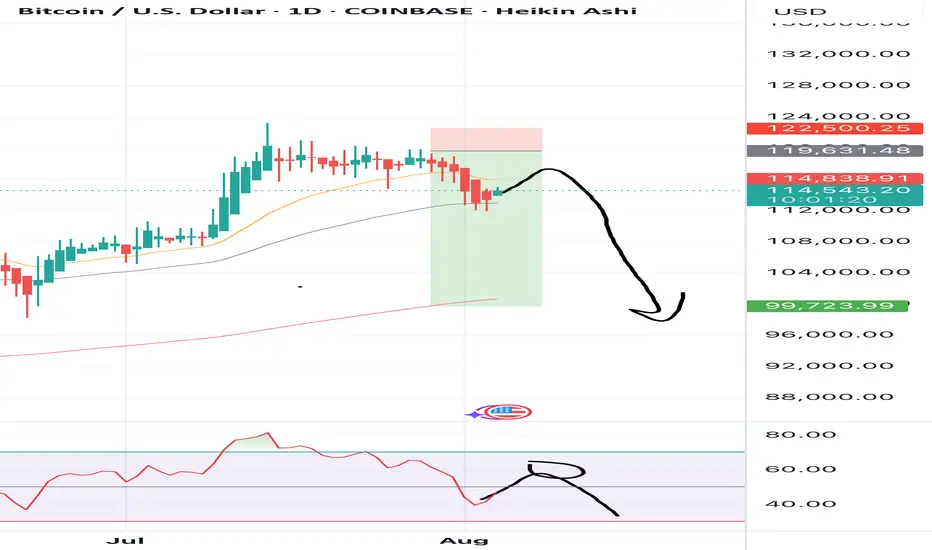
Bitcoin confirmation of a pull back before the sell pressure Confirmation of a pull back before the sell pressure ..... so we are to hold all our sell positions
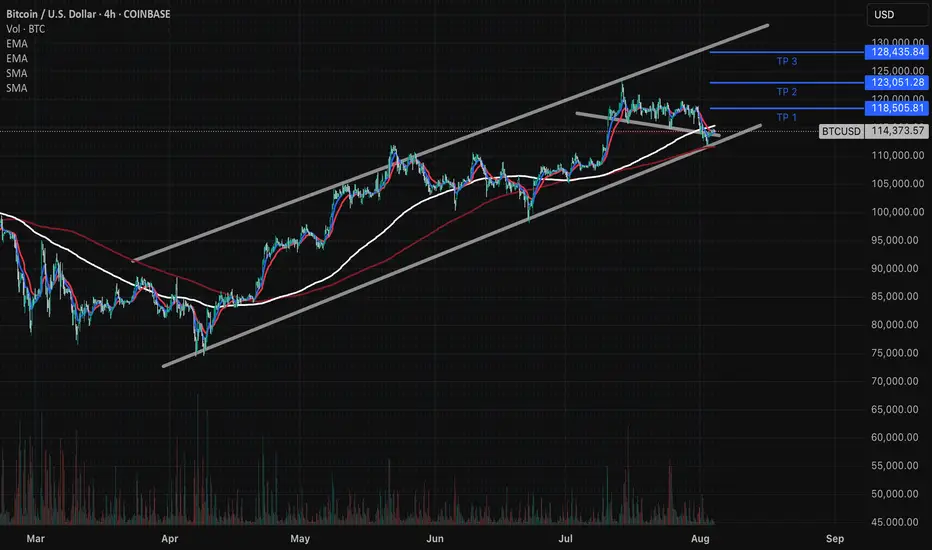
Bitcoin Ascending Channel Analysis - WAIT FOR CONFIRMATIONS!Bitcoin continues its methodical progression within a well-defined ascending channel, currently trading at $114,393. The price action demonstrates textbook technical behavior, respecting both the upper and lower channel boundaries with precision.
Key Technical Observations
Channel Dynamics : The ascending channel pattern remains intact since March lows, with multiple successful tests of support around the lower trendline. Current positioning near channel midpoint suggests balanced momentum.
Moving Average Confluence : Price is trading above all major EMAs (114,262 and 114,521), indicating sustained bullish sentiment. The tight clustering of these averages suggests consolidation before the next directional move.
Volume Profile : Recent volume patterns show institutional accumulation during pullbacks, with lighter volume on advances - typical of healthy uptrends in mature phases.
Strategic Levels
Immediate Resistance: $116,500-$117,000 zone (upper channel boundary)
Key Support: $110,000-$111,000 (lower channel confluence with EMA cluster)
Breakout Target: $125,000+ (measured move projection)
Risk Assessment
The current technical setup presents a favorable risk-reward profile for position traders. However, proximity to channel resistance warrants cautious position sizing. A break below $110,000 would invalidate the ascending channel thesis and signal deeper retracement potential toward $105,000.
Probability Matrix :
Channel continuation: 65%
Upside breakout: 25%
Channel breakdown: 10%
Trade Management Framework
For swing positions, consider scaling approaches near channel extremes. Risk management remains paramount - the crypto market's inherent volatility can quickly invalidate technical patterns despite their statistical reliability.
DISCLAIMER: This analysis is for educational and informational purposes only and does not constitute financial advice. Cryptocurrency trading involves substantial risk of loss and is not suitable for all investors. Past performance does not guarantee future results. Always conduct your own research and consider your risk tolerance before making investment decisions. The author may hold positions in the discussed assets.
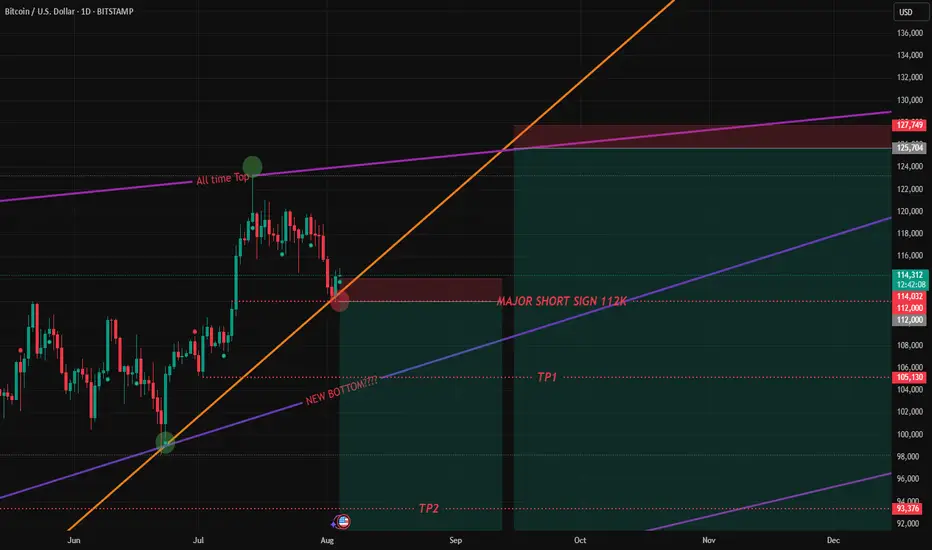
BTC over viewOn BTC 1D chart, we can easily see things started when WW3 news related hovering around. Shows on chart is the most likely SHORT scenario with all major marks. If Btc keep pumping up to 116k, I'll wait it until 125k (at the All time Top mark) to hit another Short on the list.
BTCUSD: Consolidating at $112K, Watching $120KInstrument: BTCUSD
Timeframe: Daily
Date: August 4, 2025
Analysis:
BTC dropped to $112,000, down 5.1% from $118,000, holding above the $112,000 support. The hawkish FOMC triggered this pullback, but $112K is a key level. I scaled in on the dip as seen in my previous BTC idea and X
Chart Setup:
Support: $112,000, $100,000
Resistance: $115,000, $120,000

BTC sounded the alarm, 115,000 became the key point#BTCUSD
Last week, as global risk sentiment deteriorated, the cryptocurrency market came under pressure, pushing BTC back from its recent highs. This correction was significant, and while BTC has subsequently rebounded, technically, the bearish divergence signaled by the daily MACD indicates weakening short-term rebound momentum. The Bollinger Bands on the 4-hour chart are trending downward, indicating that the market remains in a period of volatile correction.
If BTC cannot effectively break through the upper resistance of 115,000 in the short term, the bears may continue to exert their strength. You can consider shorting with the target at 114,000-113,000.
🚀 SELL 115,000-116,000
🚀 TP 114,000-113,000

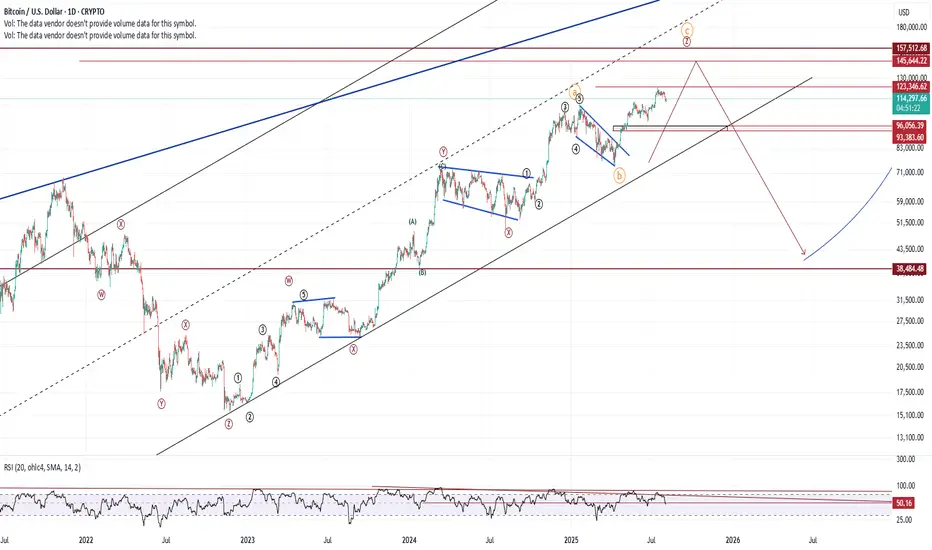
Bitcoin hits $135K before a 33% correction.Firstly... I'd like to comment we have officially just had our first daily close above "Minor Resistance" trend-line I have put in, additionally... a daily close above the 50SMA.
All trend-lines have flipped into bullish posture as well as my indicators and SMA / EMA ribbons!
📈 Price & Fibonacci Levels
Holding above key support: $104,751 (0.888 Fib)
Eyeing 1.618 Fib extension target: $139,094
Former resistance from 2021 has flipped into support, confirming breakout structure
🌊 M2 Global Liquidity Index = The Engine Behind BTC
BTC price is highly correlated with the M2 Global Liquidity Index (now at 98.91) and has been following since JAN 2024.
What is M2? It's a measure of global money supply growth. Rising M2 = more liquidity in the system = bullish for risk assets like BTC
This macro liquidity uptrend continues to support the Bitcoin rally
📉 RSI Reset, Momentum Reloading
RSI (14) is at 47.82, a neutral level historically followed by bullish continuation in uptrends
Momentum is resetting, not breaking — the trend is still intact
🧵 SMA Ribbon & Golden Cross Setup
Multi-timeframe SMA ribbon (10–500) fully supports a bullish trend
A Golden Cross (SMA 50 > 200) is already confirmed
Historically, the last 4 Golden Crosses (after a Death Cross) led to an average gain of 89% into the next local ATH
This points directly toward a $135K–$145K scenario
🌑 Lunar Timing (Historically speaking)
Most Bitcoin all-time highs occurred within ±5 days of a new moon
The next critical date: September 7, 2025 – Strong Lunar Eclipse
Historically, lunar eclipses have resulted in 30% average corrections
⚠️ This is the second eclipse in a 4-eclipse cycle — potentially stronger impact (maybe 40%, 80K territory)
Expected dip target: $90K, aligning with macro support and Fibonacci confluence
😐 Sentiment Check: Fear & Greed Index
Current reading: 52 (Neutral)
Market is not overheated
Still plenty of room before peak greed or blow-off top behavior
🔮 Final Take:
All indicators — liquidity, momentum, cycle timing, and historical averages — suggest Bitcoin is not done yet. After a possible eclipse-driven correction into the $90K region, we likely enter the final euphoric push of this macro leg toward $135K–$145K.
📅 Key Dates:
23rd August new moon top out $135K (please consider a 5 day window 18th -28th August)
Next New Moon & Lunar Eclipse: September 7, 2025
Watch for volatility, alt rotation, BTC.D
💬 Agree or disagree? Drop a comment.
🔔 Follow for lunar/RSI/fib cycle updates!
Disclaimer:
The content provided in this post is for informational and educational purposes only and should not be considered financial or investment advice. I am not a financial advisor, and this is not a recommendation to buy, sell, or hold any cryptocurrency, asset, or security. Always do your own research and consult with a qualified financial advisor before making any investment decisions. Trading and investing involve risk, and past performance does not guarantee future results.

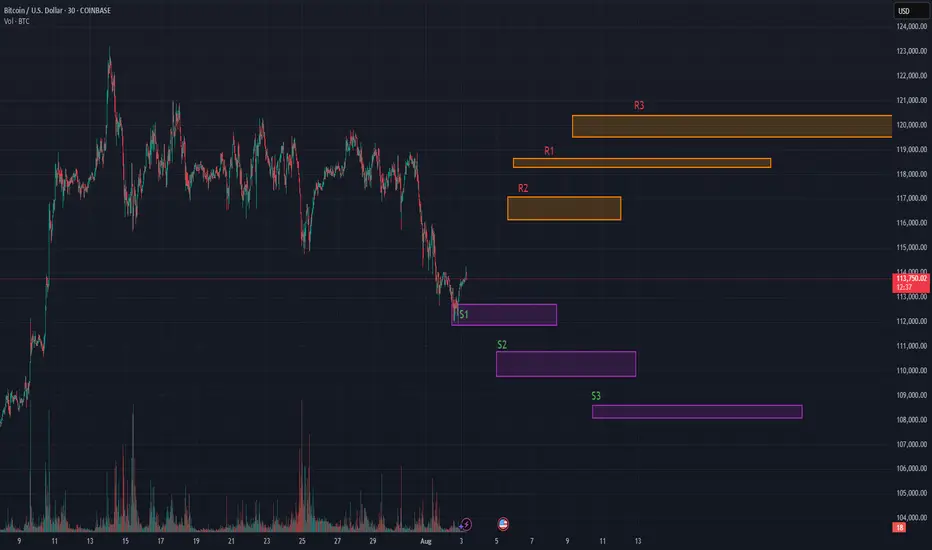
$BTC Breaking Down. Price bleeds, conviction doesn’t.Price bleeds, conviction doesn’t.
This was originally posted previously <24hrs but was hidden due to a link. Here is the pic of the original so you can see S1 bounced perfectly, lets see how much momentum we can get.
OG Thread continued..
Is this the dip worth buying?
BTC is retesting key quant support zones after a high-volume rejection near $116K. Despite the short-term dip, structure remains bullish from a mid-term lens.
• Quant Support Levels
• S1: $112,412
• S2: $110,935
• S3: $108,711
• Resistance Levels:
• R1: $116,113
• R2: $118,337
• R3: $119,814
On chain metrics:
• On-chain data confirms short-term holder capitulation into high-ownership clusters at $112K–$110K.
• Volatility contraction suggests a base-building phase, not a breakdown.
• Cup-and-handle formation remains valid on higher timeframes.
• Institutional Context:
• Accumulation increasing below $115K.
• Analysts projecting breakout potential to $129K–$133K if BTC can reclaim the $116.1K pivot.
Quant traders are eyeing this pullback as a healthy setup — not a breakdown.
I believe these are perfect accumulation levels anywhere in the blue square should be fine for a play to the upside.
Want Quant levels? Let me know!
BTC intra?
Hi,
Continuation from yesterday?
Watchout yest high to break or not. 115000
Add 2-3K to the digits
Select the best setup :) & R:R
All the best
Not a guru

REBOUND on BTCUSDBITSTAMP:BTCUSD
Wait to see how market opens and sentiment towards the weak unemployment numbers and tariffs - If positive then likely rebound to all time highs.

What If Peter Schiff Was Right About Gold and Bitcoin All Along?- Gold / Bitcoin Ratio Head and Shoulder Pattern.
- Bitcoin has been trading like a FANG stock the last 5 years
- Gold has not doubled since the 2K high 15 years ago
Play:
Long Gold and Short Bitcoin
or
Long Gold and no position on Bitcoin

BTCUSD 8/3/2025Come Tap into the mind of SnipeGoat, as he gives you a Full Top-Down Analysis of Bitcoins Price Action as we enter a new week of Qt.3 What is Price doing Right Now?? I got the answer for ya! Tune In!!!!
_SnipeGoat_
_TheeCandleReadingGURU_
#PriceAction #MarketStructure #TechnicalAnalysis #Bearish #Bullish #Bitcoin #Crypto #BTCUSD #Forex #NakedChartReader #ZEROindicators #PreciseLevels #ProperTiming #PerfectDirection #ScalpingTrader #IntradayTrader #DayTrader #SwingTrader #PositionalTrader #HighLevelTrader #MambaMentality #GodMode #UltraInstinct #TheeBibleStrategy

GOLD, BTC analysisWe saw a meaniful directional on our fav asset, after doing a thorough top down analysis, we looking to long BTC and Short Gold.

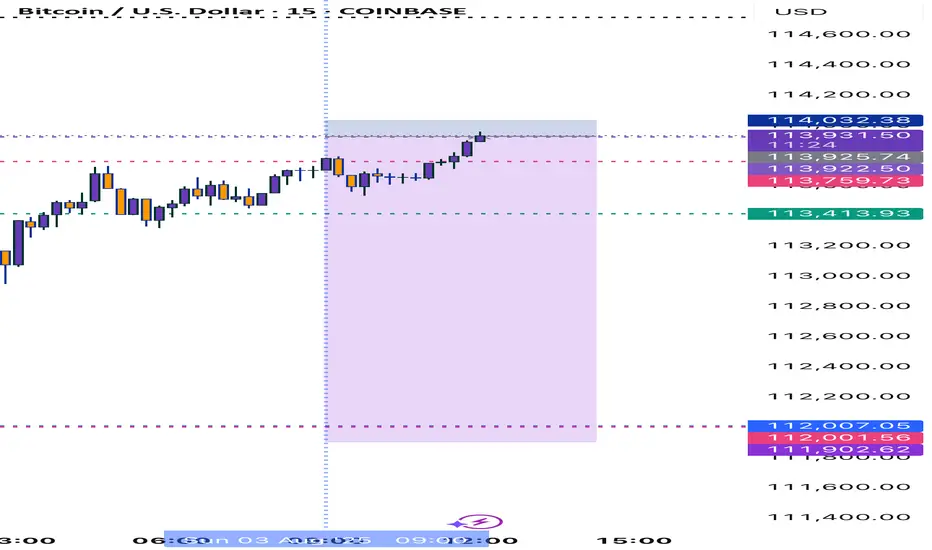
"BTC Sweeps Liquidity – Eyeing 115K Reclaim?""BTC Sweeps Liquidity – Eyeing 115K Reclaim?"
🔍 Technical Analysis – BTC/USD
On the 1H chart, Bitcoin (BTC) is currently displaying a textbook smart money structure, with price action following key institutional footprints.
🔑 Key Observations:
Liquidity Grab at Weak Low
Price dipped below the local support (~112,500), sweeping sell-side liquidity and tapping into a possible reversal zone.
Rejection from Demand Zone (Support Area)
A strong reaction occurred right at the support level, suggesting buyer interest is still present.
Order Block & Fair Value Gap
A visible Fair Value Gap (FVG) sits above current price action, aligning with an Order Block near the 115,000 level — this is a key magnet for price to rebalance.
Target Zone
Immediate upside target is 115,000, where an order block lies. If price reaches that level, expect potential short-term resistance or reversal.
Break of Structure (BOS) Confirmations
Multiple BOS and CHoCHs indicate bearish-to-bullish attempts, but the current structure still needs confirmation above 113,500+ for bullish continuation.
🧠 Conclusion & Expectation:
BTC has swept liquidity to the downside and may now seek to fill the FVG and revisit the 115K order block. However, confirmation is required — watch for bullish engulfing candles, volume spikes, or a CHoCH above 113,500.
“Smart money doesn’t chase — it waits for liquidity, then repositions. BTC may be following the same script.”

BTCUSD--Short-03-08-25--After last week, expecting price will move down further to monthly support-1 and monthly support-2

#BitcoinDate: 03-08-2025
#Bitcoin Current Price:113646
Pivot Point: 112812 Support: 111359 Resistance: 114274
Upside Targets:
🎯Target 1: 115329
🎯Target 2: 116384
🎯Target 3: 117724
🎯Target 4: 119063
Downside Targets:
🎯Target 1: 110300
🎯Target 2: 109240
🎯Target 3: 107901
🎯Target 4: 106561
#TradingView #Nifty #BankNifty #DJI #NDQ #SENSEX #DAX #USOIL #GOLD #SILVER
#BHEL #HUDCO #LT #LTF #ABB #DIXON #SIEMENS #BALKRISIND #MRF #DIVISLAB
#MARUTI #HAL #SHREECEM #JSWSTEEL #MPHASIS #NATIONALUM #BALRAMCHIN #TRIVENI
#USDINR #EURUSD #USDJPY #NIFTY_MID_SELECT
#SOLANA #ETHEREUM #BTCUSD #MATICUSDT #XRPUSDT
#Crypto #Bitcoin #BTC #CryptoTA #TradingView #PivotPoints #SupportResistance

BTC/USD Ready to Explode?Watch 116,990 & 120,160 Breakout Zones!Massive move loading on BTC!
Price is trapped in a tight consolidation zone — breakout above 120,160 = 🚀 to 130,400, while a break below 116,990 = 💀 down to 108,270.
Waiting for 2 daily candle confirmations before entering . Stay sharp — this breakout could set the next major trend.

