BTCUSD Market Breakdown – Liquidity Sweep Incoming?BTCUSD Market Breakdown – Liquidity Sweep Incoming?
🔍 Technical Analysis (July 29, 2025)
Chart Observations:
1. BOS (Break of Structure):
Multiple BOS events are identified, confirming key directional shifts in market structure. The last BOS near the support zone signals bearish intent.
2. Bearish Fair Value Gap (FVG):
A clean bearish FVG is left behind after a sharp drop on the 25th, indicating institutional imbalance and potential retracement area. Price rejected from that FVG later.
3. Equal Low & Sellside Liquidity:
The highlighted equal lows around July 25-26 mark areas of resting liquidity—prime targets for smart money manipulation.
4. New FVG Formed (July 28):
Another bearish FVG appears just before the projected breakdown, strengthening the case for a bearish continuation.
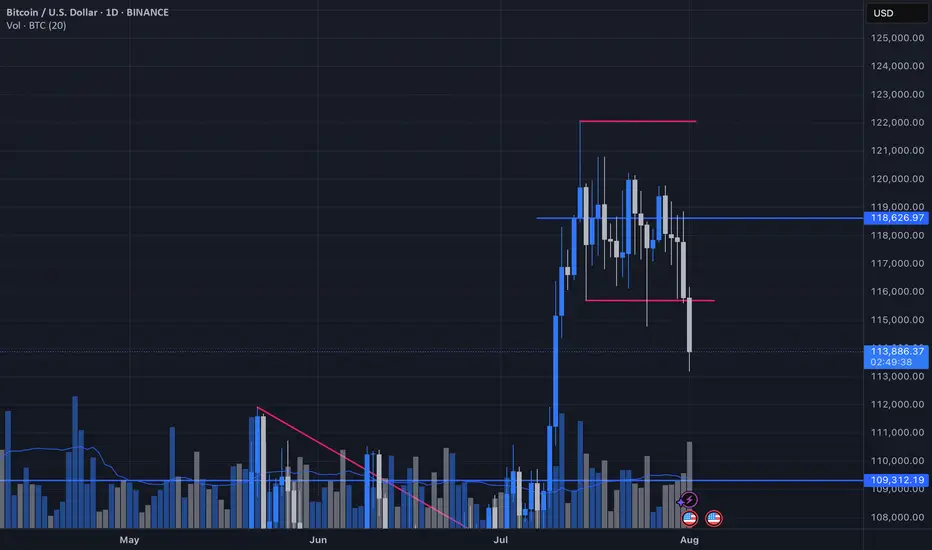
5. Support Zone Target – $115K:
A clean support zone (marked between 114,500–115,500) sits directly below the current market price. This is the likely liquidity target after sweeping equal lows.
6. Volume Profile (VRVP):
Low-volume nodes between the current price and support suggest minimal resistance to a sharp downward move.
⸻
🎯 Conclusion:
The structure, FVGs, and liquidity pools all point toward a liquidity raid below the equal lows, aiming for the support target near $115K. Traders should watch for a decisive break below the current range, especially if the FVG acts as resistance again.
BTCUSD trade ideas


BITCOIN's Situation (1h) !!!The price is within an ascending triangle, which could be encouraging. However, since crypto doesn't always follow patterns, it might break down from below and correct to around $116K!
Best regards CobraVanguard.💚

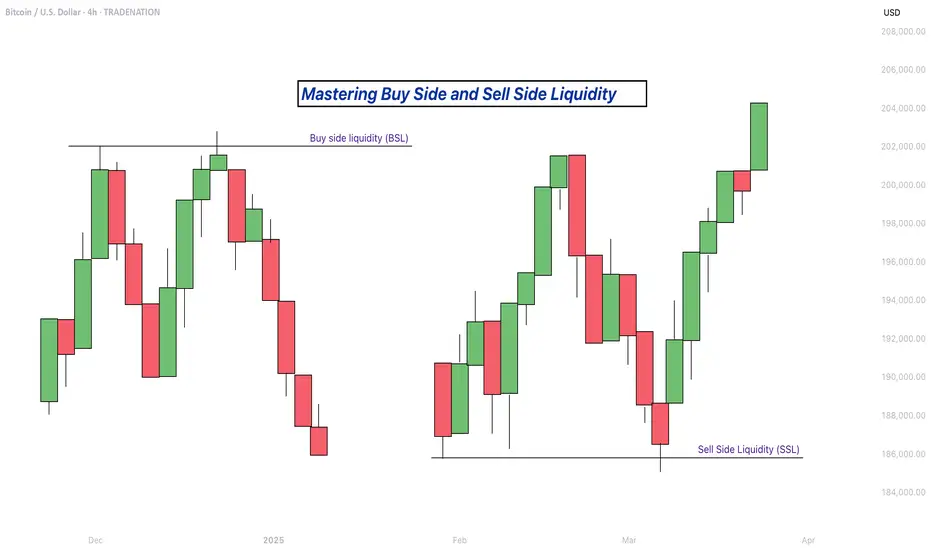
Mastering Buy Side and Sell Side Liquidity - How to trade it!In trading, understanding liquidity is one of the keys to predicting where the market might go next. The Inner Circle Trader (ICT) method teaches traders how to recognize where big players like banks and institutions are likely to enter or exit trades. Two important ideas in ICT trading are buy side liquidity and sell side liquidity. Once you understand what these terms mean and how to spot them on a chart, you can start using them to find better trading opportunities.
What will be discussed?
- What is Buy Side Liquidity?
- What is Sell Side Liquidity?
- How do you see Buy and Sell Side Liquidity?
- Examples
- How to trade BSL and SLL Liquidity?
What is Buy Side Liquidity
Buy side liquidity is found above market highs. It refers to all the stop loss orders from people who are holding short positions. When the market is going down, some traders sell (or go short) and place their stop losses above recent highs to protect themselves. These stop losses are actually buy orders because closing a short position requires buying. Big institutions know this, so they push price upward to trigger those stop losses and grab that liquidity. That’s why you’ll often see the market spike above a recent high before reversing. That spike is the market grabbing buy side liquidity.
What is Sell Side Liquidity
Sell side liquidity is the opposite. It’s found below recent lows. This is where traders who are buying (going long) place their stop losses. If someone buys a market, they’ll usually put a stop loss just below a previous low. That stop loss is a sell order. Smart money looks at these areas as pools of sell side liquidity. So when the market moves down quickly and breaks a recent low, it’s likely collecting those sell stop orders. After that, you’ll often see a reversal because the liquidity has been taken.
How do you see Buy and Sell Side Liquidity?
You can spot buy side and sell side liquidity by looking at the chart and identifying recent highs and lows where many traders might have placed stop losses. These are usually obvious swing highs and swing lows. If you look at a chart and see a clean high where price previously reversed, that’s likely where traders are placing stops. That makes it a target for buy side liquidity. Same for a recent low, if it’s a clean level where people might have bought in the past, that low probably holds sell side liquidity. The more obvious the level looks, the more likely it’s full of stops and therefore a liquidity target.
Examples
How to trade BSL and SLL Liquidity?
Trading liquidity means watching for the market to run above a recent high (to take buy side liquidity) or below a recent low (to take sell side liquidity), and then looking for signs of reversal. Once liquidity has been taken, the market often changes direction.
When you’re trading the ICT concept of liquidity, the key is not just spotting where liquidity lies, but also knowing when price is likely to reverse after that liquidity has been taken. Reversals don’t happen randomly, they leave clues on the chart. Here’s how you can recognize those signs in a simple way:
1. Market Structure Break
This is one of the clearest signs of a reversal. Let’s say the market grabs sell side liquidity by breaking below a recent low. If price then quickly starts moving up and breaks above the last lower high, that’s a break in structure. It shows that sellers are losing control and buyers are stepping in. It’s the first confirmation that the direction might be changing.
2. Rejection Wicks or Strong Candles
After price runs into liquidity (above a high or below a low), watch the candlesticks closely. If you see a long wick rejecting the level, or a strong candle in the opposite direction right after the liquidity grab, that’s a clue. It means price went there, collected the orders, and got rejected fast. That rejection shows the market might be reversing.
3. Fair Value Gaps (FVGs)
Fair value gaps are small “windows” left in price when it moves quickly in one direction. After liquidity is taken and price starts reversing, it often leaves an FVG behind. If price pulls back into that gap and holds, that can be a great entry point. FVGs act like magnets and support zones in ICT.
4. Displacement
Displacement is a strong, impulsive move that breaks structure. It usually happens right after liquidity is taken. If price moves very fast in the opposite direction after hitting a liquidity level, that’s a good sign smart money is behind the move and it’s not just random noise. That strong push is a hint that a new trend might be forming.
5. Change in Character (CHOCH)
This is a shift in how the market behaves. For example, price might be making lower highs and lower lows (a bearish trend), but after liquidity is taken, it suddenly starts making higher highs and higher lows. That change in character tells you the trend might be reversing.
-------------------------
Disclosure: I am part of Trade Nation's Influencer program and receive a monthly fee for using their TradingView charts in my analysis.
Thanks for your support. If you enjoyed this analysis, make sure to follow me so you don't miss the next one. And if you found it helpful, feel free to drop a like 👍 and leave a comment 💬, I’d love to hear your thoughts!
BTC Double BottomFibonacci sequence is a mathematical concept; it appears in various aspects of everyday life and nature. It's not directly used in a calculated way, but its principles are reflected in the patterns we see around us. Its key for traders to pinpoint these reversal areas to keep a positive risk/reward ratio. Bulls will target 116k if this low can be sustained.

Realized Price / 200 SMAThe realized price has crossed above the 200 SMA. The last time that this happened was November 2020. BTC then went on a tear in the following 90 days gaining 212%. Even if BTC gains only 50% of that 212% this time we will see the BTC price hit 250k.
We aren't bullish enough.
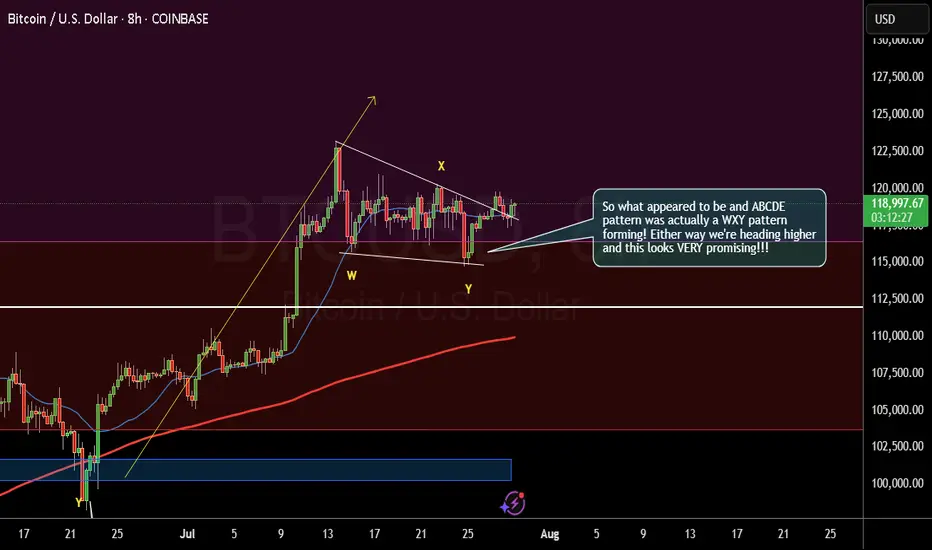
Different Pattern, Same result - Exploding higher!So what appeared to be and ABCDE
pattern a few days ago was actually a WXY pattern
forming! Either way we're heading higher
and this looks VERY promising!!!
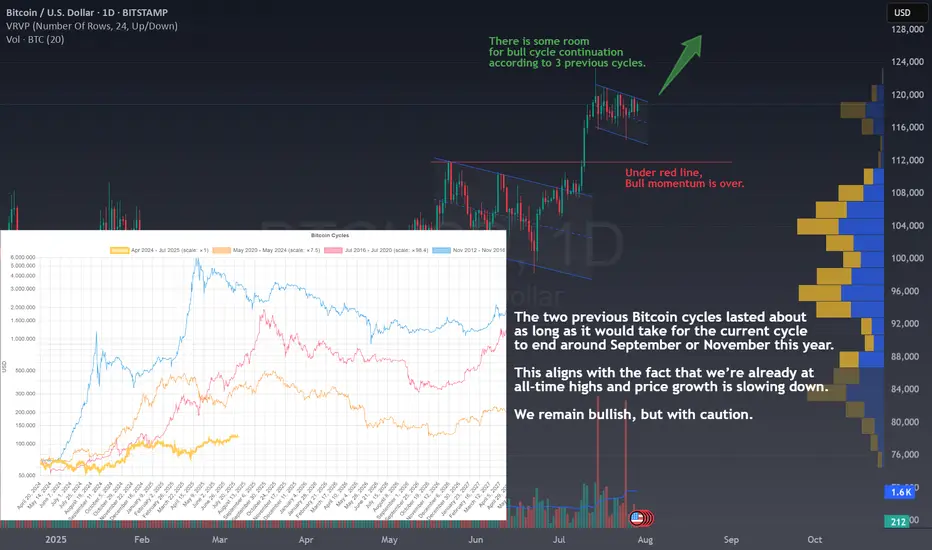
Bitcoin’s Bull Run: Is There Still Fuel in the Tank?Bitcoin has had an impressive year, breaking out of a downward channel and launching into a strong upward rally as we saw in the previous idea .
But now, price action is slowing, and many are asking: Is the bull run over or just taking a breather?
Let’s look at what the chart tells us.
📈 A Classic Bull Flag in the Making
After the breakout, BTC seems to be forming another channel or what traders often call a bull flag . This is typically a bullish continuation pattern , meaning that after a short consolidation, price may break upward again.
But that’s the technical side. What about the big picture?
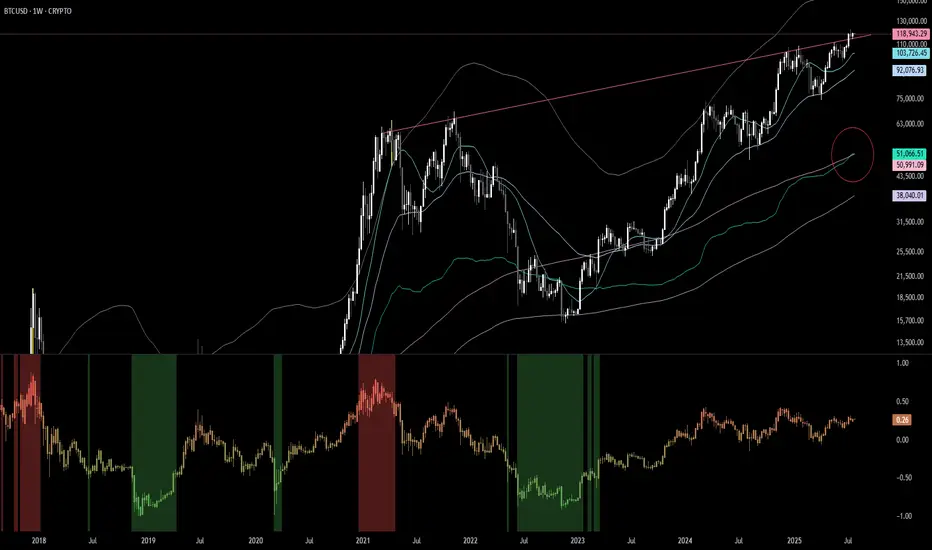
🔁 Bitcoin Cycles: History Rhymes
In the chart below the price, we see a comparison of Bitcoin’s last two cycles (shown in red and orange). Interestingly, both of those cycles point to end between September and November this year.
If history repeats, or at least rhymes, the current cycle could follow the same timeline. That gives us a few more months of potential upside before this bull run starts cooling off.
Note that the first cycle peaked faster, but also had a mini bull momentum in the same zone where the next cycles peaked.
⚠️ Still Bullish, But Watch Your Step
Even though we’re near all-time highs and price is showing signs of slowing, there may still be room for growth. However, the risk is increasing, so this is a time to stay bullish but with extra caution.
A key level to watch is marked in red on the chart. Falling below it could mean the bull momentum is fading. The reason is quite simple, a bull rally can't trade inside prices of previous consolidation phases because that means lateral or bear momentum.
🧠 Final Thoughts
Bitcoin has a history of repeating patterns, and right now, we seem to be tracking closely to previous cycles. With a potential breakout forming and a few months left on the clock, there could still be opportunities ahead.
But don’t forget: every cycle ends. Stay alert, manage risk, and don’t chase green candles blindly.
💬 Does this setup align with your view on BITSTAMP:BTCUSD ?
🚀 Hit the rocket if this helped you spot the opportunity and follow for more clean, educational trade ideas!
BTCUSD 8/1/2025Come Tap into the mind of SnipeGoat as he gives you a Full Top-Down Analysis of Bitcoins Price Action as we come into the month of August. What is Price doing? Where is Price going? Come get the answer here!
_SnipeGoat_
_TheeCandleReadingGURU_
#PriceAction #MarketStructure #TechnicalAnalysis #Bearish #Bullish #Bitcoin #Crypto #BTCUSD #Forex #NakedChartReader #ZEROindicators #PreciseLevels #ProperTiming #PerfectDirection #ScalpingTrader #IntradayTrader #DayTrader #SwingTrader #PositionalTrader #HighLevelTrader #MambaMentality #GodMode #UltraInstinct #TheeBibleStrategy

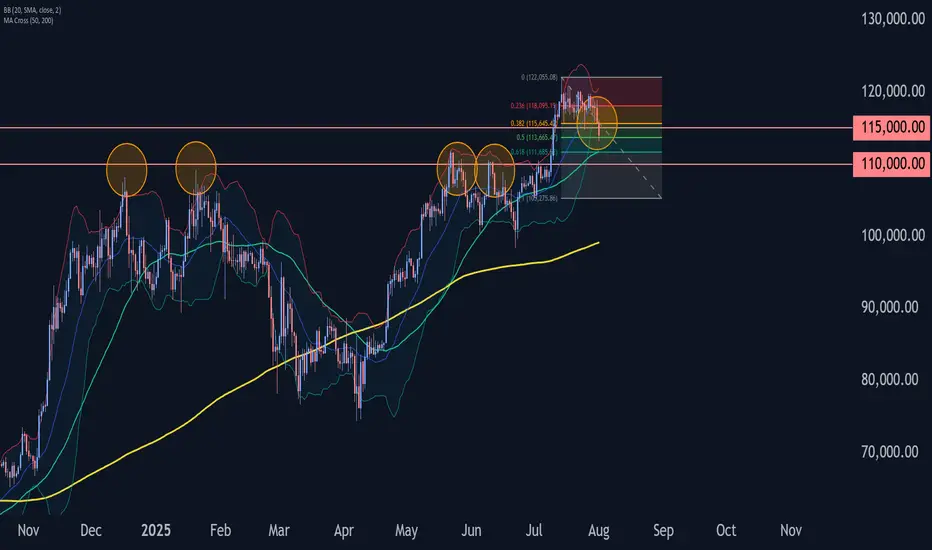
Bitcoin Wave Analysis – 1 August 2025- Bitcoin broke the pivotal support level 115000.00
- Likely to fall to support level 110000.00
Bitcoin cryptocurrency recently broke below the pivotal support level 115000.00, coinciding with the 50% Fibonacci correction of the sharp upward impulse from the start of July.
The breakout of the support level 115000.00 strengthened the bearish pressure on Bitcoin.
Given the bearish sentiment seen across the cryptocurrency markets today, Bitcoin can be expected to fall to the next support level at 110000.00 (former resistance from May and June).
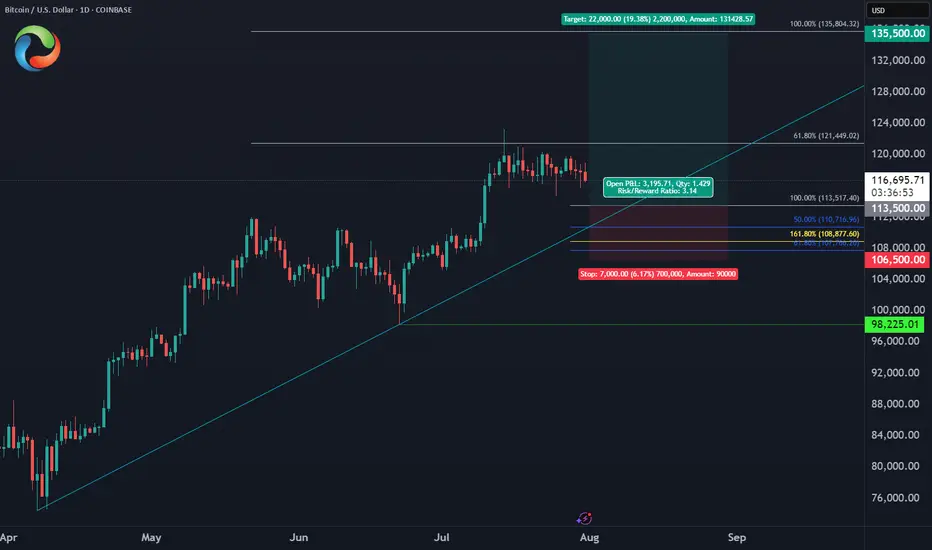
Bitcoin August Trade PlanBINANCE:BTCUSD
✅Entry Zone: $113,500 - $110,700
⛔️Stop: $106,500 (below June low)
🎯Target: $135,500 (ATH liquidity)
🔖Risk/Reward: 1:3
BULLISH BTC - Potential Inverted head and shoulders forming Potential breakout to $119 to $124,000 - Look for volume and support at $116 to $117,000. Breakout above $118,500 will confirm formation.

BTCUSD – Descending Channel or Bullish Flag?BINANCE:BTCUSDT – Market Maker’s Game Inside a Descending Channel
Timeframe: 2H | MJTrading View
Market Structure Overview:
Bitcoin recently printed a new ATH at $122,000 after a parabolic run from the previous ATH at $111,937.
Since then, price has been consolidating inside a descending channel, which could act as a bullish flag in higher timeframes.
Liquidity pools are clearly formed:
Above $122K – resting stops of late shorts.
Below $115K–$114K – weak long stops and untapped demand near the Order Block (OB).
Key Levels & Liquidity Zones:
Upside:
$122K Liquidity Pool → If swept, could trigger momentum towards $124K–$125K.
Downside:
$116K OB → First defensive zone for bulls.
$112K Strong Support → Aligns with previous ATH breakout base.
Market Maker’s Dilemma:
If you were a market maker… which liquidity pool would you hunt first?
Price is coiling tighter within the channel, and both scenarios are possible:
Upside Sweep → Rapid breakout above $122K to clear shorts, then potential continuation.
Downside Sweep → Sharp drop into $116K–$112K liquidity, flushing longs before any recovery.
⚡ MJTrading Insight:
This is the classic market maker compression – first sweep likely determines direction.
Patience here is key; let the liquidity tell the story.
#BTCUSD #Bitcoin #Liquidity #SmartMoney #PriceAction #MJTrading #ChartDesigner #CryptoAnalysis
Psychology Always Matters:

BTCUSD – bullish momentum is backBitcoin is making a strong comeback, breaking above short-term resistance and reestablishing its uptrend after a prolonged consolidation phase. The technical structure now shows clear control from the bulls, with higher highs and higher lows beginning to form.
Positive risk sentiment and growing expectations of capital flowing back into the crypto space—especially after a series of weak U.S. economic data—are fueling the current BTCUSD rally. If momentum holds, the next target could be the upper boundary of the price channel.
Keep an eye on how price reacts at key levels and trendlines — this might be the launchpad for the next bullish leg.
Good luck, and if you enjoyed this analysis, don’t forget to hit like and drop a comment!


Bullish movementBitcoin has formed a falling wedge pattern, the retest as already happened with two candles already closing and the third one currently forming.
There is a possibility that it can form another retest before finally moving upwards and this would be the time to enter a buy position (119.223) and ride the move upwards all the way to 131.350
Alternatively one can wait to see whether price will move upwards and respect the resistance level and move downwards for a sell.

Bitcoin - The cycles are playing out!⚔️Bitcoin ( CRYPTO:BTCUSD ) just repeats another cycle:
🔎Analysis summary:
Following all of the previous all time high breakouts, Bitcoin will now further extend the rally. After some simple calculation, we can see that Bitcoin will rally another +50% in order to reach the overall price target. However there will be volatility along the way so make sure to remain calm.
📝Levels to watch:
$200.000
SwingTraderPhil
SwingTrading.Simplified. | Investing.Simplified. | #LONGTERMVISION

Adding to our first bitcoin sell position now We are adding to our first sell position on bitcoin because we are to see more sell off from here

WAIT FOR A TRIPLE CONFIRMATION AND CAPITALIZE ON THE TARIFFS
Analysis and Prediction by DunnInvesting
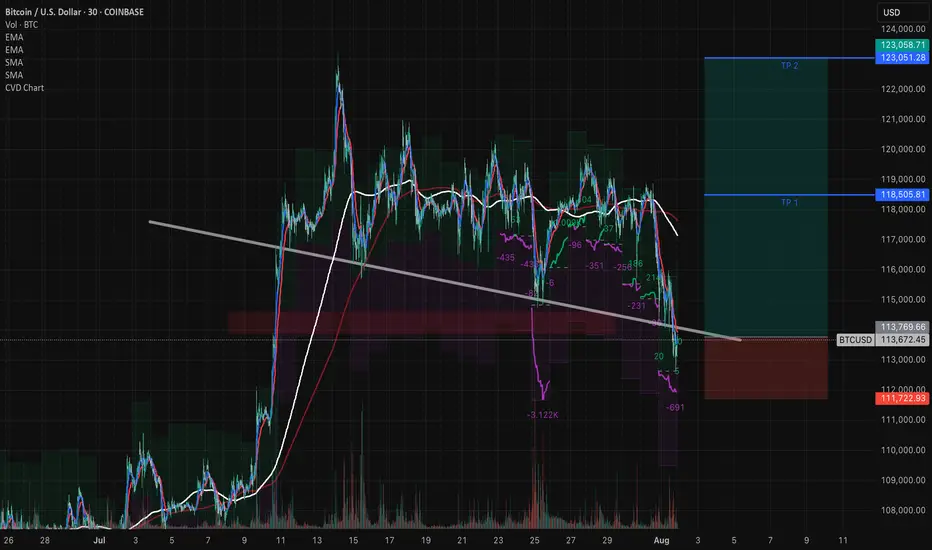
Market Overview
The BTCUSD chart on a 1-hour timeframe shows a recent consolidation phase following a sharp decline. Key technical indicators suggest a potential reversal or continuation pattern. The price is approaching a critical support zone around $113,792.86, with a descending trendline acting as resistance.
Thought Process
Support Zone Identification: The $113,792.86 level aligns with a historical support zone and the 50-period EMA, indicating a strong area for potential buying interest.
Trendline Resistance: The descending trendline has capped recent upward movements. A break above this level could signal a bullish reversal.
Triple Confirmation: Wait for three confirmations:
A bullish candlestick pattern (e.g., engulfing candle) at the support zone.
A break above the trendline with increased volume.
A retest of the trendline as new support.
This setup offers a clear entry point with defined risk below the support zone, making it understandable and actionable.
Trade Plan
Entry: $114,500 after triple confirmation.
Take Profit 1 (TP1): $118,505 (4.5% gain).
Take Profit 2 (TP2): $123,051 (7.5% gain).
Stop Loss: $112,000 (below support, ~2.2% risk).
Risk-Reward Ratio: 1:2.04 (TP1) and 1:3.41 (TP2).
Profit Targets and Stop Loss
TP1 at $118,505 targets a conservative 4.5% move.
TP2 at $123,051 aims for a more ambitious 7.5% upside.
Stop loss at $112,000 protects against a breakdown below support.
Clarifying Notes
This idea leverages the current market uncertainty around tariffs, which could drive volatility and create trading opportunities. Monitor volume and news closely for validation.
Disclaimer
This is not financial advice. Trading involves risk, and you should only trade with capital you can afford to lose. Consult a financial advisor before making any trading decisions.
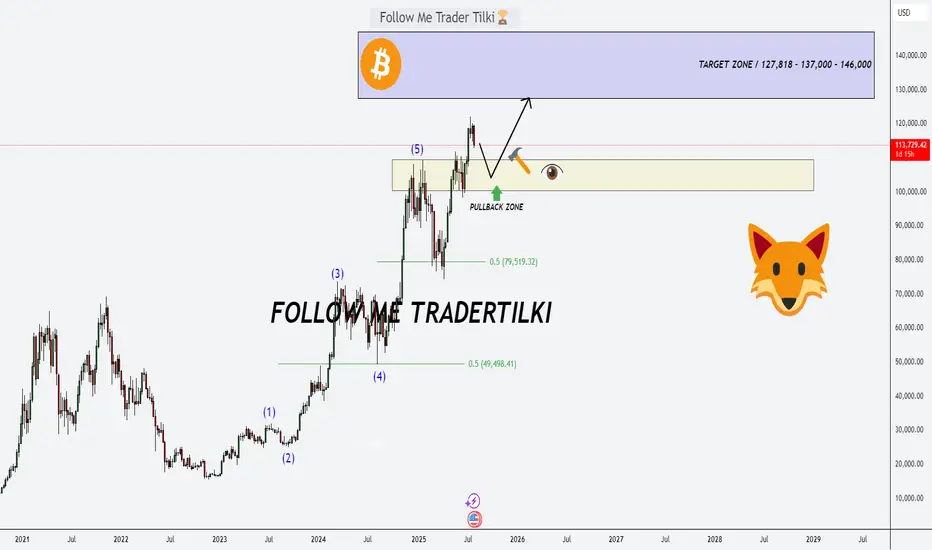
Bitcoin’s Game Has Changed: Fresh Support Zone, Targets Sky-HighHey Dear Friends,
Until recently, Bitcoin had been stuck in a range between 112,331 and 105,344 for quite some time. But that range has now been clearly broken. So, what does this mean? This zone, which used to act as resistance, is now expected to flip and act as support.
According to my weekly trading model, the long-term target levels I’m tracking for Bitcoin are: 127,818 – 137,000 – 146,000.
Since this is a weekly setup, it might take a while for these targets to play out. Even if we see pullbacks to the 112K, 105K, or even 100K levels, I expect to see strong buying pressure from that zone.
I’ll keep sharing regular updates as this setup develops.
To everyone who’s been supporting and appreciating my work—thank you, truly. Your encouragement means the world to me and keeps me motivated to keep showing up. Much love to all of you—I’m grateful we’re in this journey together.
BTCUSD long my predict up to 128100
long possible entry 115150
take profit 128100
stop loss 113000
swing long

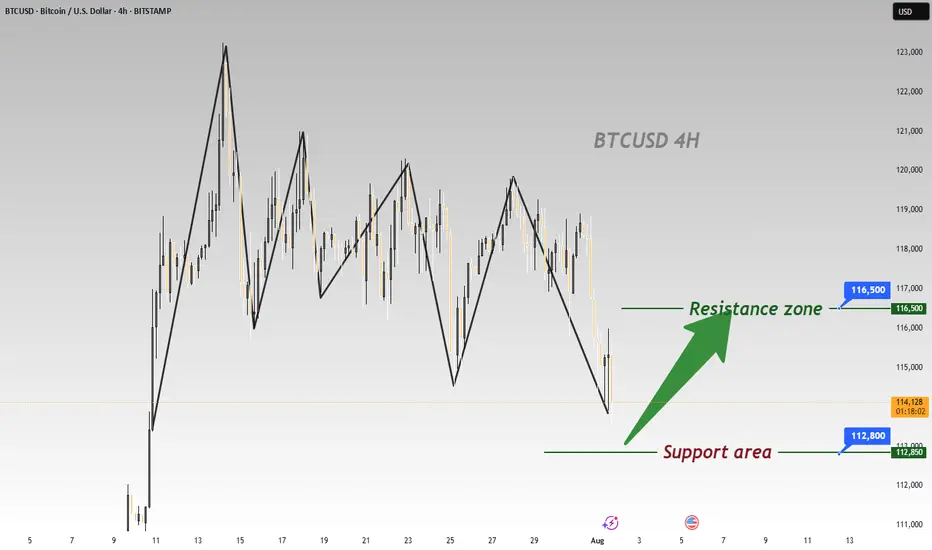
BTC Plummets Post-NFP; Go Long for Rebound to 116500BTC has plummeted significantly under the influence of the non-farm payroll data 📉, and now is an excellent opportunity to go long. Its Support level is around 112800, and according to the current trend, we can wait for a rebound to around 116500.
⚡️⚡️⚡️ BTCUSD ⚡️⚡️⚡️
🚀 Buy@ 113000 - 113800
🚀 TP 114500 - 115500 - 116500
Daily updates bring you precise trading signals 📊 When you hit a snag in trading, these signals stand as your trustworthy compass 🧭 Don’t hesitate to take a look—sincerely hoping they’ll be a huge help to you 🌟 👇
Bitcoin Range Broken?Most likely this range is broken and everybody is right, we chop around/head down... However the daily has not closed so I wonder, what would you do if three hours from now this closes above the $115,700 area?