BTCUSD trade ideas

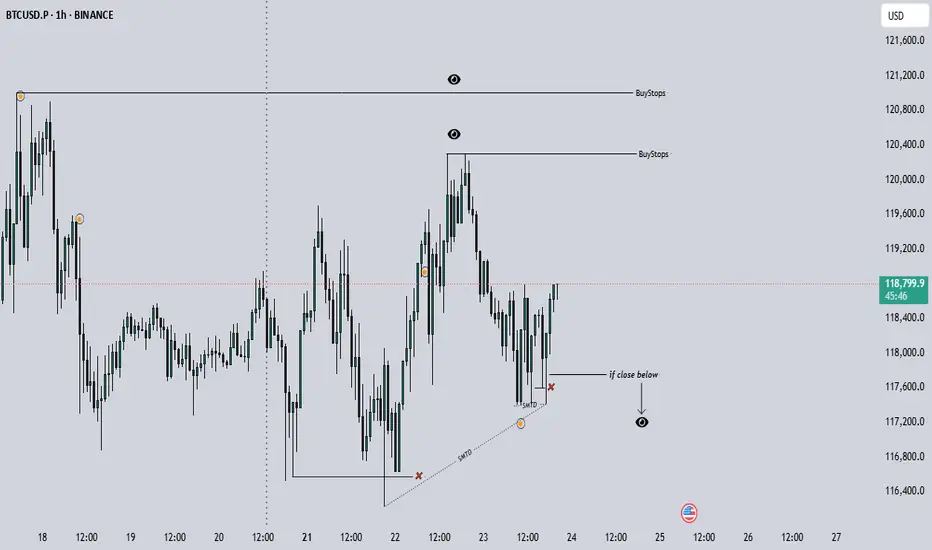
Bitcoin longs | Unemployment claims + PMI news release.Im looking for a distribution to 120289.8 & 120983.3 tomorrow whit 8.30 - 9.45 news release.
Invalidation point for the idea is a close below 117733.2
BITCOINBitcoin is showing strong bullish structure, with buyers stepping in at key support and price pushing higher with momentum. Market sentiment remains positive, and the uptrend looks ready to continue if current levels hold.

BTC to $1,000,000 by End of 2025? 📈 BTC to $1,000,000 by End of 2025? Here's a Macro View No One’s Charting Yet
While most are targeting $100K–$250K, this model suggests $1M BTC is possible — briefly — before global markets adjust.
🔎 Why?
Post-halving supply crunch is just starting to kick in
Sovereign wealth funds may rotate out of gold quietly
AI-run financial systems could hard-code BTC as a digital reserve
Institutional ETF demand hasn’t peaked — it’s still forming a base
🧠 The Twist:
If Bitcoin hits $1M, it won’t be because of retail.
It’ll be because the global financial system is silently being rewritten.
At that level, BTC becomes the benchmark, not the outlier.
Not advice. Just the next layer deeper.
📊 Agree? Disagree? Let’s chart it.
#BTCUSD #Bitcoin #Crypto #LongTermView #MacroTrading #HalvingCycle #TradingView
L1NK 0N BI0

BITCOIN UPDATE Bitcoin seems to be preparing to fix its lows so it’s time to target a trade to the up side because, it had dropped to a fair amount of lows
$BTC / Bitcoin Update - The Bitcoin Awakes? 7/23Hello fellow gamblers,
BTC price action has probably pissed off a lot of you, but I believe we are getting close to a breakout.
If my theory is correct, we are forming a wyckoff re-accumulation pattern that will give us an explosive move towards ATH.
- Right now will be a great buying opportunity for those with those that have nothing to lose(super risky entry), but I am suspecting that we formed a spring and the breakout happens next.
- The pattern is still valid as long as we stay above 116k.
- If we lose 116k, we will go towards 110k.
- Levels to watch: 116.7k, 117.9k, 120.3k, 123.2k

update : BTC/USD : WATCH TIME
Bitcoin
7 minutes ago
BTC/USD: Phase 9 In Progress – Watch Time
0
7 minutes ago
BTC has completed its impulsive and correction phases. Now it’s deep into Phase 9, the distribution phase ...
🧭 Bias: Long
📆 Daily Cycle:
Phase 3: Apr 5 – May 26 (40 bars)
Phase 6: May 26 – Jul 2 (12 bars)
Phase 9: Jul 2 → Expected until Aug 6
Now forming 3 internal sub-cycles (1H chart) = as explained on the chart by green trend info lines.
📍 Buy Zone: 118098 – 118827
🛡️ Stop Loss: 117369
🎯 Target: 120850
📅 Before Friday, July 25.
reason: this is the dip it shouldn't goback
The market doesn’t care what you “feel.”
It respects the clock.

BTC/USD: Phase 9 In Progress – Watch TimeBTC has completed its impulsive and correction phases. Now it’s deep into Phase 9, the distribution phase ...
🧭 Bias: Long
📆 Daily Cycle:
Phase 3: Apr 5 – May 26 (40 bars)
Phase 6: May 26 – Jul 2 (12 bars)
Phase 9: Jul 2 → Expected until Aug 6
Now forming 3 internal sub-cycles (1H chart) = as explained on the chart by green trend info lines.
📍 Buy Zone: 118098 – 118827
🛡️ Stop Loss: 117369
🎯 Target: 120850
📅 Before Friday, July 25.
reason: this is the dip it shouldn't goback
The market doesn’t care what you “feel.”
It respects the clock.

BTC Range-Bound Movement With Key Levels in SightBitcoin has largely traded sideways on the daily chart since reaching its all-time high of $122,054 on July 14. The current range is defined by a resistance level around $120,000 and a support floor around $116,000
With demand gradually weakening, BTC risks a breakdown below the current support. A close below $116,000 could open the path toward $114,000, marking a deeper short-term correction.
On the upside, renewed buying pressure could push BTC above the $120,000 resistance. A successful breakout may set the stage for another retest of the all-time high and potentially new highs if momentum follows through.

BRACE YOURSELF FOR IMPACT! FUNDAMENTAL ANALYSIS
ETF Outflows: Recent data shows significant outflows from US-listed spot Bitcoin ETFs. After a strong period of inflows, a $131.35 million outflow was observed on Monday, breaking a nearly three-week streak. This indicates a shift in institutional sentiment and a potential cooling of demand from these major players. Continued outflows could put significant downward pressure on the price.
Prepare your positions, as we aim for $116,000. Stay nimble, stay disciplined!
ENTRY POINT 118230
TARGET 116000
STOPLOSS 118500

New highs for bitcoin but momentum lowerGenerally lower trade tension, ongoing expectations of two more cuts by the Fed this year and speculation about Jerome Powell’s possible replacement have been some of the main macro fundamental factors driving bitcoin recently. Sentiment in crypto markets generally is greedy but liquidity and volatility have been more limited. So far this movement starting in early July has been much more limited in scope compared to the frantic gains late in 2024.
The very obvious candidate for medium-term resistance would be the 161.8% weekly Fibonacci extension slightly below $140,000. It’s practically certain that the price will reach there sooner or later, but the challenge for traders of CFDs on bitcoin is how long that’s going to take and how far the price might retrace lower before then. Currently there’s no overbought signal from either Bollinger Bands (50) or the slow stochastic, but saturation generally isn’t a useful signal for cryptocurrencies anyway.
In the absence of any evidence of significant profit-taking after $120,000 was reached and amid seemingly high buying demand with an ongoing media frenzy, the price is likely to make a new high again soon unless fundamentals and sentiment shift dramatically. Timing the trade though is potentially very difficult.
This is my personal opinion, not the opinion of Exness. This is not a recommendation to trade.

Bitcoin ready for 144000After the trend line is broken and the pullback is ready to pump to the range of 138,000 to 140,000

Bitcoin long Bitcoin After the trend line is broken and the pullback is ready to pump to the range of 138,000 to 140,000🤪🤪🤪

BITCOIN - Entry on basis of Internal CHOCH & (Demand/supply).1. Trade Prediction Breakdown
Current Price: ~117,967
Short-Term Bias (1H):
Expecting a minor pullback/retrace toward a small 1H supply (orange line), then a drop.
This internal structure sets up a CHOCH.
Mid-Term Setup:
Price is projected to dip into the 4H demand zone (~112,000–114,000), confirming a bullish mitigation zone.
After demand is tapped → Expect bullish BOS (Break of Structure) to resume higher timeframe uptrend.
Entry Logic:
Aggressive Entry: Sell from 1H supply (small RR setup).
Main Entry: Buy from 4H demand after price shows bullish internal structure (e.g., bullish CHOCH or BOS on LTF like 15M/30M).
🧠 Key Concepts Applied:
Concept How it's used in this chart
CHOCH Signals potential reversal in short-term structure
Supply Zone (1H) Short entry trigger area
Demand Zone (4H) Expected strong bounce area
Internal Structure Used to time entries and CHOCHs
External Structure Governs overall trend and swing direction
✅ Final Trade Idea Summary:
🔽 Short-Term Sell from 1H supply zone.
📉 Target = 4H Demand Zone (112k–114k).
🔼 Buy from 4H Demand after confirmation (expecting strong upward rally).
🎯 Final target = 122k+ area (based on external bullish structure).
Let me know if you want this turned into a trade journal

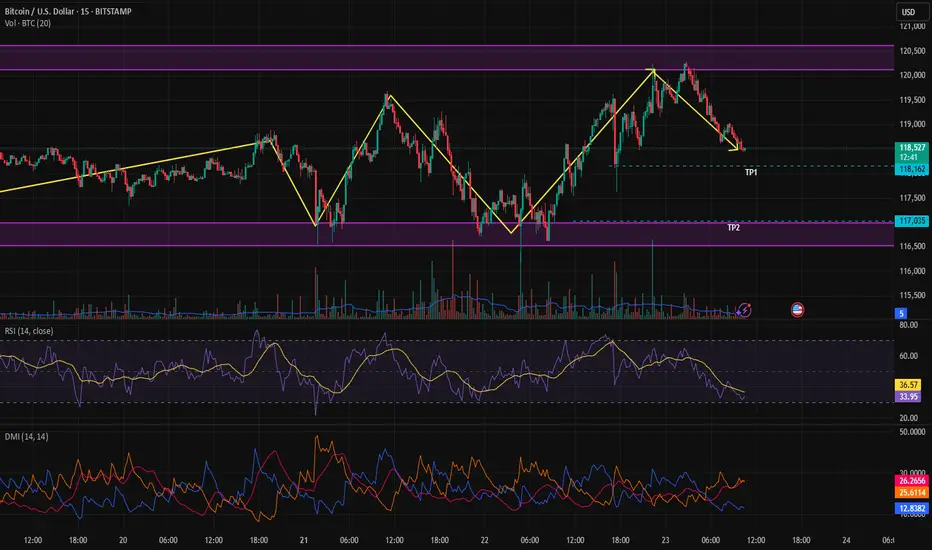
CHECK BTCUSD SIGNAL READ THE CAPTAINEntry Point: Around 118600 118300
Stop Loss: Around 120000
🎯 Target Levels
Take Profit 1:
117100
Take Profit 2:
115300
last target
113900

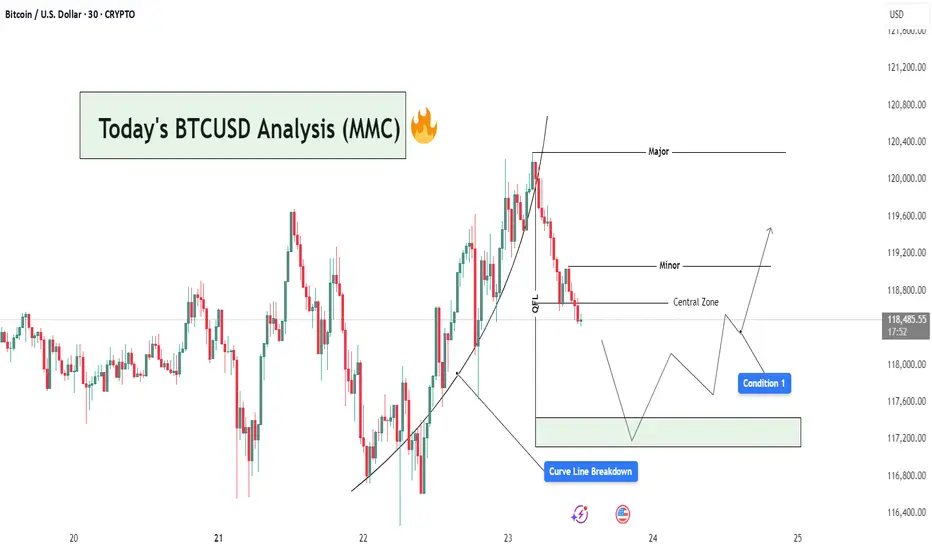
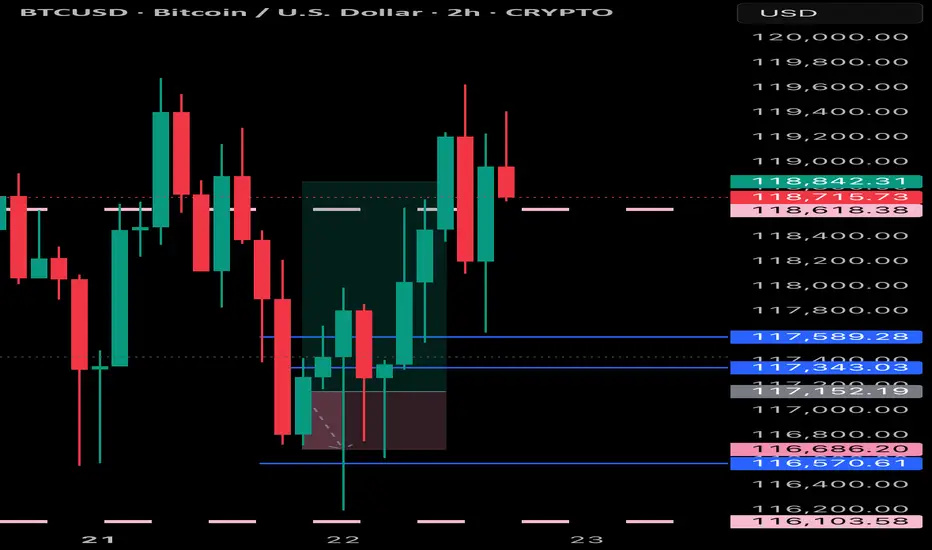
BTCUSD Analysis : Curve Line Breaked and Move Towards Target📊 Market Overview:
BTCUSD has recently completed a strong bullish leg, following a parabolic curve formation that led price into a Major Resistance Zone near the $120,400 level. This rally aligns with MMC principles where price forms momentum-driven structures before reaching high-liquidity zones (often ending in exhaustion).
📍 1. Curve Line Support & Breakdown – A Shift in Sentiment
Your chart shows a clear Curve Line that supported the bullish impulse. Price respected this dynamic support throughout the uptrend until a Curve Line Breakdown occurred—marking the first sign of bullish weakness.
In MMC strategy, this curve structure breakdown is critical:
It tells us the accumulation → expansion → exhaustion cycle is ending.
The market is likely entering retracement or distribution phase.
Price often seeks lower equilibrium, typically around the Central Zone.
🧠 2. QFL Zone (Quick Flip Level) – The Hidden Base
Immediately after the curve broke, price moved toward the QFL level, which represents a demand base from earlier structure. This zone acts as a short-term support and often produces a reactive bounce (but not always a reversal).
Watch closely:
If price respects this zone → temporary relief bounce
If it fails → we’ll likely see full test of Central Zone or lower demand levels
🟩 3. Central Zone – The MMC Decision Area
The Central Zone is a key horizontal level on your chart, defined between ~$117,300 and ~$118,200. This zone is marked based on:
Previous structure
Volume clusters
Demand imbalance
Why is this zone important?
It serves as the balance point between buyers and sellers.
A bullish reaction here could re-initiate a move toward Minor Resistance (~$119,200).
A failure to hold could open the door for deeper retracement toward the green demand box (~$117,200 or below).
🔄 4. Two Primary MMC-Based Conditions to Watch:
✅ Condition 1: Bounce from Central Zone
Price reacts from within the Central Zone
Forms bullish structure (double bottom, bullish engulfing, or reversal wick)
Short-term target becomes Minor Resistance (~$119,200)
If volume increases and price breaks above Minor, continuation toward Major is possible
❌ Condition 2: Breakdown & Bearish Continuation
Price fails to hold within Central Zone
Bearish structure forms (e.g. lower highs, breakdown candles)
Clean move expected toward next liquidity pocket at $117,200–$116,800
This would confirm market shifting into bearish control
📌 5. Minor vs Major Levels – Key Zones
Minor Resistance (~$119,200): Short-term target if bounce occurs
Major Resistance (~$120,400): Liquidity sweep zone, strong supply
Green Demand Box (~$117,200): If Central Zone fails, this becomes next bounce zone
📘 Final Thoughts:
This is a classic MMC setup in real-time:
Curve Formed → Broke
OFL + Central Zone → Now being tested
Next move depends on confirmation from buyers or sellers at Central Zone
Don’t trade emotionally — let price action give you confirmation before taking any positions. Watch the Central Zone behavior closely and manage risk based on scenario outcomes.
Price is approaching the bottom of the rangeAs mentioned in our previous analysis, the price had reached the top of the range. At that stage, we had two options: wait for a confirmed breakout to the upside, or take a reactive position anticipating a move toward the bottom. Now, we are seeing price action moving toward the lower boundary of the range.
Btcusdt techinical analysis.Btcusdt techinical analysis next move posibale at h1 time frame.not finchinal advice.

BTCUSD RECAPBITCOIN has preformed as expected in short period of time can continue even more to the up side but will wait for good entries
What do we need to know before investing?If you are thinking about investing money for the potential returns it offers, you should know that it may go well, but that there are always risks. That’s why we are going to give you some basic tips to bear in mind before making any investment decision.
How much money are you going to invest?
First of all, you need to decide how much money you want to put towards your financial investments.
The markets are subject to change
The financial markets are constantly fluctuating. The term volatility is the most commonused term to describe and measure the uncertainty provided by changes to theprices of financial assets.
Additionally, there are times in the market when the prices are more pronounced and every now and then there are crisis periods and asset prices fall dramatically.
Investing in financial markets means that we have to assume that our investments will always be subject to these types of fluctuations. If you are going to invest in the financial markets the money that you invest must be money that you will not need during the investment term.
That’s why, investing in order to obtain short term gains is inevitably associated with high risk. Furthermore, the larger our intended gains, the larger the associated risk. Always bear in mind that the greater the expected returns, the greater the assumed risk. Once again, be sure that you do not need the money that you are going to invest, as it may have losses.
The opposite can be said of long term investments, where the capacity to wait and overcome falls in the market means that you can assume more risk with your investments. With a long term vision you will avoid having to experience any possible losses with your investment period due to any eventual liquidity needs.
How much risk are you willing to take on?
Before investing it is important to know the risk you can assume. Every investor has their own risk tolerance level that they need to be aware of. Risks and returns go hand in hand, because for more returns you also need to take on more risk, and vice versa.
It is also good to know that just as with normal market conditions, those assets with a higher risk tend to suffer more fluctuations with their prices than those assets with less risk.
Therefore, in general terms:
When the forecasts for the financial markets are favourable and the market goes up, those assets with higher expected returns generally perform excellently.
Whenever the financial markets are going through uncertain times, those assets with higher expected returns, and therefore more risk, tend to perform worse.
You must start from a strong financial position
To invest you need to be at a point where your accounts are well under control, including your debts. We do not mean to say that if you have any outstanding credit you cannot invest, but it is essential that everything is in order and that you are in a situation where you can fulfil your financial obligations.
On the other hand, to build long term wealth, it is important that you assign part of your income to your savings, meaning that you have to invest with the money left over after making your payments while also saving part of what you earn.
It is important to keep a composed outlook
Now we know that investing bears its own risks and that the market is subject to change, it is essential to be composed when investing. When investing it is important to think positively, as if you don’t really believe that things will work out, why invest?
It is one thing to be cautious, and to know how much money to invest and what level of risk tolerance to assume, and another to think negatively each time there is a drop in the market. In reality, investing is a combination of caution and composure.
Diversification is the key to success
Somebody with less investment experience may make the mistake of putting all of their investment budget into just one thing. However, it is much better to have diverse investments, as while some investments may not quite work out as you would have liked them to, some do even better.
Losses are normal, and so are returns
We previously said that when investing it is important to stay calm, and that is true. In this regard, you also have to bear in mind that it is normal for some investments in your portfolio to not perform as well as you had expected.
We cannot predict the behaviour of the financial markets or of certain assets. We can also unexpectedly find ourselves with some assets that don’t perform as well as we had hoped. That is why we recommend, in addition to not risking more than you can invest, to diversify your investments well.
We have already said that investment involves risk, which is why it is good to know that if you are willing to invest, you are also willing to take on risks. If you are prepared to take on this risk, you can be successful in your investments.
Did you like it? Share with your friends
by HollyMontt

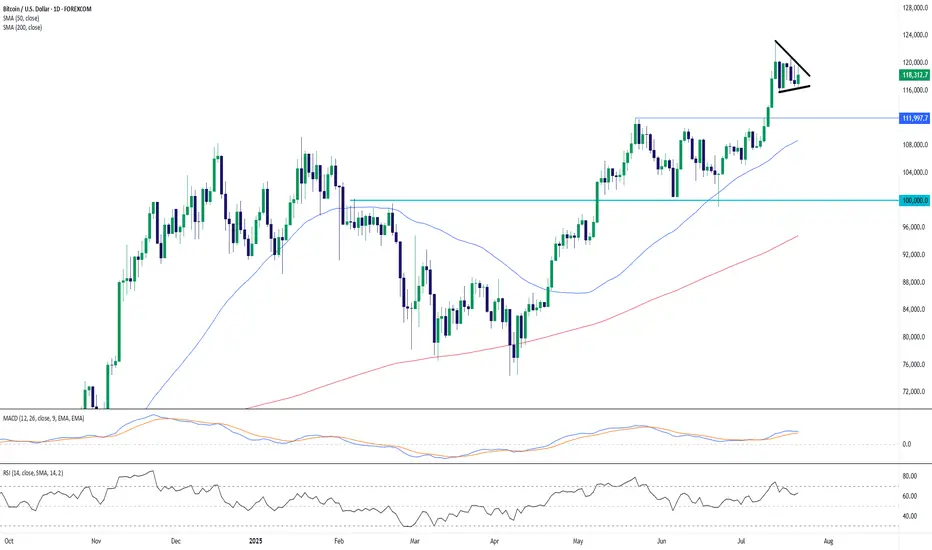
BTC/USD – Bullish Pennant Hints at Potential Continuation >$120KBitcoin remains in a strong uptrend, consolidating just below the $120,000 level after a powerful breakout from the $112K zone earlier this month. Price action has formed a classic bullish pennant pattern on the daily chart, characterized by converging trendlines and declining volume—a textbook setup for trend continuation.
The uptrend remains technically intact, with BTC well above its 50-day SMA ($108.7K) and 200-day SMA ($94.8K), both of which are rising and supportive of bullish momentum. The RSI at 63.2 reflects healthy, but not overbought, conditions, while the MACD maintains a positive crossover above the zero line, though it has started to flatten during the consolidation.
A breakout above the pennant resistance (~$119K) could trigger the next leg higher, potentially targeting a measured move toward the $128K–130K area. However, if sellers manage to push price below the lower pennant boundary and horizontal support at $112K, a deeper correction toward $100K cannot be ruled out.
Bias: Bullish continuation favored as long as price holds above $112K. Watch for a breakout to confirm upside momentum toward new highs.
Time frame: Medium-term (days to a few weeks)
-MW
Bitcoin at the Threshold of the Fibonacci Gate - Silent Strain.⊢
⟁ BTC/USD - BINANCE - (CHART: 1W) - (July 22, 2025).
◇ Analysis Price: $119.209,03.
⊣
⨀ I. Temporal Axis - Strategic Interval - (1W):
▦ EMA9 - ($111.083,72):
∴ Price remains well above the EMA9, with consistent bullish spacing;
∴ The weekly candle closes with strength and full-body integrity above it;
∴ EMA9 slope continues upward, supporting ongoing momentum.
✴️ Conclusion: Short-term structure remains decisively bullish, with trend-following support intact.
⊣
▦ EMA21 - ($103.417,42):
∴ EMA21 is sharply rising and holds significant historical support;
∴ Price remains distanced, but no vertical stretch detected;
∴ Not touched since early 2024 - the bullish cycle is intact.
✴️ Conclusion: Mid-cycle momentum remains strong. No structural weakness under current trajectory.
⊣
▦ WMA200 - ($62.496,26):
∴ Remains deep below current price action - untouched since breakout phase in 2023;
∴ Its angle is now slowly tilting upward - reflecting macro regime change;
∴ Long-term holders remain in command; no gravitational pull is active.
✴️ Conclusion: WMA200 is no longer relevant for tactical reaction, but serves as a structural floor of the cycle.
⊣
▦ Fibonacci Retracement - (Top: $122.056,95 / Bottom: $27.143,79):
✴️ Top: $122.056,95 - (07/14/2025) = 1 Fibo;
✴️ Bottom: $27.143,79 - (10/16/2023) = 0 Fibo.
∴ Price is now within 2.33% of the Fibonacci 1.0 extremity;
∴ Entire move from $27k to $122k retraced cleanly with structural respect to 0.382 ($63.400;62) and 0.618 ($85.800,12);
∴ Current pressure nears full extension, requiring caution;
✴️ Conclusion: Full retracement achieved. Continuation must now be fueled by external influx or will face rejection at golden gate.
⊣
▦ RSI (21) + EMA9 - (RSI: 66.65 / EMA9: 63.73):
∴ RSI remains below 70 - showing momentum without exuberance;
∴ RSI crossed above EMA9 with positive slope;
∴ No divergence present; momentum confirmation continues.
✴️ Conclusion: Silent bullish continuity. No signal of exhaustion.
🜏 ORACVLO ARCANE: (RSI = 66 - No Fibonacci/Guematria convergence).
⊣
▦ MACD (9,21) - (MACD: 7,666.30 / Signal: 5,976.56 / Histogram: +1,689.74):
∴ MACD lines widening - strong expansion phase;
∴ Histogram rising above prior week;
∴ Still in mid-cycle range - not overextended.
✴️ Conclusion: Momentum engine active. No current loss of acceleration.
🜏 ORACVLO ARCANE: (Histogram = 1,689.74 - No convergence).
⊣
▦ OBV + EMA9 - (OBV: 86.27K):
∴ OBV rising cleanly with price;
∴ No divergence detected on weekly timeframe;
∴ EMA9 supportive, confirming accumulation bias.
✴️ Conclusion: Volume structure confirms legitimacy of bullish move.
⊣
▦ Stochastic RSI - (3,3,21,9) - (K: 94.30 / D: 84.53):
∴ Both lines in extreme overbought zone;
∴ No bearish cross yet - but a turn may initiate in next 1-2 candles;
∴ Historical turning points often occur from this elevation.
✴️ Conclusion: Momentum peaking. Vigilance required for reversal trigger in next cycle.
⊣
🜎 Strategic Insight – Technical Oracle:
∴ Price is pressing against the final Fibonacci gate of $122K, with momentum indicators still aligned;
∴ However, overbought pressure is building, particularly on the Stoch RSI.
∴ Breakout will require force; otherwise, a pullback from the threshold is probable.
⊣
∫ II. On-Chain Intelligence – (Source: CryptoQuant):
▦ Exchange Netflow Total - (All Exchanges) - (+920 BTC):
∴ Influx into exchanges suggests potential distribution is being prepared.
⊣
▦ Funding Rates - (All Exchanges) - (+0.008):
∴ Mildly positive; no leverage overheating detected.
⊣
▦ Taker Buy Sell Ratio - (All Exchanges) - (0.959):
∴ Slight taker sell dominance - friction at high prices.
⊣
▦ Spent Output Profit Ratio - (SOPR) - (1.017):
∴ Profitable exits ongoing. Healthy, but could tilt if profit-taking accelerates.
⊣
▦ Realized Cap + (EMA9) - (Rising):
∴ Network is revaluing BTC upward - structurally healthy.
⊣
▦ MVRV Z-Score + (EMA9) - (2.32):
∴ Elevated. Historically a zone where caution is warranted.
⊣
▦ Miner Reserve - (All Miners) - (1.809M BTC declining):
∴ Long-term miner outflows continue - no sudden spike detected.
⊣
🜎 Strategic Insight - On-Chain Oracle:
∴ On-chain data supports the current trend, but with visible friction. Exchange inflow and profit-taking are warning signs that price is now dependent on sustained demand;
∴ This is a zone of silent strain: structurally sound, but tactically stretched. While the broader framework supports continuation, there is no buffer left for error;
∴ Weakness will be exploited if new inflows fail to materialize.
⊣
𓂀 Stoic-Structural Interpretation:
∴ Structurally Bullish - Tactically Suspended;
∴ Tactical Range Caution: ($114.000 / $122.056).
⊣
▦ Codicillus Silentii - Strategic Note:
∴ The CME gap and the proximity to Fibonacci 1.0 have formed a psychological and technical ceiling;
∴ If unbroken this week, the next cycle may revert to (0.786) as reversion.
⊣
▦ Momentum-wise:
∴ RSI remains in the bullish zone (66.65) without entering overbought - a sign of discipline in the ascent;
∴ MACD shows expansion with a growing histogram - no curvature loss;
∴ Stochastic RSI is in extreme overbought (K = 94.30), signaling elevated tension.
✴️ Conclusion: Momentum is intact but strained. A breakout is possible, but failure to continue will invite a flush.
⊢
✴️ Final Codex Interpretation:
∴ Bitcoin stands at the edge of the Fibonacci Gate, within breath of the 1.0 threshold ($122,056); ∴ While structure, momentum, and on-chain flows permit a push higher, the presence of inflows to exchanges, elevated MVRV, and extreme oscillator positioning suggest that the threshold is sacred - and only silence or strength may break it;
∴ Rejection here would not be collapse, but strategic regression to gather force beneath the gate.
⊢
⧉
· Cryptorvm Dominvs · MAGISTER ARCANVM · Vox Primordialis ·
⚜️ ⌬ - Silence precedes the next force. Structure is sacred - ⌬ ⚜️
⧉
⊢

HUGE Cup & Handle On BTC/GOLDAre we in the same situation as in 2017? At that time, BTC followed with a 500% rally. Do you think history is repeating itself?
If we use the same percentages, we'll have a BTC/GOLD rally of 600%. This would mean that BTC could make 250%.
