Bitcoin Cycles Signal Major Move — BIT500 on What Comes NextBitcoin’s historical price action is known for its cyclical behavior — driven not only by supply dynamics like halving events, but also by global macroeconomic forces. This week, leading crypto macro analyst TechDev released a widely discussed model projecting that Bitcoin may be entering a new explosive phase, closely linked to a shift in monetary policy, global liquidity cycles, and risk asset rotation.
At BIT500, we see this as more than a theory — it’s a playbook. Understanding macro-driven crypto cycles gives institutional and high-net-worth investors a clear advantage. And, when used properly, it can become the foundation for consistent alpha generation in the digital asset space.
TechDev’s Model: Liquidity as the True Driver
According to TechDev, Bitcoin’s major uptrends are synchronized with global liquidity expansions. In particular, the model links Bitcoin price surges with:
Falling real interest rates,
Expanding global M2 money supply,
Weakening U.S. dollar (DXY decline).
This pattern played out in 2016–2017 and again in 2020–2021. As global central banks prepare to shift toward more accommodative policies — especially amid slowing GDP growth and rising debt burdens — similar conditions may be taking shape for late 2025 and into 2026.
BIT500 analysts agree: the macro landscape is increasingly favorable for risk-on positioning, especially in hard assets like Bitcoin.
On-Chain Indicators Confirm the Thesis
Supporting the macro thesis is a growing set of on-chain signals. Our internal models — as well as public indicators like Dormancy Flow, MVRV ratio, and Realized Cap metrics — show long-term holders are accumulating, while short-term holder activity has flattened.
The decline in exchange reserves, increased self-custody trends, and decreased miner selling pressure all align with prior pre-bull market phases. This combination of tightening supply and macro liquidity can act as fuel for the next leg up — one that could catch passive investors off-guard.
How BIT500 Capitalizes on Bitcoin Cycles
At BIT500, we convert insights into execution. Our team applies cycle-based, quantitative strategies to capture asymmetric upside while managing downside risk.
Here’s how we turn macro analysis into market performance:
Phased Capital Deployment
We deploy capital in staggered allocations, entering during compression phases and scaling in as trend confirmation emerges — minimizing exposure during volatility and maximizing return during expansions.
Volatility Harvesting
We implement delta-neutral and volatility-arbitrage strategies across Bitcoin derivatives markets, generating income in all phases of the cycle — especially when price is range-bound.
Multi-Asset Rotation Models
Based on cyclical rotation, we dynamically adjust exposure between Bitcoin, Ethereum, and select altcoins. These models are tested to outperform static portfolios across halving-based and macro cycles.
Custom Risk Monitoring Systems
BIT500 clients benefit from our proprietary Cycle Risk Dashboard, which sends alerts when market structure shifts — enabling proactive rebalancing rather than reactive trading.
Conclusion
Bitcoin’s next major price movement is likely to be shaped not just by crypto-native factors, but by broader shifts in global liquidity, interest rates, and investor sentiment. TechDev’s research confirms what BIT500 has long modeled — that understanding economic cycles is key to anticipating large-scale Bitcoin breakouts.
For investors seeking not just exposure but performance, the coming months represent a rare window of opportunity. At BIT500, we don’t just track cycles — we build strategies to monetize them with discipline and precision.
BTCUSD trade ideas
Bitcoin ConsolidatesBitcoin continues to chop sideways, consolidating below the all time high. Demand is high, RSI is dropping as price goes sideways. This will break out again eventually and all eyes will be back on the honey badger.

Watch this FVG for retracement zone for price action trenWatch this FVG for retracement zone for price action trend
Bitcoin, Politics, and Security: This Week in CryptoThis week brought a series of headline-making moves in the crypto space, reflecting the growing maturity and complexity of the digital asset landscape. From massive Bitcoin buys to cybersecurity initiatives and political implications, here's what stood out — and why it matters.
Strategy Buys $740M in Bitcoin
Institutional players continue to accumulate Bitcoin — but the scale and structure of Strategy’s recent purchase caught the attention of analysts. According to filings with the SEC, the firm added 11,000 BTC, bringing total holdings to 186,000 BTC — worth over $11 billion.
What’s notable is that Strategy appears to be financing these purchases using bond issuance, effectively applying low-interest leverage to increase crypto exposure. This marks a shift in how corporations are approaching Bitcoin — as both a reserve asset and a financial instrument.
Trump Media Discloses $2B in Digital Assets
In a surprising disclosure, Trump Media & Technology Group, the parent of Truth Social, revealed it holds $2 billion in digital assets — including USDC, Ethereum, and small allocations to Solana and Chainlink.
The move has sparked debate within both financial and political circles, given Donald Trump’s renewed activity as a U.S. presidential candidate. Such a significant crypto treasury tied to a politically active entity raises concerns about market influence and regulatory scrutiny.
CoinDCX Launches $1M Bug Bounty Program
Indian crypto exchange CoinDCX announced a $1 million bug bounty program, inviting white-hat hackers and security researchers worldwide to find vulnerabilities in its platform. This marks a shift toward proactive cybersecurity in the crypto exchange industry.
The company also plans to launch an open-source vulnerability-sharing platform to facilitate threat intelligence across exchanges — a move that could standardize Web3 security practices.
Bottom Line
This week underscored the increasingly strategic posture of major crypto market players. From treasury management and structured crypto financing to cybersecurity and institutional-grade governance, the digital asset sector is evolving rapidly.
For savvy investors and ecosystem participants, this complexity brings more opportunity than ever before — but also demands sharper focus, real-time analytics, and risk-aware strategies.
If you need these articles tailored for a newsletter, blog, or investor deck — just let me know!

Bitcoin Stalls Ahead of Fed and ETF DataAt the time of writing, Bitcoin is trading in a narrow band between $66,000 and $67,800 — showing price stability but lacking directional momentum. This consolidation phase comes ahead of several major catalysts: the upcoming Federal Reserve interest rate decision, quarterly earnings from top tech firms, and updates on inflows and outflows from U.S.-based spot Bitcoin ETFs.
Macroeconomic Pressure: All Eyes on the Fed
The U.S. Federal Reserve will meet on July 31 to discuss interest rates. While most analysts expect the central bank to hold rates steady, markets are focused on the Fed’s tone. Any suggestion of easing or a future rate cut — possibly in Q4 — could trigger renewed appetite for risk assets, including crypto.
Tech Earnings: Nasdaq Sentiment Spillover
Major tech firms including Apple, Amazon, and Google are scheduled to report earnings this week. These reports are closely tied to broader market sentiment, especially for the NASDAQ and S&P 500 — both of which show increasing correlation with crypto. Positive earnings could strengthen risk-on sentiment and give Bitcoin a short-term boost.
ETF Flows: A Silent Market Driver
Since the beginning of the year, spot Bitcoin ETFs have shown mixed behavior — strong inflows in Q1, followed by periods of cooling and outflows. Investors are now awaiting updated flow data from major asset managers like BlackRock and Fidelity to assess whether institutional interest in Bitcoin remains intact.
A return to consistent inflows could serve as a catalyst to push BTC out of its current range. Conversely, continued stagnation or net outflows may trigger a breakdown below $65,000 — a key support level.
Technical View: Calm Before the Storm
According to BBDelta, $66,500 is acting as a short-term equilibrium point between buyers and sellers. Open interest in Bitcoin futures remains elevated, indicating that traders are bracing for significant movement once market catalysts emerge.
Conclusion
Bitcoin is currently in a state of “wait and see,” and the next several days could be pivotal. The convergence of macroeconomic updates, tech-sector earnings, and ETF flow reports is likely to set the tone for crypto markets through August.
For professional investors and active traders, now is the time to prepare. BBDelta advises clients to structure scenario-based strategies, focusing on key levels and volatility hedging. Sideways markets offer opportunities for precision entries, capital protection, and disciplined positioning — all critical before the next major impulse move.
Bitcoin - Will Bitcoin continue its upward trend?!Bitcoin is above the EMA50 and EMA200 on the four-hour timeframe and is in its medium-term ascending channel. Bitcoin’s current upward momentum has the potential to reach its previous ATH. If it corrects, you can look for Bitcoin buying opportunities from the identified support area, which is also at the intersection of the bottom of the ascending channel.
If this support is lost, the decline will continue to around $113,000, where you can again buy Bitcoin with a better risk-reward ratio.
It should be noted that there is a possibility of heavy fluctuations and shadows due to the movement of whales in the market, and capital management will be more important in the cryptocurrency market. If the downward trend continues, we can buy within the demand range.
Last week, a group of U.S. senators released an initial draft of a new legislative proposal aimed at creating a clearer regulatory framework for the digital asset industry in the United States. The proposal builds on the recently passed CLARITY Act in the House of Representatives and focuses on strengthening market structure, enhancing consumer protection, and expanding regulatory oversight.
According to the senators, the bill addresses key areas such as banking, disclosure requirements, securities classification, and measures to combat illicit financial activity.Senator Lummis, in highlighting the proposal, stressed the urgent need for legal clarity to support the growth of this emerging industry within the U.S. The legislation aims to facilitate the integration of digital assets into banking services and would allow financial holding companies to provide services based on such assets.
The draft also includes measures aimed at preventing illegal financial activities, such as improving regulatory standards and boosting inter-agency cooperation to identify and block misuse of digital assets.
In addition, the senators have issued a “Request for Information” (RFI) to support the legislative process and have invited the public to share their opinions on more than 35 related topics, encouraging broader engagement in shaping the bill.
Meanwhile, in Asia, Japan-based firm Metaplanet announced that it has added 780 BTC worth $93 million to its digital holdings. This acquisition brings the company’s total Bitcoin reserves to 17,132 BTC, valued at roughly $2 billion. Metaplanet is fast becoming one of the largest institutional Bitcoin treasuries in the region—potentially serving as a model for other firms across Asia.
At the same time, publicly traded U.S. companies have significantly ramped up their Bitcoin holdings. By the end of Q2 2025, these companies had accumulated nearly 900,000 BTC, marking a 35% increase over the previous quarter. This surge, driven primarily by firms such as MicroStrategy, has sent demand for Bitcoin soaring.
Some analysts believe that the $1.5 trillion in free cash flow held by companies within the S&P 500 index could spark a new wave of institutional Bitcoin buying.
Looking ahead, the upcoming week is packed with critical U.S. economic data. Alongside the Non-Farm Payroll (NFP) employment report and inflation metrics via the Personal Consumption Expenditures (PCE) index, the initial estimate for Gross Domestic Product (GDP) and various other indicators will be released—potentially offering a clearer picture of where the U.S. economy is heading.
The Federal Reserve remains primarily focused on inflation and labor market dynamics. June CPI data indicated signs of inflationary pressure caused by tariffs. If Thursday’s PCE report—particularly its core reading—confirms a similar trend, the Fed may decide against a rate cut in September. As a result, financial markets have priced in only about a 65% chance of a rate cut at that meeting.

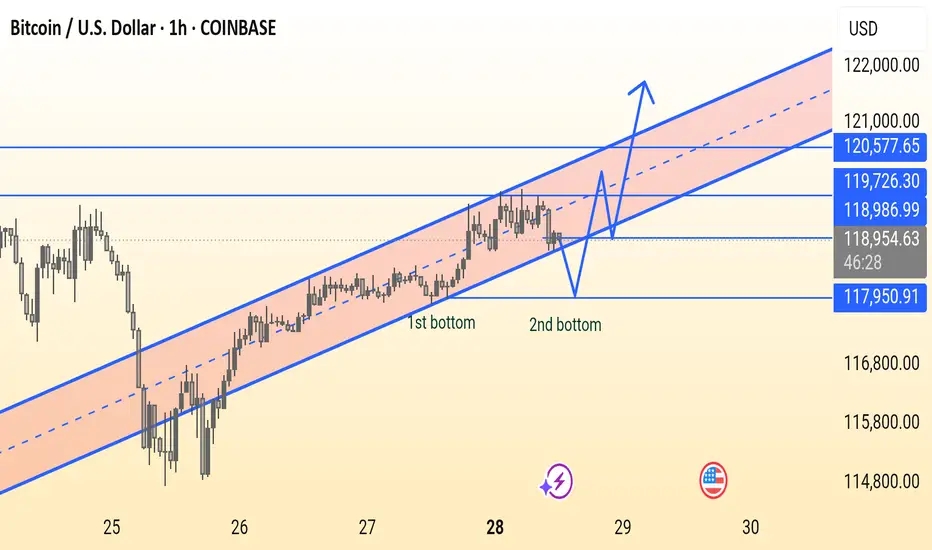
BTC/USD Double Bottom Forming in Uptrend ChannelThis BTC/USD 1-hour chart shows Bitcoin trading in an ascending channel, forming a potential double bottom near support around $118,950. A breakout above $118,986 could lead to a bullish move toward $120,577. Key support lies at $117,950 — holding this level is crucial for bullish continuation.
Metaplanet Doubles Down on Bitcoin Despite Weak SharesJapanese investment firm Metaplanet continues to draw attention with its pro-Bitcoin stance, announcing a fresh acquisition of BTC worth $93 million. The move comes despite ongoing pressure on the company's stock, underscoring its long-term commitment to digital assets.
Publicly listed on the Tokyo Stock Exchange, Metaplanet began accumulating Bitcoin in early 2024, taking inspiration from U.S.-based MicroStrategy. Since then, the company has steadily increased its holdings, viewing the cryptocurrency as a hedge against inflation and currency devaluation — particularly in light of the weakening yen.
With this latest purchase, Metaplanet’s total Bitcoin holdings now exceed 5,000 BTC, making it one of Asia’s largest corporate holders of the asset. Company executives emphasize that their approach is not driven by short-term speculation, but rather by a strategic vision to transform the balance sheet and align with the future of finance.
Still, the stock market has not fully embraced the strategy. Since the company’s initial crypto investments, Metaplanet shares have experienced significant volatility and an overall downward trend. Some investors remain wary of overexposure to a single volatile asset, fearing it could deter traditional capital and increase overall risk.
Speaking to local media, CEO Tetsuya Nagata reiterated that the firm’s Bitcoin commitment is deliberate and resilient. “We’re not chasing short-term price movements,” he said. “We see corrections as opportunities to strengthen our position and prepare for long-term transformation.”
Analysts are divided. Some view Metaplanet’s approach as a sign of growing institutional appetite for crypto in Asia, while others call for a more diversified portfolio to mitigate risk. There is growing speculation that Metaplanet’s bold move could set a precedent for other Japanese and regional companies seeking similar exposure.
Against the backdrop of global economic uncertainty and financial digitization, Bitcoin is evolving from a speculative asset into a core component of strategic asset allocation. Metaplanet is a clear example of this shift — one that is navigating short-term market challenges in pursuit of a long-term digital vision.
Time will tell whether the strategy pays off. But for now, Metaplanet is carving out a bold new role in Japan’s corporate landscape, as a pioneer of institutional Bitcoin adoption in Asia.

Solana (SOL) Revs Up Again — Fresh Breakout Above $200 in Sight?After months of consolidation, Solana (SOL) is once again showing signs of bullish momentum, trading near $176 and rapidly approaching a potential breakout level of $200. Investors and analysts alike are paying close attention, as on-chain activity and ecosystem development provide a compelling case for a renewed upward trajectory.
With growing demand for high-throughput blockchain infrastructure and new institutional integrations, Solana is positioning itself as more than just an Ethereum alternative—it’s emerging as a core infrastructure layer for high-performance Web3 applications.
Institutional Momentum Gathers Pace
In the last three weeks, several high-profile announcements have bolstered confidence in the Solana ecosystem. Fidelity Digital Assets revealed it is piloting tokenized bond products on Solana’s network, citing its fast settlement time and composability.
Meanwhile, Visa expanded its USDC settlement pilot on Solana across five countries, reinforcing the blockchain’s real-world financial use cases.
“Solana is no longer just retail-driven,” said Karla Nunez, digital asset strategist at ApexBridge. “Institutions are beginning to build directly on it—and that changes the dynamic.”
Ecosystem Growth and Developer Activity
The number of active developers on Solana has surged 38% quarter-over-quarter, according to Electric Capital’s Developer Report. Projects in DeFi, gaming, and NFTs continue to attract users, helped by extremely low transaction costs and sub-second finality.
Notably, the Solana Foundation recently launched a $100 million grant fund for AI-integrated crypto applications, which could catalyze the next wave of user adoption.
Technical Indicators Support Breakout Narrative
SOL has outperformed major altcoins this month, rising 21% in July. The token is now trading above its 50-day and 100-day moving averages, and momentum indicators suggest a potential breakout above the key psychological barrier at $200.
A confirmed break would likely open the door to $240–$260, with minimal historical resistance in that zone.
Macro Factors Provide Tailwind
The broader crypto market is recovering as inflation metrics cool and expectations for central bank easing rise. Solana, with its high beta to market movements, often leads altcoin rallies during bullish pivots.
Furthermore, the recent dip in Ethereum gas prices has had limited impact on Solana’s user base, suggesting its appeal is increasingly based on performance, not cost arbitrage.
Conclusion
While risks remain—from network outages to broader market volatility—Solana’s resurgence appears fundamentally supported. With institutional interest rising, technical signals aligning, and ecosystem momentum building, a clean break above $200 could mark the beginning of a new cycle for SOL.
For investors seeking exposure to high-speed smart contract platforms with real-world traction, Solana may be nearing another defining moment.

“Biggest Trade Deal Ever” — 5 Things to Know in Bitcoin This WeeAs Bitcoin enters the final trading week of July 2025, global markets are responding to what many are calling the “biggest trade deal ever”—a multilateral digital finance agreement between the United States, the European Union, and five Asia-Pacific countries. While the implications are far-reaching for global payments, the spotlight remains squarely on Bitcoin, which has now firmly reclaimed the $120,000 level.
Here are five key developments shaping Bitcoin’s trajectory this week:
1. Digital Trade Pact Signals Institutional Legitimacy
The newly signed agreement includes provisions for cross-border tokenized settlement, streamlined regulations for digital asset custodians, and recognition of Bitcoin as a “monetizable asset class” in interbank systems. While CBDCs and stablecoins will be used in formal settlements, the framework opens the door for Bitcoin to function as reserve collateral.
“This is the first time sovereign regulators have embedded Bitcoin into a multilateral economic framework,” said Janice Harlow, senior strategist at Beacon Global.
2. ETF Inflows Return After Brief Slowdown
After a two-week lull, Bitcoin spot ETFs have seen renewed demand, with $850 million in net inflows over the past five trading sessions. The iShares Bitcoin Trust (IBIT) and Fidelity’s FBTC led inflows, signaling re-accumulation by institutional buyers.
Derivatives data from CME suggests traders are positioning for upside, with call options volume outpacing puts at a 2.3:1 ratio.
3. Hash Rate Hits All-Time High
Bitcoin’s hash rate has climbed to a new record high, exceeding 640 EH/s, indicating miner confidence and long-term investment in infrastructure. This surge comes despite the recent halving, which slashed block rewards and pressured weaker miners.
The increasing energy commitment suggests miners are betting on future price appreciation and institutional demand stability.
4. Whale Activity Accelerates
On-chain analytics from Glassnode show a sharp uptick in accumulation by wallets holding over 10,000 BTC. Approximately $2.1 billion in BTC has been withdrawn from exchanges in the past week, pointing to strong conviction among whales and high-net-worth investors.
“This looks less like speculation and more like positioning ahead of structural shifts,” noted Rishi Kulkarni, managing partner at TitanBay Capital.
5. Technical Indicators Flash Bullish
Bitcoin has reclaimed its 50-day and 200-day moving averages, and RSI (Relative Strength Index) remains in neutral territory at 56—suggesting room for further upside without overheating.
With the $128,000 resistance level in sight, many analysts believe a breakout to $140,000 is plausible in August, barring macroeconomic shocks.
Final Thoughts
With regulatory breakthroughs, strong on-chain data, institutional accumulation, and miner alignment, this week’s developments may mark a turning point in Bitcoin’s evolution from speculative asset to globally integrated infrastructure.
Whether the “biggest trade deal ever” delivers on its promise remains to be seen—but for Bitcoin, the direction appears clear: up and institutional.
Bitcoin (BTC): Still In Accumulation Zone | Volatility IncomingWe are still in the accumulation zone on the daily timeframe withBitcoin. What we are looking for here is a breakout from that accumulation zone, which, upon seeing a bullish breakout, we are going to long and that's what we are leaning towards.
Swallow Academy

BTCUSD IS READY TO BREAK THE DESCENDING CHANNELBTCUSD IS READY TO BREAK THE DESCENDING CHANNEL
In our latest report we wrote down that the asset may rebound from lower border of the descending channel and head toward local resistance level of 120,000.00. The forecast has successfully worked out, so what's next?
Currently the price consolidates slightly below the upper border of the descending channel and local resistance level of 120,000.00. Although, the RSI and MACD confirm bullish impulse and, in general, the asset is in mid-term bullish trend, still would be safer for long trade to wait for a breakout of the resistance with first target of 123,190.30 (ATH).

BITCOIN & 150kBitcoin in this RISING WEDGE, inside this huge RISING CHANNEL, gives us the resistance of the rising wedge & the middle line of the rising channel at $150,000.
This might be the TOP.

BTCUSD| XAUUSD| AUDUSDwe did a quick look on last week analysis and how price eventually went, so we try to look the direction of price as the general trend currently isa side ways move.

#Bitcoin – What’s Really Happening? Daily Structure + Macro#Bitcoin – What’s Really Happening?
Daily Structure + Macro Setup = Big Move Loading
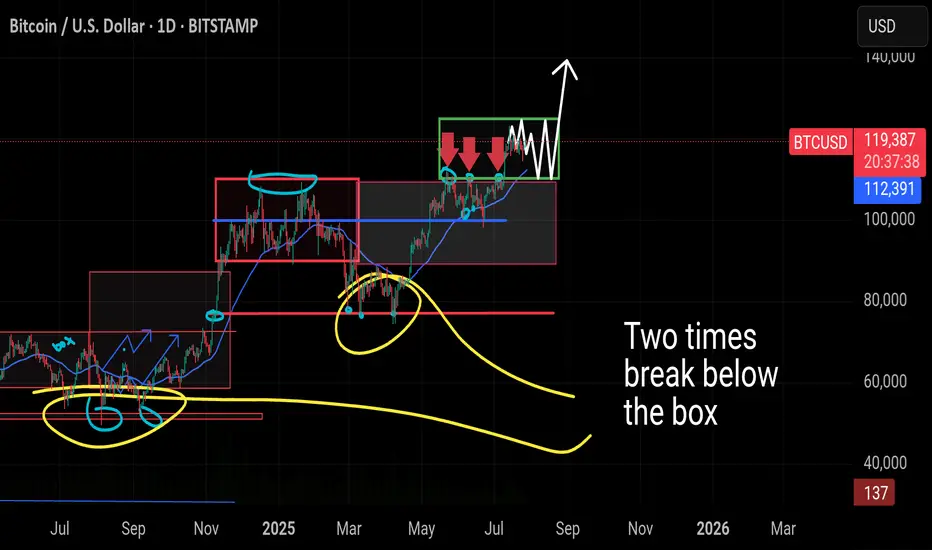
🔸 1D Chart: CRYPTOCAP:BTC Range-Bound Between $125K–$110K
Bitcoin is currently trading inside a tight sideways range, marked by resistance near $125,000 and support around $110,000. This is now the third time we've seen price consolidate in this green zone.
🔸 In the previous two attempts, BTC briefly dipped below support before quickly reclaiming the level — classic fakeouts, not real breakdowns. The current price behavior mirrors that same structure.
🔸 What If CRYPTOCAP:BTC Drops Again?
A dip below $110K or even toward $100K should not trigger panic. Historically, these wicks below the range are liquidity grabs — not signs of weakness. As long as the 200 MA holds and price doesn’t sustain under $100K, the macro trend remains bullish.
🔸 Key Zones:
– Immediate support: $112,398
– Major support: $100K psychological level
– Structure invalidation: Sustained loss below $100K (not expected)
🔸 Macro Outlook: Still Bullish
While BTC chops sideways, the broader environment is heating up:
🔸 Trump-EU Mega Trade Deal
Markets just got a major catalyst — a massive U.S.–EU agreement that includes:
– $750B in U.S. energy exports
– $600B in EU investment
– $150B in energy purchases from U.S.
This clears out tariff fears and opens the door for stocks and crypto to run. Risk appetite is returning fast.
🔸 Whale Activity Panic = Noise
Galaxy Digital wallet movement spooked the market temporarily, pushing BTC to $114,500. But zoom out:
– ETF inflows still dominate daily sell volume
– BlackRock continues absorbing supply
– Long-term whales haven’t sold — they’re holding
This was not a breakdown. It was a shakeout. Accumulation is still happening.
🔸 The Real Fuel: M2 Money Supply
Here’s where things really align for the bulls:
– In 2020, a 25% rise in M2 → BTC 800% rally
– In 2025 so far: +2.3% increase, and we’re still in “tightening”
– Largest M2 spike: +0.63% in June
Given BTC typically lags M2 by 60–90 days, the June print is setting up for a 15–17.5% upside over the coming weeks. That puts us on a clear path toward $130,000+
🔸 Bitcoin is sideways, not weak. Range-bound price action is accumulation, not distribution. Macro signals are aligning, M2 is expanding, and whale panic was short-lived.
We’re not just holding a range — we’re coiling for the breakout.
You’re early. Stay ready.
#bitcoin
BTC?
Hi,
Next 48hrs.
We hope to see momentum to the upside.
Firm break of Insidebar H4 (high of 119800)
If this probability/theory is solid.
Expecting +^>10% movement in 1 week
All the best
Have your R:R ready.
NB/ NOT A GURU
manage well okayy
Hope all the success for youu
(note; the reversal that day was real, hurting many hodl- seller will be turning buyers soon, creating bigger momentum )

BTCUSD Bullish Move Price Tap on the W FVG and respected this POI , we can target the Buyside Liquidity above

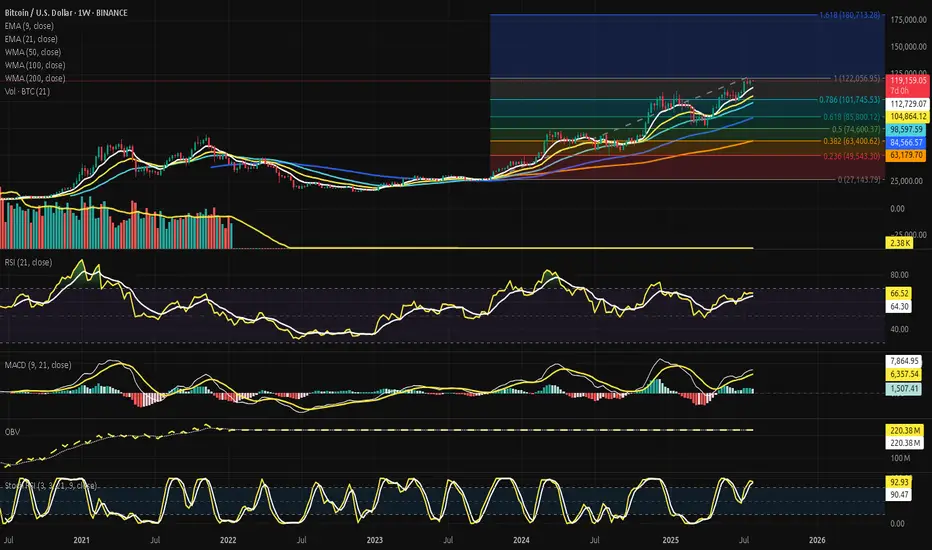
Bitcoin Weekly Seal at the Threshold 122K - No Gaps, No Retreat.⊣
⟁ BTC/USD - BINANCE - (CHART: 1W) - (Jul 27, 2025).
◇ Analysis Price: $119.374,00.
⊣
⨀ I. Temporal Axis - Strategic Interval - (1W):
▦ EMA9 - ($112.771,21):
∴ The weekly close remains above the EMA9, preserving short-term bullish structure;
∴ The EMA9 continues rising at a consistent slope, reflecting sustained upward momentum;
∴ A retracement to this level would represent the first defensive support on a tactical pullback.
✴️ Conclusion: EMA9 acts as a dynamic short-range support and trend continuation marker.
⊢
▦ EMA21 - ($104.883,22):
∴ Price remains notably above the EMA21, confirming structural strength in medium-term trend;
∴ The EMA21 was previously retested during consolidation in Q2 2025;
∴ A weekly close below it would indicate a structural loss of momentum.
✴️ Conclusion: EMA21 confirms medium-term bullish bias as long as preserved.
⊢
▦ WMA50 - ($98.605,81):
∴ WMA50 serves as a major cyclical support and remains untouched since early 2024;
∴ The gap between price and WMA50 indicates strong extension, yet risk of mean reversion rises;
∴ This level aligns with a prior demand zone around ($95K–$100K).
✴️ Conclusion: WMA50 is a latent demand zone - strategic if market reverts from exhaustion.
⊢
▦ WMA100 - ($84.570,72):
∴ This weighted average aligns with the 0.382 Fibonacci level;
∴ A long-term correction toward this band would reflect the depth of macro pullbacks in previous cycles;
∴ Currently distant from price action, but structurally significant if macro volatility increases.
✴️ Conclusion: WMA100 anchors mid-cycle recalibrations and aligns with retracement symmetry.
⊢
▦ WMA200 - ($63.181,79):
∴ The 200-week WMA remains far below price and untouched since early 2023;
∴ This is the ultimate structural support in secular bull cycles;
∴ If revisited, it signals macro-level capitulation or black swan scenario.
✴️ Conclusion: WMA200 holds the foundational line of long-term structural integrity.
⊢
▦ Fibonacci Retracement - (Range from 0 = $27.143,79 to 1 = $122.056,95):
∴ 0.000 = $27.143,79 - Genesis base from Apr 2025 cycle;
∴ 0.236 = $49.543,30 - Psychological line of control in late 2023;
∴ 0.382 = $63.400,62 - Aligned with long-term moving averages;
∴ 0.500 = $74.600,37 - Symmetry pivot of current macro-leg;
∴ 0.618 = $85.800,12 - Golden pocket lower bound;
∴ 0.786 = $101.745,53 - Golden pocket upper edge and structural resistance pre-breakout;
∴ 1.000 = $122.056,95 - Current cycle high (resistance zone);
∴ 1.618 = $180.713,28 - Projected extension target for parabolic continuation.
✴️ Conclusion: Key retracement zones for tactical reactions lie at (0.786 - $101.7K) and (0.618 - $85.8K); upside breakout target confirmed at (1.618 - $180K).
⊢
▦ Volume + EMA21 - (Last: 2.38K BTC):
∴ Volume is stable and slightly rising compared to prior weekly sessions;
∴ No high-volume sell candles indicate panic or exit;
∴ EMA21 on volume shows baseline liquidity remains active.
✴️ Conclusion: Healthy volume confirms orderly continuation rather than climax or exhaustion.
⊢
⨀ II. Momentum & Pressure Indicators:
▦ RSI (21) + EMA9 - (66.71 / 64.34):
∴ RSI approaches the 70-level but remains below overbought territory;
∴ EMA of RSI confirms rising internal strength;
∴ No divergence is observed - internal price energy remains aligned with upward momentum.
✴️ Conclusion: RSI signals strong but not overheated momentum - bulls still in control.
⊢
▦ MACD (9, 21) - (MACD: 7,887.99 | Signal: 6,362.06 | Histogram: +1,525.93):
∴ MACD histogram remains green, showing continuation of bullish trend;
∴ The spread between MACD and Signal is positive and expanding again;
∴ No bearish crossover threat imminent at current slope.
✴️ Conclusion: MACD structure reinforces bullish pressure - trend still intact.
⊢
▦ OBV + EMA9 - (OBV: 220.38M):
∴ OBV remains in an uptrend, supporting price action;
∴ EMA overlay shows no divergence or flattening;
∴ Volume accumulation remains healthy, confirming underlying conviction.
✴️ Conclusion: OBV supports continuation - no signs of distribution.
⊢
▦ Stochastic RSI (3,3,21,9) - (%K: 93.68 / %D: 90.72):
∴ Both %K and %D lines are in the overbought zone (>90);
∴ Crossovers are still bullish but nearing potential exhaustion zone;
∴ Caution warranted for short-term momentum correction.
✴️ Conclusion: Overbought levels reached - watch for tactical slowing, though no reversal confirmed.
⊢
🜎 Strategic Insight - Technical Oracle:
∴ The weekly chart exhibits a structurally intact bull trend, confirmed by the alignment and spacing of EMA's and WMA's across all horizons (short, mid, long);
∴ Fibonacci retracement levels delineate critical reaction zones, with (0.786 - $101.745,53) and (0.618 - $85.800,12) serving as dominant retrace supports in the event of a tactical correction;
∴ The presence of a projected (1.618 extension at $180.713,28) offers a sacred path forward should price breach and sustain above the current high of $122K.
∴ Momentum oscillators (RSI and MACD) continue their upward thrust without divergence, but the Stochastic RSI warns of temporal exhaustion - a typical hallmark before consolidation or rotation;
∴ Volume structure is stable and non-climactic, suggesting continuation rather than blow-off;
∴ No sign of distribution via OBV - accumulation remains intact.
✴️ Conclusion: The market remains within the upper chamber of the Fibonacci spiral. Tactical cooling is possible due to overextension in the momentum field, but no structural damage is observed. A controlled retrace into the golden pocket would be both acceptable and ritualistically symmetrical. The path to $180K remains open, but guarded.
⊣
⟁ BTC/USD - CME Futures BTC1! - (CHART: 1D) - (Jul 27, 2025):
◇ Current Price: $120.785.
◇ Chart Link:
⊣
▦ CME Futures GAP - Observation & Ritual Closure:
∴ The current chart shows a clustered consolidation near $120K–$121K with no immediate upper gap visible;
∴ The last prominent CME Gap was filled during the late June run-up and early July vertical move;
∴ No new gap formed during the weekend-to-weekday open for the last 3 sessions - continuity is intact.
✴️ Conclusion: There is no unfilled CME Gap between the current price and previous sessions. All recent discontinuities appear ritually sealed. Attention now turns to potential downside gaps from rapid bullish impulse moves around ($104K–$108K), which could remain structurally unfilled - unless tactically challenged during correction.
⊢
🜎 Strategic Insight - CME Oracle:
∴ The lack of open CME Gaps suggests a clean technical field - no magnet effect pulling price backward in the short term;
∴ The compression near $121K may precede either an explosive breakout toward the Fibonacci extension ($122K / $130K+), or serve as a false plateau before a tactical flush;
∴ Absence of gaps also removes "gap fill" traders from immediate relevance, allowing price to move freely based on liquidity and macro flows.
✴️ Conclusion: The CME chart confirms no active gravitational pull downward - the battlefield is neutral and favorably clean for bullish continuation, pending macro and liquidity alignment.
⊢
∫ III. On-Chain Intelligence - (Source: CryptoQuant):
▦ Exchange Inflow Total + 9EMA - (All Exchanges):
∴ Exchange inflows remain significantly suppressed, with no spikes above 75K BTC since Q4 2023, despite the price nearing $120K;
∴ The 9EMA of inflows is stable and near local lows, showing no abnormal movement toward exchanges;
∴ Historically, spikes in inflow coincide with distribution, fear, or profit-taking, none of which are currently present on a structural level.
✴️ Conclusion: The on-chain exchange inflow behavior confirms low distribution pressure at current highs. The lack of elevated Bitcoin deposits into exchanges indicates conviction among holders and the absence of a mass selloff attempt, even near critical Fibonacci resistance.
⊢
🜎 Strategic Insight – On-Chain Oracle:
∴ While price consolidates near its cyclical high, exchange inflows remain muted, echoing behavior observed during earlier phases of strong market conviction (e.g., late 2020);
∴ This suggests the market is not preparing for heavy liquidation;
∴ The silence of inflows reinforces the tactical hypothesis that current price action is organic and not panic-driven, preserving the ritual path toward ($122K/$180K).
⊢
⧉ IV. Contextvs Macro-Geopoliticvs - Interflux Economicvs:
▦ US-EU Trade Accord: 1(5% Unified Tariff Across All Sectors):
∴ The United States and the European Union have reached a comprehensive trade agreement, averting escalation: a 15% unified tariff will apply across most EU exports to the US, down from a threatened 30%;
∴ Exceptionally high 50% tariffs remain on steel and aluminum, while some industries such as automotive, semiconductors, and pharmaceuticals will be capped at 15%;
∴ Zero-tariff exemptions have been granted to strategic sectors, including aerospace, select chemicals, semiconductor equipment, agricultural products, and critical raw materials;
∴ In return, the EU has committed to invest $600 billion in US infrastructure and tech, and to purchase $750 billion worth of US energy and defense products over three years.
✴️ Conclusion: The trade pact imposes moderate cost adjustments for key industries but restores transatlantic stability. Although friction remains in sensitive sectors, the agreement prevents global trade disorder and enhances strategic economic visibility.
⊢
🜎 Strategic Insight - Macro Oracle:
∴ The accord mitigates systemic trade risk and clears geopolitical uncertainty, which would otherwise impair market confidence in risk-on assets;
∴ Predictable tariffs (15%/50%) reduce abrupt inflationary shocks, enhancing macroeconomic forecasting and central bank policy latitude;
∴ Massive EU commitments in energy and defense inject transatlantic liquidity and strengthen demand for US dollar-based assets;
∴ While European manufacturers face pressure, the global system benefits from lower volatility and restored economic symmetry;
∴ This opens room for speculative and structural capital to flow more confidently into high-volatility instruments, including crypto assets.
✴️ Conclusion: The macro backdrop reinforces the sacred bullish path - a re-alignment of order in the West, combined with non-disruptive trade stabilization, lays the groundwork for continuation of liquidity-driven risk flows. Bitcoin stands to benefit as a speculative vessel in a structurally stable yet monetarily dynamic environment.
⊢
𓂀 Stoic-Structural Interpretation:
▦ Structurally Bullish - Tactically Watchful:
∴ Price remains above all critical EMA's and WMA's on the 1W chart;
∴ Fibonacci structure is intact, with the $122K high acting as ritual resistance and the (0.786 / 0.618 zone ($101K / $85K) as sacred fallback;
∴ Momentum indicators (MACD, RSI) sustain positive bias with no divergences;
∴ CME Futures show no unfilled gaps - the field is clean, allowing strategic extension.
✴️ Conclusion: The macrostructure supports continuation higher into the sacred extension zone ($130K–$180K), with short-term vigilance warranted due to overbought Stoch RSI and reduced volume velocity.
⊢
▦ Tactical Range Caution:
∴ Upper Limit: $122.056 - Cycle high and Fibonacci 1.0;
∴ Mid Guard: $112.770 - EMA9;
∴ Structural Support: ($101,745 - 0.786) Fib retrace;
∴ Golden Anchor: ($85.800 - 0.618) Fib retrace.
✴️ Conclusion: As long as price remains above $101K, the bullish code remains sealed. Breach of $85K would unlock deeper structural reassessment.
⊢
◩ Codicillus Silentii - Strategic Note:
∴ The week closes at the threshold of the Fibonacci (1.0 mark - $122.056), beneath a ceiling forged by time and belief;
∴ All technical layers are aligned, yet the silence in the inflow, the clean CME field, and macro equilibrium whisper a rarer truth - no storm is seen, but no wind is promised;
∴ This is the zone of the Watcher - where action becomes hesitation, and hesitation becomes discipline.
✴️ Strategic Note & Final Seal: Do not confuse absence of danger with presence of opportunity. A vertical structure with no threat below can still falter from within. This is a time not to act, but to remain unshaken.
⊢
⧉
· Cryptorvm Dominvs · MAGISTER ARCANVM · Vox Primordialis ·
⚜️ ⌬ - Silence precedes the next force. Structure is sacred - ⌬ ⚜️
⧉
⊢
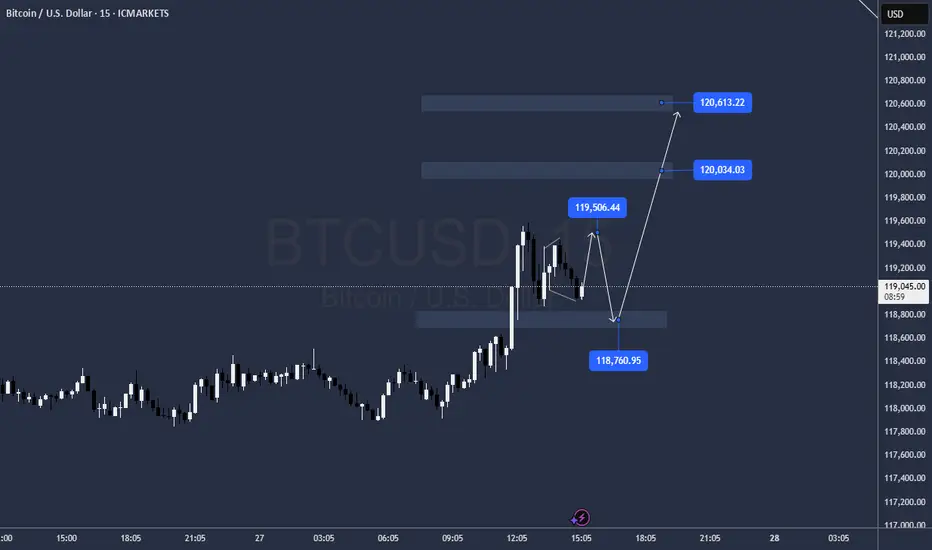
BTCUSD 15M Setup The trend is up in the 1-hour timeframe, so we are looking for buying opportunities in the 15-minute timeframe. We expect the price to fall to the range of 118,520 to 118,300 and then rise to the target of 119,600 and above.

$BTCUSD - Bullish 2025 - Cycle Wave III up (eta Dec2025)NOT FINANCIAL ADVICE
Let's start with this bullish outlook on Bitcoin and its various phases:
Here, I estimate the likelihood of CRYPTOCAP:BTC 's journey through its Cycle Wave III.

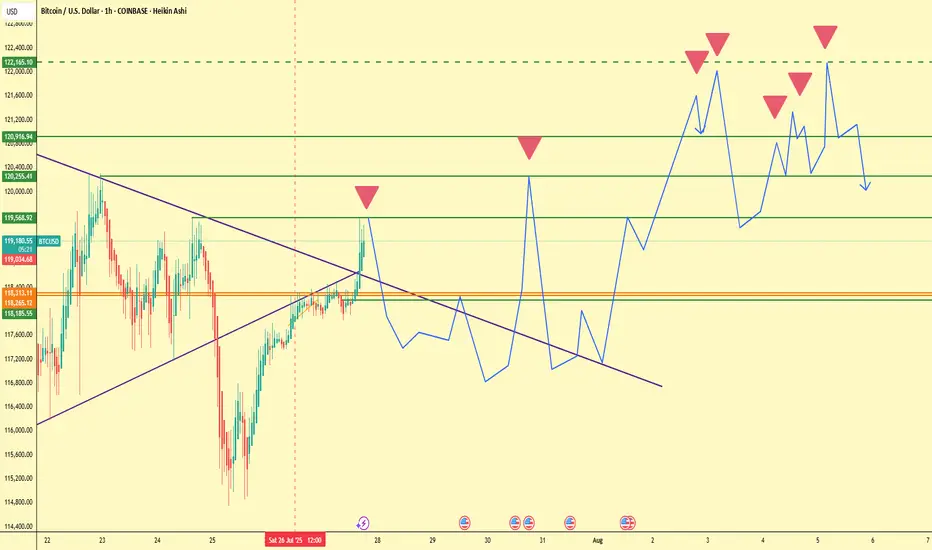
AI Generated Bitcoin Prediction: No ATH This Week! 📉 AI Generated Bitcoin Prediction: No ATH This Week! 🚫📈
Euphorisme is what traps people... watch out.
📌 Overview
In this 1H Heikin Ashi chart for BTC/USD, a clear AI-generated prediction outlines a volatile week ahead, but with no signs of a new all-time high (ATH). While price action recently broke above key resistance levels around $119,300–$119,570, the projected trajectory is more cautious than bullish.
The blue line overlay sketches a speculative wave structure — an AI-based forecast — suggesting multiple failed attempts to break above $122,165, a level that coincides with previous rejection zones.
🔍 Key Technical Levels
Level Significance
$122,165 Major rejection level
$120,916.94 Resistance + liquidity zone
$119,568.92 Immediate rejection area
$118,313.11 EMA & SMA cluster support
$118,185.55 Short-term support
$117,893.78–$118,037.81 Bull trap range
⚠️ Why You Should Be Cautious
The AI-predicted price action shows a pattern of rising highs followed by sharp reversals.
Multiple red inverted triangles suggest lower high formations, a sign of weakening bullish momentum.
Current levels around $119,300 are still within a macro supply zone, with price likely to consolidate or retrace.
🧠 Psychological Trap: Euphoric Longing
Markets often punish emotional entries — and euphoric breakouts like we saw at $119,500 tend to trigger FOMO longs. This is where smart money exits, not enters.
“If it feels like you're late to the move, you probably are.”
🔄 Mid-Term Scenario
If the AI prediction holds:
Expect volatility with fake breakouts.
Watch for distribution near $122K.
A potential drop toward $118K–$117.8K may offer a better re-entry.
📆 Macro Context
The week is filled with economic events (marked below the chart), and the AI model seems to expect choppy reactions, not a clear breakout. These red calendar icons often correlate with increased volume and traps.
🧩 Strategy Suggestion
Avoid chasing pumps into resistance zones.
Wait for confirmation or deviation from the projected path.
Consider setting alerts near $122K and $118K to monitor key reactions.
🧠 Final Thought:
ATH is a process, not an event. If the AI is right, we’re not there yet.
“Let the herd long the top, and let you short the trap.” – Smart Money
💬 Share your thoughts below. Do you agree with the AI's prediction?
🔔 Follow for more predictive insights & logic-backed analysis.
#Bitcoin #BTCUSD #CryptoTrading #NoATH #SmartMoney #TradingPsychology #EuphoricTrap #HeikinAshi #BTCAnalysis
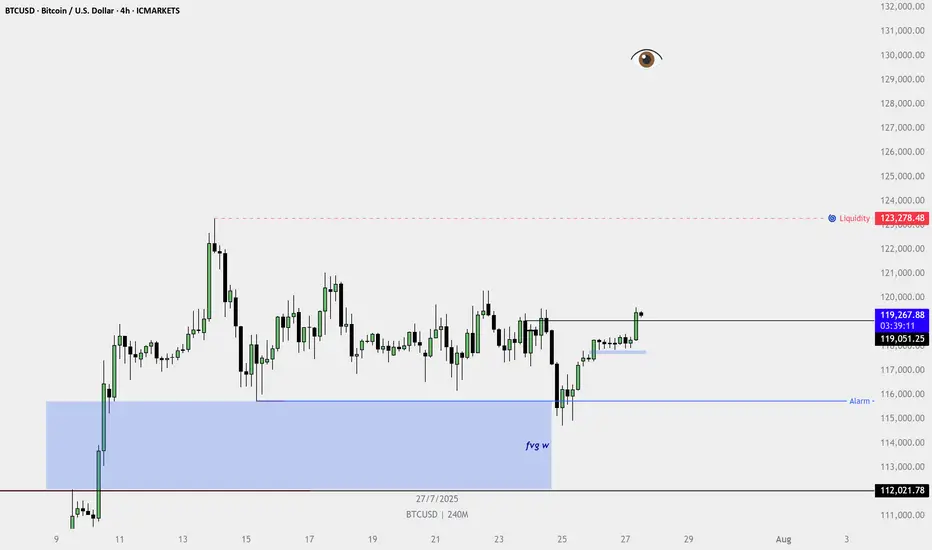
BTCUSD 4H chart is clearly showing a bullish structure.🔍 Technical Highlights:
HTF FVG Tap (Marked as "fvg w"):
Price reacted strongly from the weekly fair value gap, indicating institutional buying interest from a higher timeframe demand zone.
Higher Low + Bullish Break:
Price formed a higher low and broke above the recent swing high, confirming a shift to bullish structure.
4H Bullish FVG Formed:
After the breakout, a fresh bullish FVG formed on the 4H chart — a classic sign of momentum and continuation.
Breaker Structure Confirmed:
Price closed above a series of bearish candles, confirming buyer strength and trapping late sellers.
Internal Liquidity Taken:
The range-bound consolidation (chop) has been swept, clearing out internal liquidity and fueling the breakout.