btcusd sl;116.7k
Bitcoin is the first ever cryptocurrency to exist, which was created in 2009 by Satoshi Nakamoto and has since become the most valuable asset on the digital market. It operates without the need for intermediaries, relying solely on cryptography and netw
BTCUSD trade ideas
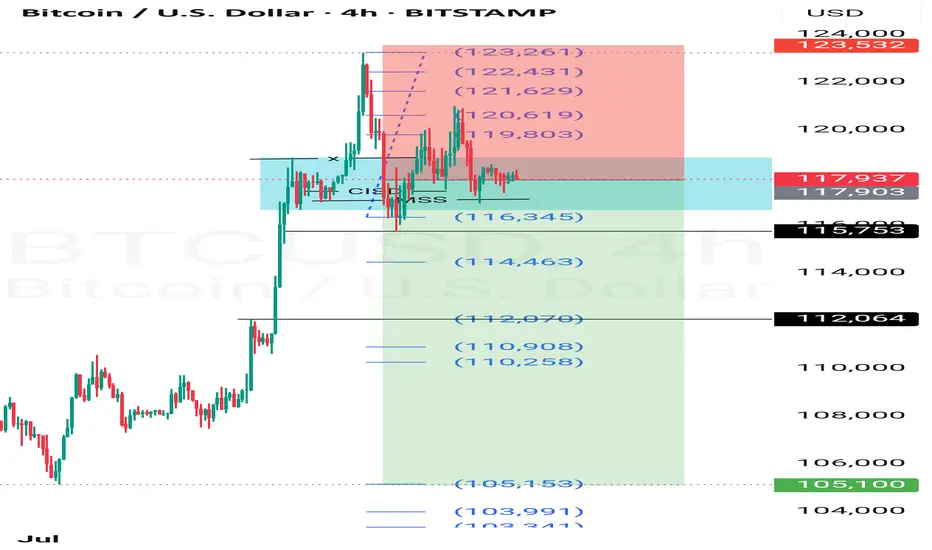
Sell BTCUSDPrice had taken liquidity and broke cisd and mss. Trump also swears to make america great again...usd should grow stronger.
What say you?
Braxons Group: How Cryptocurrency Became Part of Everyday SpendiOver the past five years, cryptocurrency has gradually moved beyond the narrow confines of a speculative asset toward what it was meant to be from the start — a fully functional means of payment. In July 2025, a study by Bitget Wallet confirmed a significant shift in consumer behavior: millions of users worldwide now use digital assets to pay for goods, games, and travel.
Braxons Group analysts see this not just as a trend, but as a clear sign that crypto is entering a mass-adoption maturity phase.
Crypto in Shopping: From Enthusiasts to Households
According to the study, 35% of users now use cryptocurrency for everyday purchases — not only for digital goods, but also for paying for food, services, and essential products.
Braxons Group notes a sharp rise in crypto payment integration with POS terminals and online marketplaces, especially in Southeast Asia, where digital wallets often replace bank cards. The growth is driven by low fees, lack of bank control, and instant settlements — particularly via USDT and BUSD.
Gaming: The Key Engagement Driver
36% of users regularly use cryptocurrency for in-game purchases and Web3 applications. This comes as no surprise: NFT items, premium memberships, and tokenized game assets are now core components of most gaming economies.
Braxons Group highlights that Gen Z and millennials form the backbone of this new crypto audience. Their willingness to spend tokens on in-game content demonstrates high adaptability and low entry barriers.
This is an important investment signal: companies operating at the intersection of crypto and gaming will likely become dominant growth drivers over the next 3–5 years.
✈ Travel: Crypto Crosses Borders
Around 35% of respondents use cryptocurrency for booking tickets, hotels, and travel services. For Braxons Group, this validates the hypothesis that crypto is the ideal tool for global users — eliminating currency restrictions, reducing banking fees, and enabling direct bookings without intermediaries.
Among older demographics (Gen X), trust in crypto for high-value transactions is increasing. This marks a shift in the market: a sector once dominated by speculation is now becoming practically useful for everyday needs.
Regional Differences
The Bitget study revealed notable geographic patterns:
Southeast Asia — leader in everyday crypto payments (up to 41%)
Africa — active use for education payments
Latin America — strong e-commerce adoption (up to 38%)
Middle East — growing interest in high-ticket purchases (cars, tech, luxury goods)
For Braxons Group, this means the decentralized payments market is becoming multi-layered and globally fragmented, requiring region-specific solutions.
Braxons Group’s Conclusion
Our team concludes that cryptocurrency is evolving from an investment class into a transactional tool. It no longer makes sense to view digital assets solely as a store of value or speculative vehicle.
What was once an experiment is now daily reality:
Gamers buy NFTs and passes with tokens.
Households purchase groceries with stablecoins.
Travelers book accommodation with ETH.
The next step? Integrating cryptocurrency into banking and government systems. For businesses, this means embedding crypto infrastructure is now a must-have for digital competitiveness.

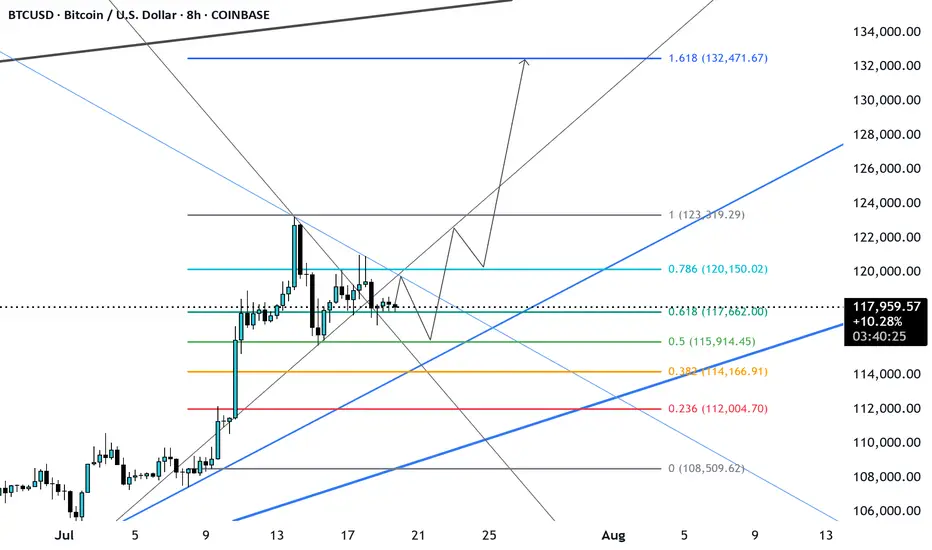
BTC Ready for the new impulse ? Elliott wave analysis 20/7/2025In my view, Bitcoin (BTC) has completed its micro correction and is now poised to move toward the $135,000–$139,000 target zone. This expectation is supported by the following factors:
1. Completion of the Sub-Waves in Wave (4)
My analysis of wave (4) indicates that it consists of an ABC correction, where wave B formed a WXYXZ pattern.
Additionally, I have counted the sub-waves within wave C of wave (4) and observed a complete 5-wave structure, suggesting that the fifth wave of wave C has ended, confirming the completion of wave (4).
2. Cypher Harmonic Pattern Pivot Point
I have identified a Cypher harmonic pattern with a pivot point around $116,600.
The termination of wave (4) occurred close to this pivot level, followed by a new impulsive move that made a higher high and formed a clear 5-wave structure—further confirming that wave (4) has likely ended.
3. Hidden Bullish Divergence on the 4-Hour Timeframe
A hidden bullish divergence can be observed on the 4-hour chart, particularly at the end of wave (a) and wave (c).
Historically, 4-hour hidden bullish divergences have often preceded strong bullish impulses. For instance, a similar setup occurred during the bullish rally from April 9, 2025, to May 22, 2025.
4. Failure to Make a New Low After Resistance Retest
The new impulse wave that emerged after the end of wave (4) has met resistance but failed to make a new low, suggesting that a fresh upward impulse is underway.
How Far Could Wave (5) Extend?
It is important to note that the wave (5) (blue) impulse is a sub-wave of wave (5) (purple).
The lengths of wave (3) (purple) and wave (5) (purple) are currently similar, which is unlikely because both are part of the major wave V (green), where typically only one wave should extend.
Since wave (3) has already completed, wave (5) is likely to be the extended wave, with a target length between 1.272 and 1.618 times the length of wave (3).
Interestingly, two Gann fan projections point to resistance levels in the $135,000–$139,000 range, which perfectly aligns with this 1.272–1.618 extension zone.
Invalidation Point
The invalidation level is around $117,000, as the micro correction within the new impulse should not drop this low.
If BTC falls below $117,000, it could imply that wave (4) has not yet completed and may be taking another corrective form.
For example, the wave (c) we currently see might only be wave 1 of a larger wave (c), or the correction in wave (b) may still be ongoing.
However, this scenario seems unlikely given the weight of evidence suggesting that wave (4) has already ended.

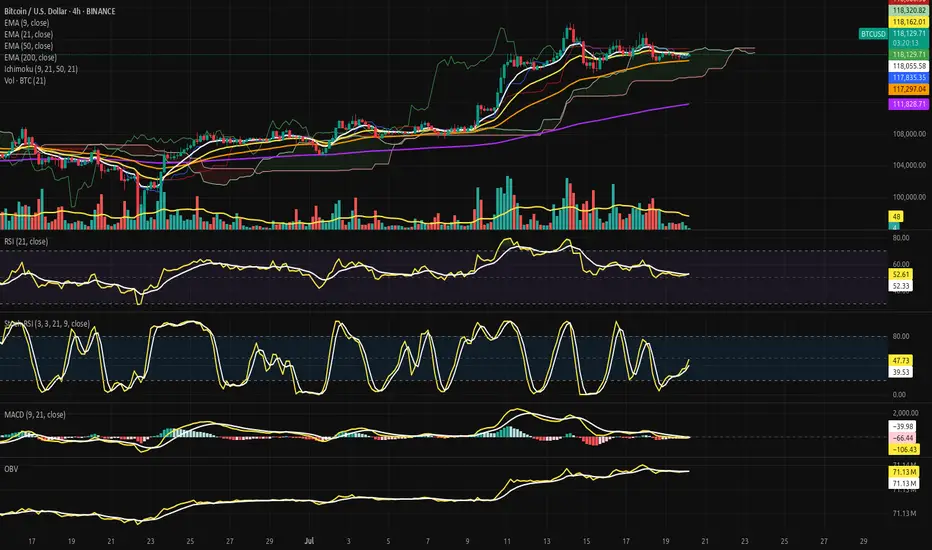
Bitcoin Suspended Beneath the Ichimoku Silence.⊢
⨀ BTC/USD - BINANCE - (CHART: 4H) - (July 20, 2025).
◇ Analysis Price: $117,919.29.
⊣
⨀ I. Temporal Axis - Strategic Interval - (4H):
▦ EMA9 - (Exponential Moving Average - 9 Close):
∴ Price is currently hovering just below the EMA9 at $118,035.43, showing weakening immediate momentum;
∴ EMA9 is now flat-to-downsloping, indicating short-term loss of control from intraday bulls;
∴ Recent candles have failed to reclaim closes above EMA9, reflecting micro-resistance and tactical fragility.
✴️ Conclusion: Logic sealed - EMA9 has lost command; tactical control has shifted to neutrality with bear undertones.
⊢
▦ EMA21 - (Exponential Moving Average - 21 Close):
∴ EMA21 currently sits at $118,164.50, acting as an overhead suppressor;
∴ The gap between EMA9 and EMA21 is compressing, signaling potential for either crossover or volatility breakout;
∴ Price action is now trapped between EMA9 and EMA50, with EMA21 forming the upper barrier of a tactical box.
✴️ Conclusion: Logic sealed - EMA21 serves as containment lid; rejection here confirms tactical indecision.
⊢
▦ EMA50 - (Exponential Moving Average - 50 Close):
∴ EMA50 rests at $117,262.74, offering foundational support within the current structure;
∴ Price has respected this level on multiple dips since mid-July, confirming its strategic function as mid-term equilibrium;
∴ The slope remains mildly upward - no sign of reversal, only compression beneath.
✴️ Conclusion: Logic sealed - EMA50 maintains its structural role as mid-range dynamic floor.
⊢
▦ EMA200 - (Exponential Moving Average - 200 Close):
∴ EMA200 remains well below at $111,765.30, untouched since early July;
∴ Its wide distance from price confirms that the broader structure remains in bullish territory;
∴ Its trajectory continues upward, anchoring the uptrend beneath all volatility.
✴️ Conclusion: Logic sealed - EMA200 secures the long-term structure; market remains elevated far above reversal threshold.
⊢
▦ Ichimoku Cloud - (9, 21, 50, 21):
∴ Price is currently within the Kumo (cloud) zone, defined between SSA and SSB - a region of ambiguity and compression;
∴ The Senkou Span A and Span B are nearly flat, signaling lack of directional command in the near term;
∴ Kijun and Tenkan lines are converged, offering no trend bias - equilibrium is dominating.
✴️ Conclusion: Logic sealed - Ichimoku confirms a neutralized compression state; breakout required for trend clarity.
⊢
▦ RSI (21) + EMA9 - (Relative Strength Index with Signal Smoothing):
∴ RSI value stands at (51.48), while the EMA9-signal rests at (52.25) - confirming a soft bearish crossover;
∴ The RSI has declined from its recent peak and now oscillates around the neutral 50-line;
∴ Momentum is waning without structural damage, indicating tactical cooling.
✴️ Conclusion: Logic sealed - RSI confirms suspended momentum; structural neutrality prevails beneath fading thrust.
⊢
▦ Stochastic RSI - (3, 3, 21, 9):
∴ Current values are: (%K = 35.33), (%D = 32.68) - with %K slightly above %D, forming a mild bullish crossover;
∴ The oscillator has just risen from oversold levels, indicating potential energy buildup;
∴ Prior cycles in this zone have produced false starts, so confirmation is essential.
✴️ Conclusion: Logic sealed - Stoch RSI hints at rebounding energy, but with fragile structure and low reliability.
⊢
▦ MACD - (9, 21, 9 - EMA/EMA):
∴ MACD Line = (–105.52), Signal Line = (–129.07), Histogram = (+23.55) - confirming a bullish crossover;
∴ The crossover occurred below the zero line, indicating a possible reversal from weakness rather than strength;
∴ Slope of MACD is positive but modest - insufficient to declare dominant shift.
✴️ Conclusion: Logic sealed - MACD is in bullish transition mode, but still recovering from beneath structural base.
⊢
▦ OBV + EMA9 - (On-Balance Volume with Trend Overlay):
∴ OBV currently reads (71.13M), and is slightly above its EMA9, signaling retention of volume without strength;
∴ Volume has not left the system - but neither has it surged; this is passive accumulation at best;
∴ No divergence exists for now, but lack of buildup implies neutral positioning.
✴️ Conclusion: Logic sealed - OBV is stable and neutral; no buyer escape, but no commitment surge either.
⊢
▦ Volume + EMA21 – (Volume Profile with Trend Average):
∴ Current volume bar = (13.91), sitting below the EMA21 baseline;
∴ The volume profile across recent sessions is declining - suggesting consolidation or exhaustion;
∴ No breakout volume spike has accompanied price stabilization - trend is under silent compression.
✴️ Conclusion: Logic sealed - volume fails to validate price levels; tactical fragility remains unresolved.
⊢
🜎 Strategic Insight – Technical Oracle:
∴ The H4 structure presents a state of compression beneath a neutral cloud, suspended between tactical short-term EMA's (9, 21) and safeguarded by a rising EMA50 backbone;
∴ Momentum oscillators (RSI, Stoch RSI, MACD) converge toward reactivation, yet none have broken decisively above neutral thresholds - reflecting potential, not power;
∴ Volume participation is inconsistent and fading, offering no confirmation for breakout - the market is in silent observation mode, not assertion;
∴ Ichimoku confirms indecision: price floats within Kumo, without command or breakout - equilibrium reigns;
∴ Price positioning remains elevated above the deeper structure (EMA200), but its current zone between EMA9 and EMA50 represents a coil of indecision;
∴ The overall condition is not bearish - but it is tactically suspended, lacking conviction, awaiting external ignition.
✴️ Conclusion: The Oracle confirms - the structure is intact, but tactical initiative is lost; the field is poised, not marching.
⊢
∫ II. On-Chain Intelligence – (Source: CryptoQuant):
▦ Short-Term Holder (SOPR):
∴ SOPR currently reads (1.001), meaning short-term holders are spending coins with no significant profit or loss - a signal of economic neutrality;
∴ The chart displays persistent lateral volatility around the (1.0) threshold since early July - no emotional dominance in market behavior;
∴ This pattern historically coincides with pre-expansion compression phases, rather than breakdown events.
✴️ Conclusion: Logic sealed - SOPR confirms behavioral neutrality among short-term holders; the market remains in a state of expectation, not realization.
⊢
▦ STH-MVRV - (Short-Term Holder Market Value to Realized Value):
∴ The metric is currently oscillating around (1.30), well above the danger zone at (1.0), but far below the euphoria threshold at (1.8);
∴ The structure reflects multiple euphoria rejections, followed by a return to balance - a classic cooling-off pattern without structural failure;
∴ Convergence between market price, realized value, and short-term cost basis indicates the market is retesting foundation zones.
✴️ Conclusion: Logic sealed - STH-MVRV confirms post-euphoric cooling with structural support intact; no active trend, no breakdown.
⊢
▦ Exchange Inflow Spent Output Age Bands - (All Exchanges):
∴ Inflows to exchanges have been consistently low in recent weeks, particularly among young coins (0d–1d, 1d–1w) - showing no urgency to sell;
∴ Aged outputs (>6m) remain dormant - long-term holders are not mobilizing;
∴ The absence of inflow pressure signals no macro panic or exit event, reinforcing the diagnosis of tactical compression.
✴️ Conclusion: Logic sealed - muted inflows confirm a lack of distribution catalysts; stable structure sustains the technical silence on the 4H chart.
⊢
🜎 Strategic Insight - On-Chain Oracle:
∴ All three on-chain metrics converge into a clear state of tactical equilibrium - not bearish, not euphoric, but suspended between action and observation;
∴ Short-Term Holder SOPR stabilizes at (1.001), marking a precise psychological stasis - profit-taking and panic-selling are both absent;
∴ STH-MVRV confirms a post-euphoria cooldown with structural preservation, implying that short-term holders have recalibrated expectations without abandoning their positions;
∴ Exchange inflows remain historically depressed, with no aged coins activating - a hallmark of silent markets preparing for resolution;
∴ The chain speaks softly: no exit, no aggression, no irrationality - only latency, and the potential energy of stillness.
✴️ Conclusion: The Oracle confirms - the on-chain architecture reflects suspended initiative; nothing is broken, nothing is charged - only paused.
⊢
𓂀 Stoic-Structural Interpretation:
▦ Structurally: Bullish;
∴ Price remains well above the EMA200 and EMA50, with no breach of long-term support;
∴ All EMA's (9, 21, 50) are compressing, but retain upward trajectory - confirming structural integrity;
∴ Ichimoku Kumo holds price within a neutral band, but does not reflect a breakdown.
⊢
▦ Momentum-wise: Suspended Compression.
∴ MACD shows bullish crossover from beneath, but lacks amplitude to confirm trend reversal;
∴ RSI is parked around 50 with a bearish signal crossover - signaling stagnation, not strength;
∴ Stochastic RSI is climbing out of oversold, but with no impulsive follow-through.
⊢
✴️ Final Codex Interpretation:
∴ The H4 structure is consolidating beneath short-term resistance and within equilibrium clouds;
∴ Momentum is rebuilding, but flow remains stagnant;
∴ Buyers have not exited, but neither have they re-initiated force;
∴ The chart breathes - but does not speak.
⊢
⧉
· Cryptorvm Dominvs · MAGISTER ARCANVM · Vox Primordialis ·
⚜️ ⌬ - Silence precedes the next force. Structure is sacred - ⌬ ⚜️
⧉
⊢
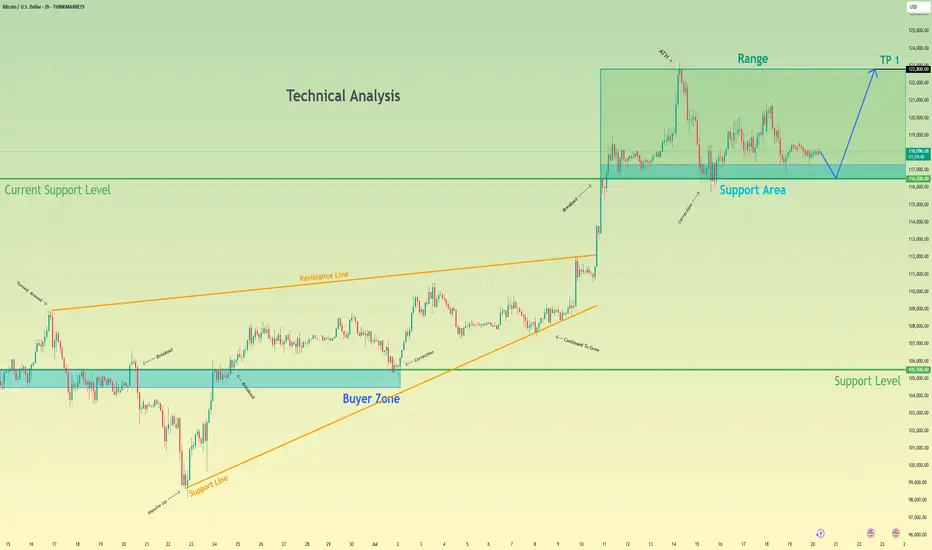
Bitcoin may bounce up from support area to 122800 pointsHello traders, I want share with you my opinion about Bitcoin. Analyzing the broader market context on the BTC chart, the past price action has carved out two significant technical structures: a wide trading range and a larger upward wedge pattern. The formation of this wedge indicates a generally positive market sentiment, though the narrowing price swings suggest a decrease in upward momentum. The foundation of the current structure was established around the buyer zone of 105500 - 104500, a level that has historically proven to be a robust floor. This historical behavior provides a critical reference for our hypothesis. Currently, we are observing bitcoin's price action closely, interacting with the current support area, located between 116500 and 117300. The character of the movement here is largely corrective and consolidative, pointing to a state of temporary equilibrium. This consolidation near the lower boundary of the wedge is a pivotal point. My thinking is that a final, brief dip to thoroughly test the 116500 - 117300 support area is a high-probability scenario. Such a move would effectively absorb remaining sell-side liquidity before a reversal. We can then anticipate an impulsive move upwards across the range. Therefore, the logical take-profit for this long position is set at 122800 points, as this level marks the upper resistance of the range and a natural target. Please share this idea with your friends and click Boost 🚀
Disclaimer: As part of ThinkMarkets’ Influencer Program, I am sponsored to share and publish their charts in my analysis.

It will be bullish but a retest must happenBTC/USD Technical Forecast: A Structurally Mandated Retracement Before the Next Major Expansion
The current market structure on the BITSTAMP:BTCUSD 4-hour timeframe strongly suggests a high-probability corrective phase is imminent prior to a continuation of the macro bullish trend. Our analysis identifies a confluence of factors, primarily a pronounced momentum divergence and significant market inefficiency, that necessitate a retracement to key support zones before a new leg higher can be sustained. The overarching strategy is to anticipate this pullback as a high-value accumulation opportunity .
Confluence of Bearish Catalysts for the Short-Term Correction:
Class A Bearish Divergence: A clear Class A bearish divergence is present between price action and the Stochastic oscillator. While the price has forged higher highs, the oscillator has printed consecutively lower highs. This momentum decay is a classic leading indicator of trend exhaustion and signals an impending shift in order flow from bullish to bearish in the immediate term.
Market Structure & Liquidity Voids (Fair Value Gaps): The preceding impulsive leg-up, while aggressive, was inefficient. It left a significant Fair Value Gap (FVG) , or a liquidity void, in its wake. According to the Power of Three (PO3) framework (Accumulation, Manipulation, Distribution), the market is now in a consolidation/distribution phase post-expansion. To engineer the liquidity required for the next major mark-up (distribution), a " manipulation " leg downwards is structurally required. This move will serve to mitigate the FVG and sweep sell-side liquidity resting below the recent lows.
Projected Price Path & Key Levels of Interest:
The Trigger - "Bearish Gate": A definitive break and close below the level marked as the " Bearish Gate " will serve as the primary confirmation for the commencement of this corrective scenario.
Corrective Targets: The retracement is expected to navigate towards the Points of Interest (POIs) nested within the FVG, as marked on the chart (Target 1, Target 2, Target 3).
Primary POI (Target 3): The ultimate objective for this retracement lies within the $110,000 - $111,000 confluence zone . This area represents a powerful technical, a key Fibonacci extension, and the macro ascending trendline.
The Bullish Continuation Scenario:
Upon successful mitigation of the FVG and a confirmed bullish reaction from our primary POI, we anticipate the resumption of the primary bullish order flow. This corrective phase will have effectively cleared out weak hands and built the necessary liquidity for a sustained move. The price is then projected to trend upwards within the blue ascending channel, with the ultimate target being the buy-side liquidity resting at the major resistance block located in the $124,000 - $125,000 region.
Conclusion:
The current setup presents a classic counter-trend opportunity within a macro bullish framework. The confluence of momentum divergence and structural necessity for FVG mitigation provides a high-conviction thesis for a short-term sell-off.

TheKing Cycles- Nothing can be perfect in Life or in Trading, but you can always brighten up your day.
- Remember "Cycles are Cycles"
- Everything is in graph
- You can follow bears, predicting 10 years of recession, but we are in a big recession and for a long time already.
- You can fall in the deep and predict the darkness.
- i like to see the sunshine in the morning and i will always radiate warmth.
- Follow Hope, and always believe in your own judgement.
- Be Bold and do the opposite of what commons peoples think.
Happy Tr4Ding !

Capital Doesnt Lie - The Energy ProblemPart 1: THE ENERGY PROBLEM
Everything we do produces energy, even prayer. If you have ever felt tired after praying for someone, that's because you spent energy and made an effort; let's call that energy 'capital' . Capital begins with effort, whether you see it or not.
The problem is: how do we use it or store it?
Imagine that energy as an invisible ball growing in front of your head. Every time you work and think, you're growing that invisible energy ball of capital. So, how do you get it in your hands? You can plant a cucumber, craft a chair, or clean your house. It's your order, attention, time- all energy made visible in the house, stored in the cucumber or the chair.
Genesis 3:19
'By the sweat of your face you shall eat bread…'
Verse Comment: It doesn't say 'by luck' or 'by inheritance.' It says by sweat. That's energy. That's effort. That's the value produced.
Proverbs 14:23
'All hard work brings a profit, but mere talk leads only to poverty.'
Verse Comment: Effort always creates something. Even spiritual labor, such as intercession, leadership, and parenting, is a form of value creation.
But here's the issue. That cucumber plant? It goes bad. That chair? It breaks. That clean house? Dirty again in 24 hours."
Everything we do has a cost; it's not free. Energy fades unless you can find a way to store it longer than the life of the thing you created.
So if everything fades, the big question becomes: How do you store the surplus of your energy, (the part you don't need today) so it doesn't fade by tomorrow?"
That's the foundation of all capital. Of all value. And of all wealth. And it starts with understanding where your energy is going, and what it's pouring into.

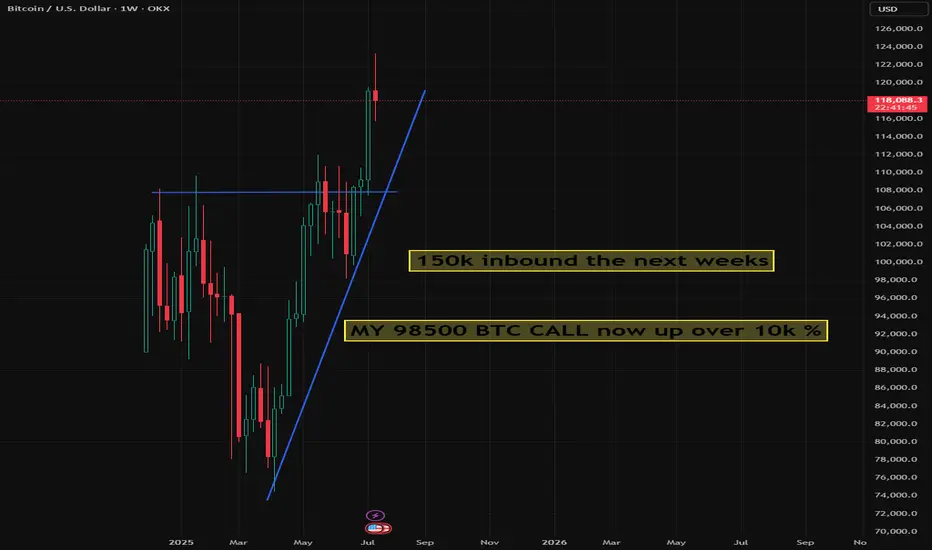
BITCOIN LOG UPDATESThis meaningful indicators on logarithmic, Since 2022- now I still used this on BITCOIN.
it works, some of my followers doubt this but its fine, we might see 170k per bitcoin by end of this year? This predictions base on the logarithmic , this indicator shows how the supply works with only 21M bitcoins, unlike other commodities. Bitcoin is the most followed commodities on this indicator I rarely used.
Youve come here so far to know bitcoin, here is my chart for this year. It will keep Bitcoin hard to buy until it reached a million per coin, then the public regret it.
Keep the word DCA. Goodluck.
Holding it is the key.

$BTC dominance still progresses !bitcoin rsi and macd still is very dominant. aswell as the reversal that just happened in the past few hours.
i look to see 120k BTC by tuesday afternoon. at 1pm est time. considering all chart indications that i use. stay tuned and follow for more.
BTCUSD Outlook – Probabilistic Trade Setup in AI Liquidity Cycle
📈 BTCUSD Outlook – Probabilistic Trade Setup in AI Liquidity Cycle
🧠 WaverVanir DSS | VolanX Protocol | SMC x Institutional Forecast Alignment
We are now entering a pivotal BTC phase. Multiple timeframes and AI-backed forecasts converge on a low-volatility accumulation breakout, with price structure aligning for a leg toward $127K–134K. However, short-term model dispersion requires precise risk management.
🧠 Technical Confluence (SMC + Fib):
Clean BOS + CHoCH confirms bullish structure
Retest of equilibrium zone around $116.8K–$117.2K
Institutional FVG demand sits at $115.4K
Fibonacci extensions align with:
🎯 Target 1: $127,065
🎯 Target 2: $133,182
🎯 Max Extension: $134,397
🌐 Macro + Fundamental Catalysts:
Spot BTC ETF inflows remain net positive
AI liquidity theme continues to push institutional demand into BTC and ETH as non-correlated inflation hedges
Fed pivot odds increasing toward Q4 → expected risk-on environment
U.S. CPI cooling, potential for weaker dollar = BTC bullish
Bitcoin dominance holding near highs
🔐 Risk Metrics (WaverVanir DSS):
Metric Value
Forecast 30D Return +3.4% ($122,072.54)
Confidence Interval $105K – $125K
Model Agreement 2/9 Bullish
Prediction Volatility 14.45%
Sharpe Ratio 1.29
Max Drawdown (forecast) 32.9%
Direction Confidence 72.3%
🎯 Trade Setup (VolanX DSS Model + SMC Confluence):
Parameter Level
Entry $118,000–$117,200
Stop Loss $112,528 (4.7%)
Target 1 $120,443
Target 2 $122,072
Target 3 $127,065 (extended)
Target 4 $133,182–$134,397 (macro projection)
Position Size 25% of capital
Time Horizon 7–30 Days (Scalp + Swing Tiered Model)
📊 Probabilistic Scenarios (Next 30 Days):
Scenario Target Range Probability Notes
🔼 Continuation (DSS Base Case) $122K–$127K 60% Model + SMC aligned
⏸ Accumulation Zone $116K–$119K 25% Rangebound/Equilibrium trap
🔽 Breakdown <$112.5K 15% Triggered by macro shock or liquidity flush
📌 This setup is front-tested using the WaverVanir DSS system, institutional ensemble models, and real-time SMC structure. Not financial advice – for educational and strategic insight purposes only.
#WaverVanir #VolanXProtocol #BTCUSD #BitcoinForecast #CryptoStrategy #SmartMoneyConcepts #FibonacciTargets #AITrading #InstitutionalCrypto #MacroAnalysis #TechnicalSetup #RiskManagement #TradingSignals #QuantitativeModels #Bitcoin

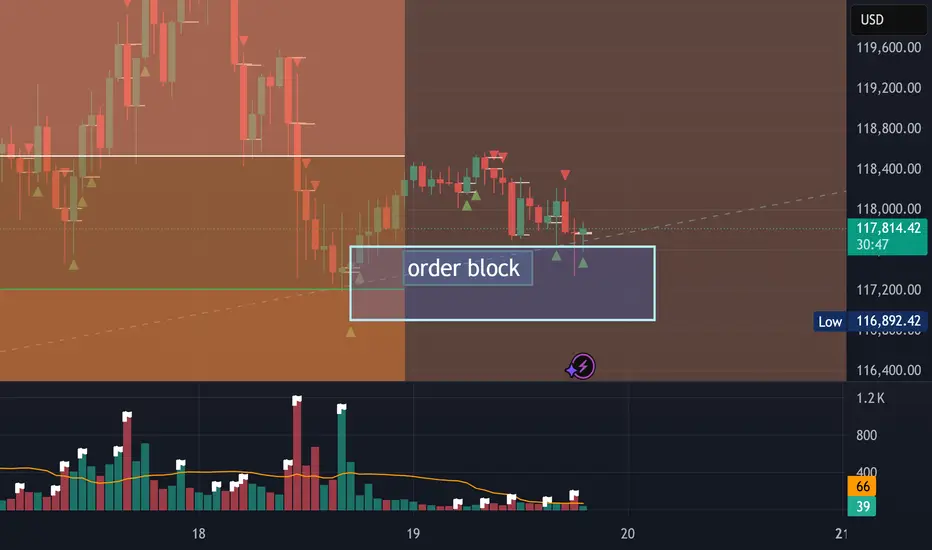
Order Block reached looking for a breakout to our Target of 132KWe saw a bottom when we hit just below 116 and 117 has been showing good support. Bulls are building up for a push up to a new high again. I have targets of 128-132K and the energy in the Fibs show we are likely going to break 160k this summer in the next few weeks or months.
Btc outlook A simple outlook on Bitcoin
A corrective sell-off to gain some momentum.
The yellow zone is crucial and must hold without being broken.

BTCUSD bullish scenario will it go ATH 1,30,000+BTCUSD is currently in A bullish trend and it took the first support at 115900 which 0,5 fib and next at 117500 which 0.618 fib, the price is likely to go up target can be around 1,25000 and then to 1,30,000( weekly chart shows this target). Price should not fall below 115500,in this case it may further go down and take support around 1,10,000-1,12,000.
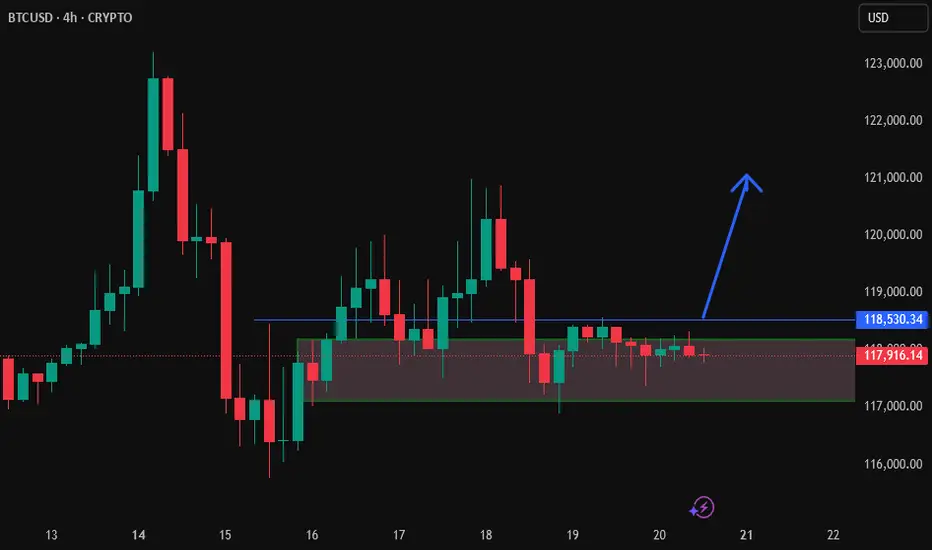
BTCUSD Technical Analysis | Smart Money Concept (SMC) BreakdownBTCUSD Technical Analysis | Smart Money Concept (SMC) Breakdown
🧠 Smart Money Market Structure Insight
📌 Key Elements Identified:
BOS (Break of Structure): Multiple BOS points indicate bullish intent early on. However, the latest BOS on July 14 followed by a significant drop signals a shift in momentum—possibly a distribution phase.
Liquidity Sweep: Price swept prior equal lows/liquidity before reversing, a typical Smart Money trap setup.
FVG (Fair Value Gap) / Imbalance: Identified around the mid-section of the chart—price filled partially but failed to hold, suggesting internal weakness.
Strong Support Zone (Demand Area): Marked between 115,000 - 114,640; this zone is anticipated to act as a springboard for bullish reversal.
📉 Current Price Action Observation:
BTCUSD is hovering around 118,152 - 118,560, moving sideways with lower highs indicating compression.
Price is projected to form a "W" pattern or double bottom in the shaded region.
Expected liquidity grab beneath 115,902 followed by potential bullish reaction targeting 121,562, as indicated by the white arrow.
🧩 Strategic Outlook & Potential Play:
🔻 Bearish Sweep First:
Market likely to sweep the support one more time, tapping into deeper liquidity pools between 115,000–114,640.
This is aligned with the concept of Smart Money hunting for retail stop-losses before reversing.
🔼 Bullish Recovery After Sweep:
Strong probability of bounce due to presence of:
Fair Value Gap (already tested),
Fresh demand zone,
Liquidity grab setup.
Projected Bullish Target: 121,562
Confirmation Needed: A strong bullish engulfing or BOS on lower timeframes near support.
🏷️ Conclusion:
This BTCUSD setup is a textbook Smart Money scenario: BOS ➝ Liquidity Grab ➝ FVG ➝ Reversal from Demand. Traders should wait for confirmation from the support region before entering long positions.

A small pull back for Btc A small pull back for Btc , in the weekly it will look like a fake out but it’s a wait and see

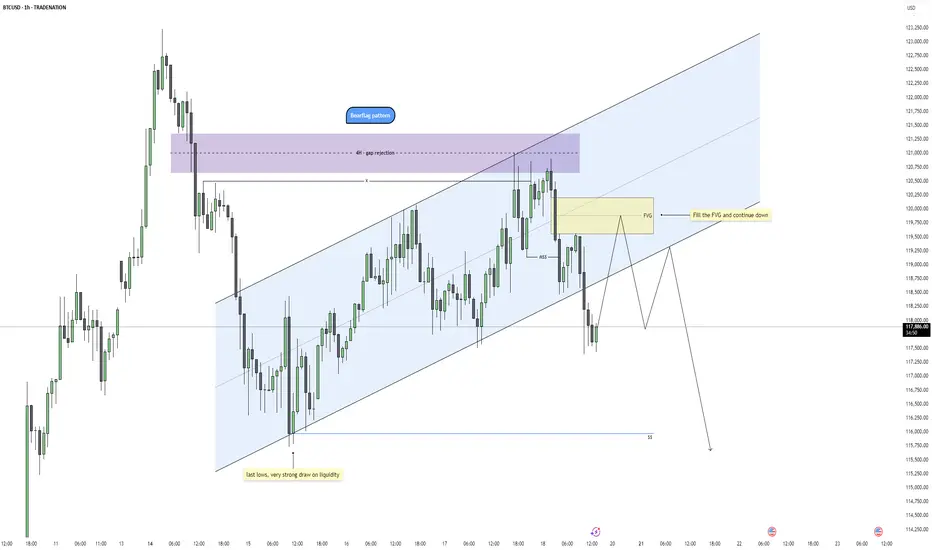
Bitcoin - Bearflag Structure Taking ShapeBitcoin is showing signs of weakness after a clean rejection from a 4H fair value gap, where price also swept the previous swing high. This aligns well with a broader bearish context as the market failed to sustain above the upper bounds of the trend channel, indicating potential exhaustion of the bullish correction.
Rejection Zone and Fair Value Gap
The rejection took place precisely within a 4H imbalance, adding confluence to the idea that this was a premium retracement in a bearish leg. The high formed inside that zone has now been swept, setting up conditions for distribution. A smaller 1H fair value gap was also left behind during the displacement move down, creating a clean area for price to return to and potentially react from.
Channel Structure and Bearflag Formation
Structurally, price has been climbing in a rising channel that resembles a bearflag pattern. The recent market structure shift broke the channel low, confirming that the rising structure is likely corrective. The rejection from the top of the flag and the subsequent breakdown align with a typical bearflag setup, suggesting a continuation move to the downside.
Short-Term Retracement Expectation
Before the next leg down, price may retrace to fill the unmitigated fair value gap while possibly sweeping the minor swing high that caused the current drop. This retracement would offer a premium shorting opportunity in alignment with the bearish bias, especially if internal structure remains weak on the lower timeframes during the return to the FVG.
Draw on Liquidity and Price Objective
The main objective for this setup is a sweep of the last equal lows near 115950, which represents a strong draw on liquidity. If the bearflag setup plays out fully, this area is highly vulnerable and could be the next significant target once the FVG is filled and lower timeframe distribution confirms.
Conclusion
Price has rejected from a 4H imbalance and swept liquidity to the upside, forming a clean bearflag structure. As long as price remains below the recent high and fills the 1H FVG without invalidating the shift, the path of least resistance looks to be down toward the liquidity resting below 115950. I’ll be watching for signs of weakness during the return to the FVG for a potential short trigger.
Disclosure: I am part of Trade Nation's Influencer program and receive a monthly fee for using their TradingView charts in my analysis.
___________________________________
Thanks for your support!
If you found this idea helpful or learned something new, drop a like 👍 and leave a comment, I’d love to hear your thoughts! 🚀
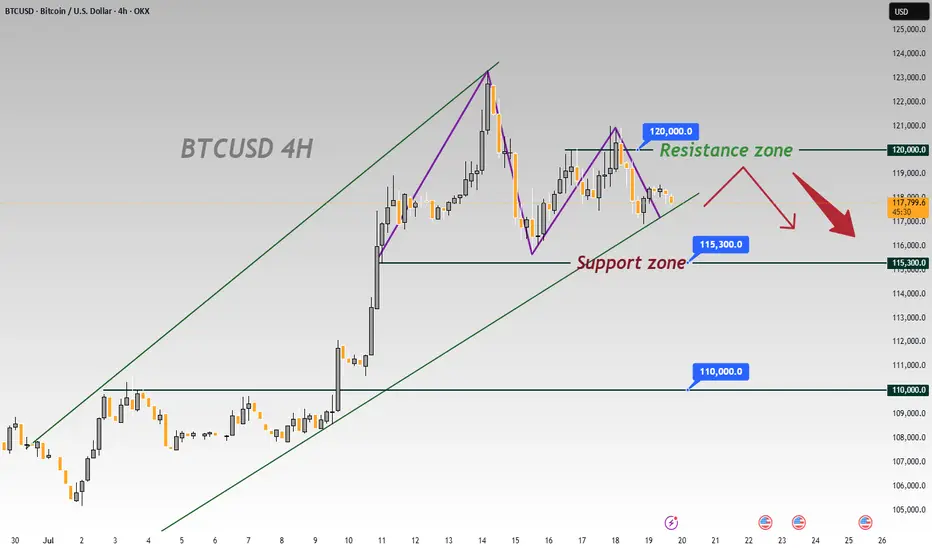
BTCUSD 4-Hour Chart Analysis: Range-Bound Trends & Key LevelsFrom the 4-hour chart of BTCUSD, the recent price movement shows obvious range-bound characteristics 📊. The upper zone around 120000 forms a key resistance level 🛑, where the bullish momentum has waned after encountering resistance 💨.
The lower level of 115300 is a significant support zone 🛡️. Previously, there was some buying support when the price retraced to this zone 👀. However, as the current price is pulling back from the resistance zone ↘️, if the bearish force takes the lead subsequently 🐻, the possibility of breaking below the 115300 support will increase ⬆️. Once it breaks below effectively 💥, the next key support level of 110000 will most likely become the target for the price to decline towards 🎯.
In terms of the short-term trend 📈, due to the obvious suppression from the resistance zone 🚧, the price will most likely continue the rhythm of testing the support downwards 🔽. In operation, one can pay attention to the breakdown situation of the support zone and layout trades accordingly 📝. Meanwhile, be alert to the possibility of a rebound after the price finds support in the support zone 🚀, and further confirmation of the direction needs to be combined with real-time K-line patterns 📊, trading volume 📈
🚀 Sell @119500 - 118500
🚀 TP 116500 - 115500
Accurate signals are updated every day 📈 If you encounter any problems during trading, these signals can serve as your reliable guide 🧭 Feel free to refer to them! I sincerely hope they'll be of great help to you 🌟 👇
BTC 106500 Liquidity Sweep BTC need liquidity sweep 🧹 biggest one before pump price to new ATH to 138500 so be ready for buy the dip 106500 buy area means sell now buy later on

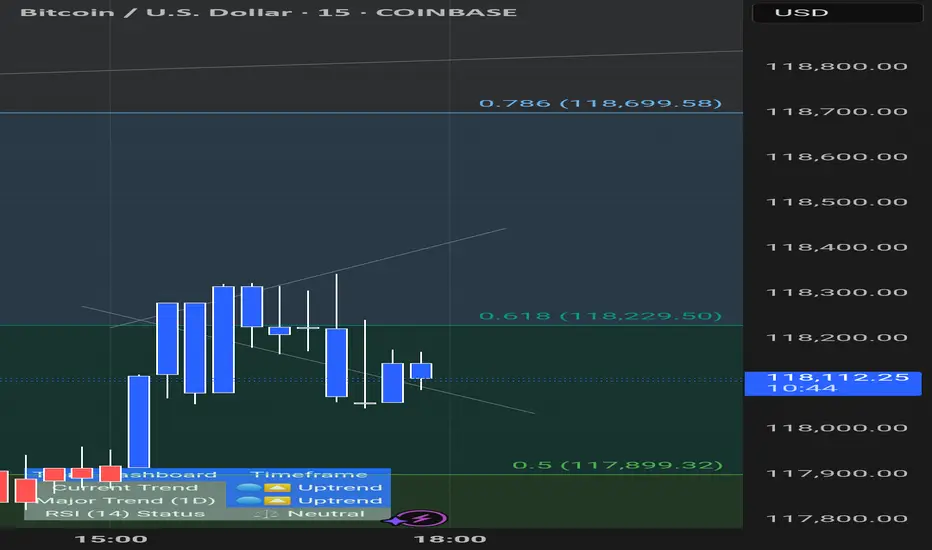
CRYPTO-BTCUSD-SHORT TERM- SELL-SCALP PREDICTIONThe market made an impulsive move to the downside Friday 7/18/25 starting at 2am, leaving a FVG on the hourly, Price has retraced back to the hourly FVG around 118,511, expecting the market to temporarily sell off before move back to the upside. First TP is 116,914.
