Bitcoin Buy analysis/ideaThis analysis is based on the 4-hour and 1-hour timeframes and executed using Supply and Demand trading and trend formation. Complete explanation in the video!
BTCUSD trade ideas

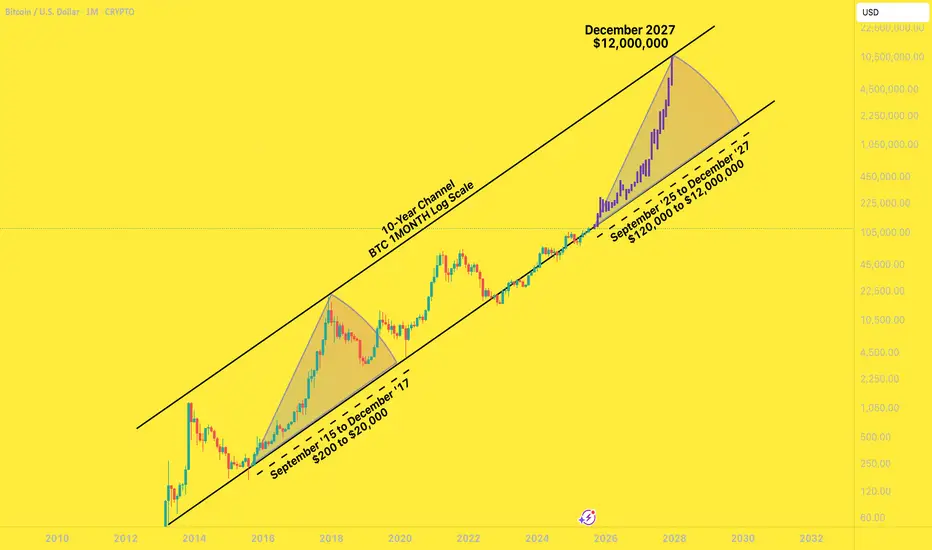
BTC to $12,000,000 December '27I had a years-old bookmarked chart from @MillionaireEconomics that I wanted to update and pick a random, extremely bullish candle pattern from the last time BTC came off the bottom channel to slap on it.
Riddle me this:
Why shouldn't Bitcoin go to $12,000,000 by December 2027?
Saylor continues to lead the way for global companies to scramble to build their own BTC warchests. These early adopters are having investor money dumped into them by the truckload.
Countries are stacking BTC
The BTC ETFs are a smash hit
Trump is all for making his own multi-billy family bitty stack
Mid-curvers will sell far too early, for far too little.
In the next two years, you'll be bombarded with countless, seemingly good reasons to sell your Bitcoins for hundreds of thousands of dollars - and then millions of dollars.
A shocking number of people will be far too early to sell. They will wake up in a cold sweat, night after night, haunted by their "could-have-been" stack, the number that updates in their head ten times a day, going up by six or seven figures a day .
... until they FOMO right back in at $11,999,999.
BTCUSD 7/16/2025Come Tap into the mind of SnipeGoat, as he gives you a Full Top-Down Analysis with a Deep Dive Down into the 30min Timeframe. This is One you don't want to miss.
_SnipeGoat_
_TheeCandleReadingGURU_
#PriceAction #MarketStructure #TechnicalAnalysis #Bearish #Bullish #Bitcoin #Crypto #BTCUSD #Forex #NakedChartReader #ZEROindicators #PreciseLevels #ProperTiming #PerfectDirection #ScalpingTrader #IntradayTrader #DayTrader #SwingTrader #PositionalTrader #HighLevelTrader #MambaMentality #GodMode #UltraInstinct #TheeBibleStrategy

BTCUSD – Potential Head & Shoulders Forming⚠️If and only if the price break below $115,000
⚠️ BTCUSD – Potential Head & Shoulders Forming
Pair: BTC/USD
Timeframe: 4H
Pattern in Focus: Head and Shoulders
Key Neckline: ~$115,000
Confirmation Trigger: Only valid if price breaks below the neckline zone with strong volume
🧠 Idea Summary:
Bitcoin has formed what appears to be a classic head and shoulders pattern. The right shoulder is completing, and the neckline is clearly respected. A break below $115K could confirm this bearish setup, with a measured move pointing toward the demand zone between $108K–$109K.
📌 Watch for:
Volume spike on breakdown
Retest of neckline turning into resistance
Potential long setups only if price reclaims $119K+
Bias: Bearish if $115K breaks. Neutral until then.

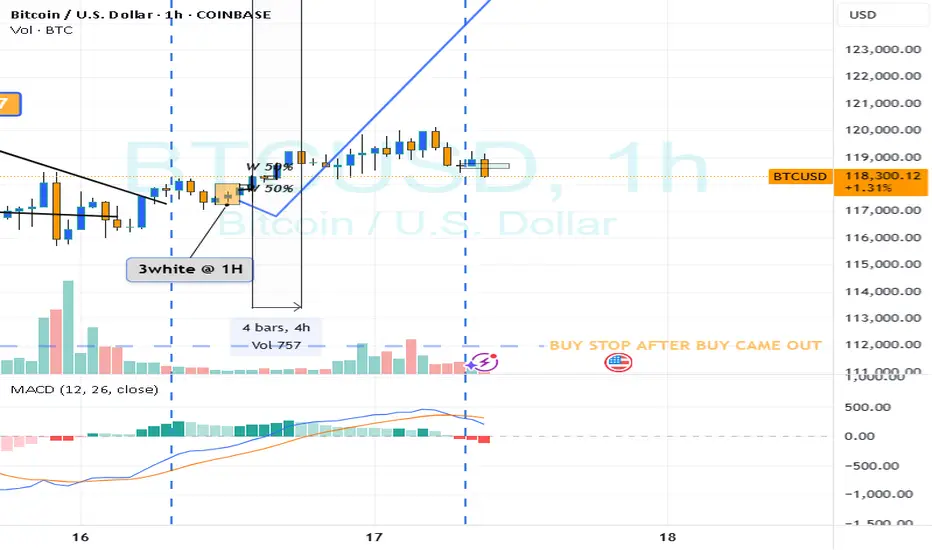
BTC intra? RECAP
Hi
Hope yest was a successful day trading for you.
Initial Bias for the DAY was up
I found : 3 white soldiers
Instant entry at found
or wait for retrace and my stop was below pattern
Profit. take when satisfied
So very important what risk i put in
say 100$ for a trade would be happy at 200$-300$
1:2 /3
or whatever i'm willing
adjusting to every trade
Easier said than done; your confidence will suddenly peak
You'll push your luck .. n risking way more than should
Be discipline
I hope the force will be with you.. n be lucky in 99.999% of the time
Not a guru
*& sharing is not a sin
nb/ all guru can slideee :)
Looking for your nx entry???
Bullish Patterns - will be in pdf in www
If new; print it
trade when see one (forexbee.co)
Do 20-50 trades.
Journal it.
Then your report card; positive or negative
pass or fail, is the pattern in web telling you the truth or lie
You decide
I hope your confidence will spike and won't depend on anyone anymore.
It's like learning to walk..
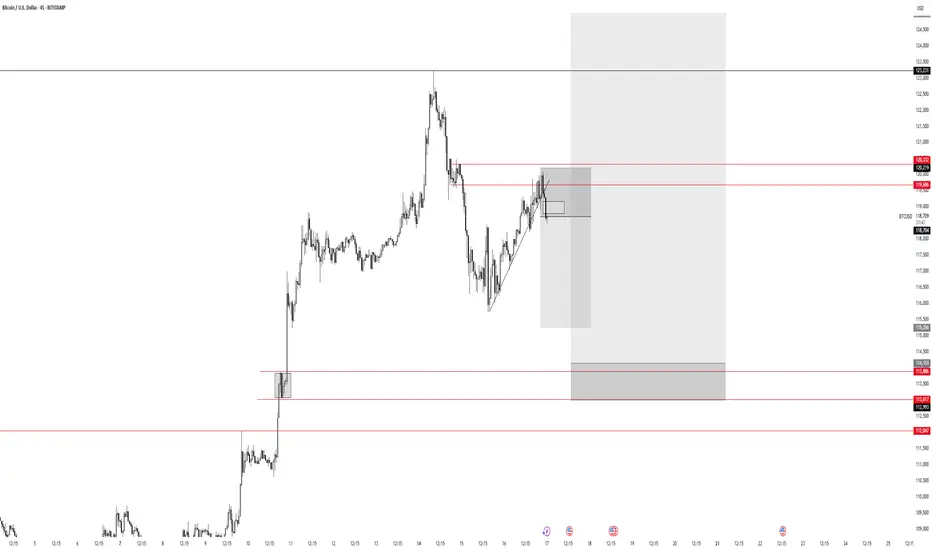
BTC FORECASTExpected push to the downside(below 114,400 region)
Breakout above current marked high.
Expected ATH(125,000) as target.
Best Regards,
Gideon Stephen (GS)
#bitcoin #crypto
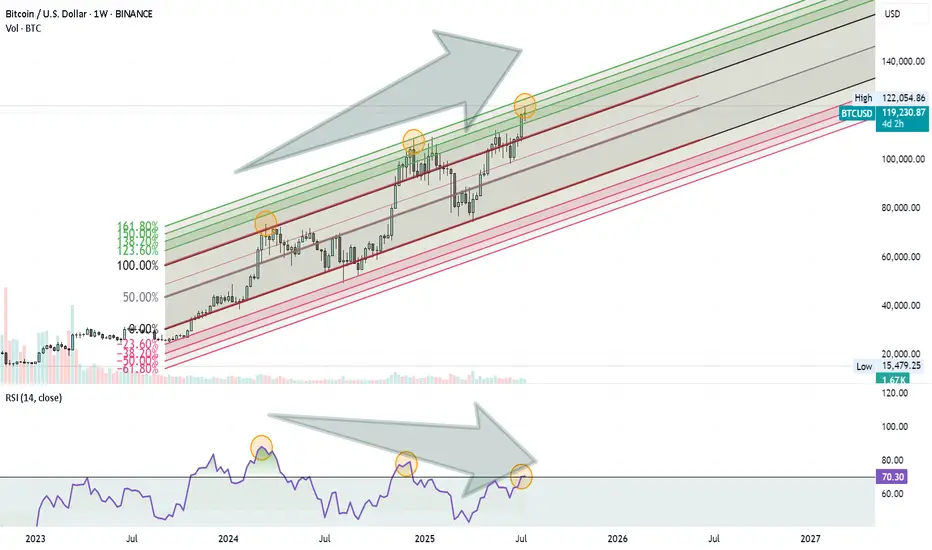
Bitcoin Rally Losing Steam?Bitcoin might be approaching a Turning Point . Here’s what I’m seeing on the weekly chart:
Price is moving inside an ascending Fibonacci channel.
It’s getting close to the 1.60 (160%) extension level, which has acted as a reversal zone before.
At the same time, the RSI is showing a clear negative divergence, suggesting that momentum is weakening.
These signs combined could mean we’re not far from a significant correction.
Nothing is confirmed yet, but it’s a setup worth keeping an eye on.
BTC USDT 135k TARGET. BTC USDT going to cross the 135k mark by the year end before cooling off.
HISTORY REPEATS ITSELF.

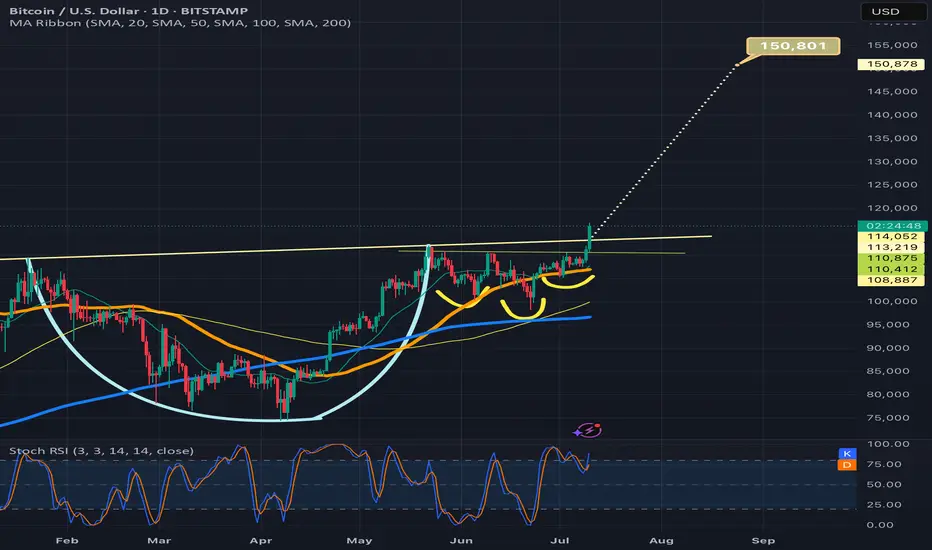
Btcusd breaking above cup and handle necklineIf it confirms the bullish breakout the target is 150k. Also by breaking above 116k and solidifying that level as strong support, we will trigger an even bigger inverse head and shoulders pattern (not shown here) with a breakout target around 208k! I will provide a link below to the chart I posted of that pattern. Thanks for reading, liking, and following. *not financial advice*
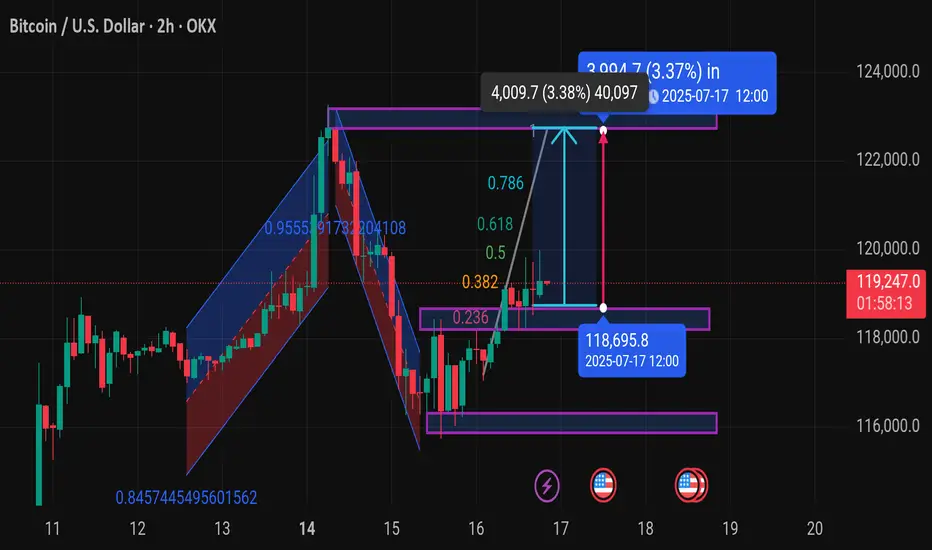
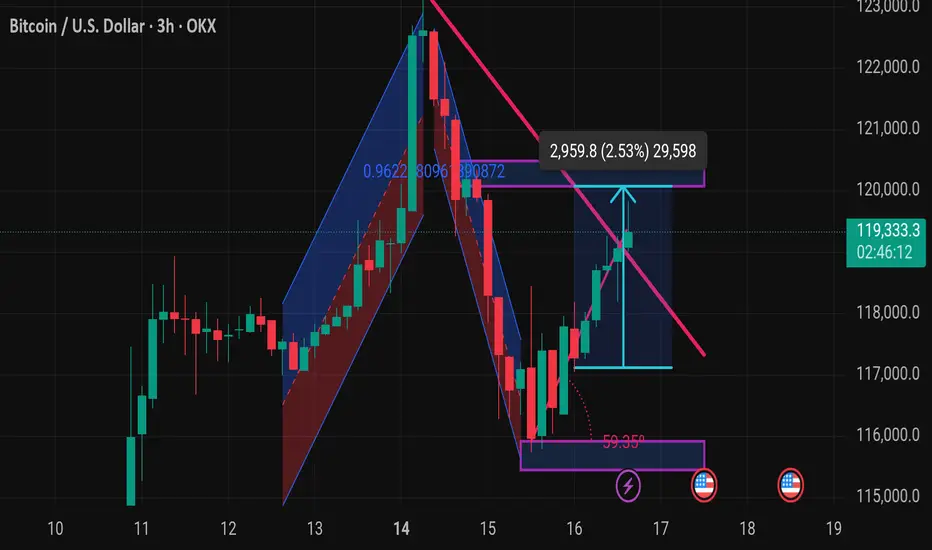
Btcusd techinical analysis.Chart Overview (BTC/USD - 2H, OKX):
Current Price: $119,240.5 (+1.23%)
Key Zones:
Support Zone: Around $118,695.8 (highlighted for July 17, 12:00)
Resistance/Target Zone: Around $123,250 (based on the measured move)
Fibonacci Levels: Drawn from the recent swing high to swing low
Important retracement levels: 0.236, 0.382, 0.5, 0.618, 0.786
Price is currently testing the 0.5–0.618 zone, which is a common area for potential breakout or rejection
Potential Price Move:
Bullish Projection:
Upside target of $4,009.7 (3.38%) from the breakout area
Reaching the $123,250 range by July 17 at 12:00 (UTC)
Technical Patterns:
It looks like you're tracking:
A potential bullish breakout from a consolidation range
Possibly a bullish flag or continuation pattern
Momentum is shifting after a clean bounce off the 0.236 zone
---
Let me know if you want:
A deeper analysis (e.g., RSI, MACD, volume)
Confirmation for long/short entries
Risk management suggestions
What’s your goal here — are you planning to trade this move or just analyzing the pattern?

BRIEFING Week #29-30 : BTC stalling, ETH & then Alts ?Here's your weekly update ! Brought to you each weekend with years of track-record history..
Don't forget to hit the like/follow button if you feel like this post deserves it ;)
That's the best way to support me and help pushing this content to other users.
Kindly,
Phil

BITCOIN- MONSTER ORDERS IN THE BOOK -> You Know What This Means COINBASE:BTCUSD “Monster orders” are exceptionally large buy-limit orders clustered roughly 7 % beneath the current market price.
Large buy-limit walls can act like a price magnet—deep liquidity attracts algos and traders hunting fills, often pulling price straight toward the level.
Once the wall absorbs the selling pressure, the magnet flips: liquidity dries up, supply thins, and price can rip away from that zone with force.
They create a visible demand wall in the order book, signalling that whales / institutions are ready to absorb a dip and accumulate at that level.
Price will often wick into this zone to fill the wall, then rebound sharply—treat the 7 % band as potential support or entry.
Such walls can act as liquidity traps : market makers may push price down to trigger retail stop-losses before snapping it back up.
Confirm that the wall persists as price approaches and that spot + derivatives volume rises; if the wall disappears, it may have been spoofing.
Always combine order-book context with trend, momentum and higher-time-frame support for higher-probability trades, Just like the extremely powerful indicators on the chart.
🚀 Marty Boots | 17-Year Trader — smash that 👍, hit LIKE & SUBSCRIBE, and share your views in the comments below so we can make better trades & grow together!

Bitcoin positive diversion to $131,000Using fibonacci retracements for price targets based off of positive divergences on the 15 min time frame and hourly time frame. I am utilizing 2 ioscilating indicators: RSI length is 36 with smma at 50 and the Chande momentum oscillator with a length of 24. My conservative estimate is $131,000 for a safe trade close. $132,400 exact area for pullback to $128,500?

Bitcoin -> The bullrun is not over!📣Bitcoin ( CRYPTO:BTCUSD ) is still totally bullish:
🔎Analysis summary:
A couple of months ago Bitcoin broke above the previous all time high. This was basically just the expected creation of new highs, perfectly following the underlying cycles. With respect to the long term rising channel formation, this bullrun on Bitcoin is just starting.
📝Levels to watch:
$100.000
🙏🏻#LONGTERMVISION
Philip - Swing Trader

Bullish Correction Complete — Targeting 125,500–126,000Market Overview:
After a strong bullish impulse, BTC retraced to the 116,000–117,000 support area and is now showing renewed momentum. The current price action suggests a move toward the 125,500–126,000 target zone.
Technical Signals & Formations:
— Completed ABC corrective structure
— Weekly support held at 116,000–117,000
— Price bouncing from 144 EMA
— Break above local resistance confirms bullish continuation
Key Levels:
Support: 117,000, 116,000
Resistance: 123,300, 125,500–126,000 (target zone)
Scenario:
Primary: holding above 119,000 opens the way toward 125,500–126,000
Alternative: break below 117,000 could lead to a deeper pullback toward 115,000

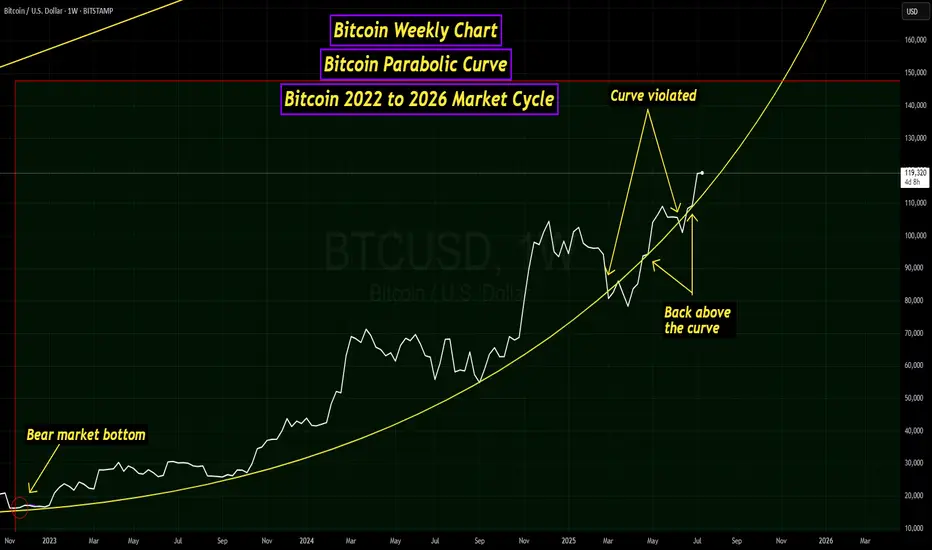
Bitcoin Parabolic Curve - 2022 to 2026 Market CycleThis line chart visualizes the current Bitcoin market cycle from the bear market bottom in November 2022. As you can see, the price has formed a parabolic curve, which was violated around the beginning of March. A couple of weeks later, a retest of the curve occurred, which was rejected. Later in April, the price of BTC was able to push back above the curve. There was another small dip below in June, but BTC was back above the curve by the end of June.
I am also watching the Bitcoin monthly chart and, more specifically, the monthly Stochastic RSI indicator. As you can see in the chart below, between the second and third months after the market cycle peak, the Stochastic RSI indicator has always dropped below the "20" level, and was near zero at the close of the third month.
Back in March and April, there was some speculation that the new all-time high set on January 20th at just over $109k was the peak for this market cycle. At the beginning of April, the Stochastic RSI dropped well below the 20 level but rebounded and was at 16.81 when the April candle closed. The May monthly candle closed with the Stochastic RSI at 31.45, and June closed at 50.17. This indicated to me that this market cycle was far from over.
On July 14th, BTC set a new all-time high at just over $123,000, ending the speculation that this current market cycle had peaked. My assumption for now is that Bitcoin is still following a 4-year market cycle. If this is true, I would expect a market cycle peak sometime in the final months of this year. Either way, it has been a very interesting market cycle with huge changes for the crypto asset class.
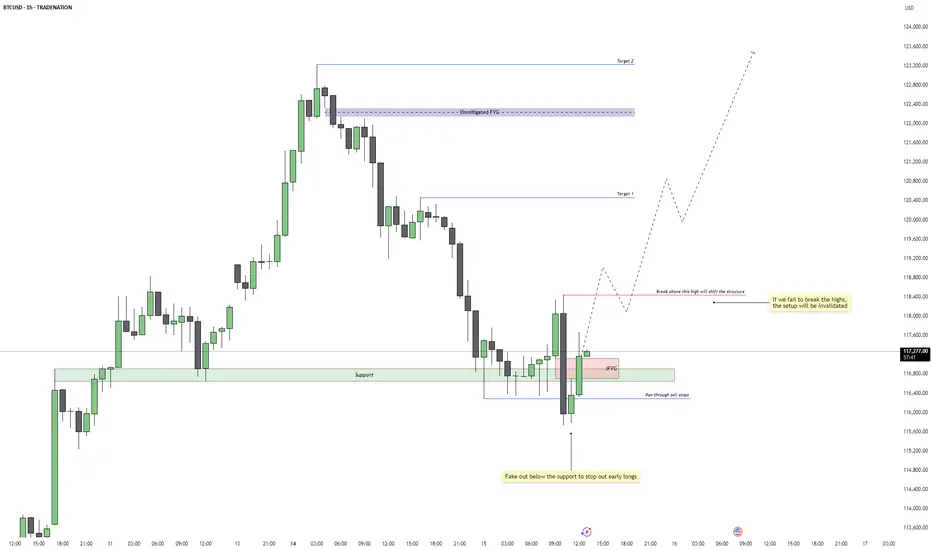
Bitcoin - Reversal Setup or Just a Trap Reset?Price faked below the 1H support zone around 115,800, triggering a clean run through resting sell stops. This classic liquidity sweep flushed out early long positions before immediately reclaiming the range. The move aggressively filled a prior imbalance and flipped sentiment just when it seemed the trend might break lower. The quick rejection and recovery from this level suggests smart money accumulation beneath support.
Formation of a 1H Inversion Fair Value Gap
The rebound from the liquidity grab printed a bullish 1H inversion FVG, now acting as a potential launchpad for continuation. This FVG coincides with the same zone that was previously support, now carrying added confluence. As long as price remains above this gap, the reaction shows bullish intent, with buyers reclaiming initiative after a shakeout.
Trend Shift Trigger and Invalidation Level
The current structure remains technically bearish until we break above the marked 1H high at 118,400. That level is the structure shift trigger. A decisive close above it would confirm a market structure shift and open the door to a broader bullish continuation. However, failure to close above this high would invalidate the setup and suggest that the move from support was just a temporary retracement rather than a full reversal.
Upside Targets and Continuation Outlook
If we get the bullish break above 118,400, I’m looking for price to reach Target 1 near 120,400, followed by Target 2 around the unmitigated FVG at 122,200. These levels align with clean inefficiencies that are likely to get filled if the market gains momentum. With enough volume behind the breakout, BTC could push into ATH territory above 123K as part of a larger macro expansion.
Volume and Higher Timeframe Context
Volume is the final key piece. We need strong follow-through above 118,400 for the setup to remain valid. Weak rejection or consolidation below that red line would signal distribution and potential failure. On the higher timeframes, BTC still looks constructive, but the 1H structure must confirm by breaking higher, or the broader bullish case will need to be re-evaluated.
Conclusion
BTC swept 1H support, ran stops, and printed a bullish inversion FVG. A break and close above 118,400 would confirm trend reversal and initiate a move toward 120,400 and 122,200. If we fail to close above that level, this setup is invalidated and the range could continue or break lower.
Disclosure: I am part of Trade Nation's Influencer program and receive a monthly fee for using their TradingView charts in my analysis.
___________________________________
Thanks for your support!
If you found this idea helpful or learned something new, drop a like 👍 and leave a comment, I’d love to hear your thoughts! 🚀
BIG ALERT: Stock Market shown a massive break on a TL support. 🚨BIG ALERT: Tech Sector shown a break on a massive TL support level and this news just came out.
We may see everything reverse here pretty soon, depending how the market responds......
CRYPTO may still trend upward and most likely WILL!
- Crypto wins in the end, stay watchful! #BlackChain

Btcusd sellSmc trading strategy, we are entering with h1 OB after confirming inducement and liquidity.

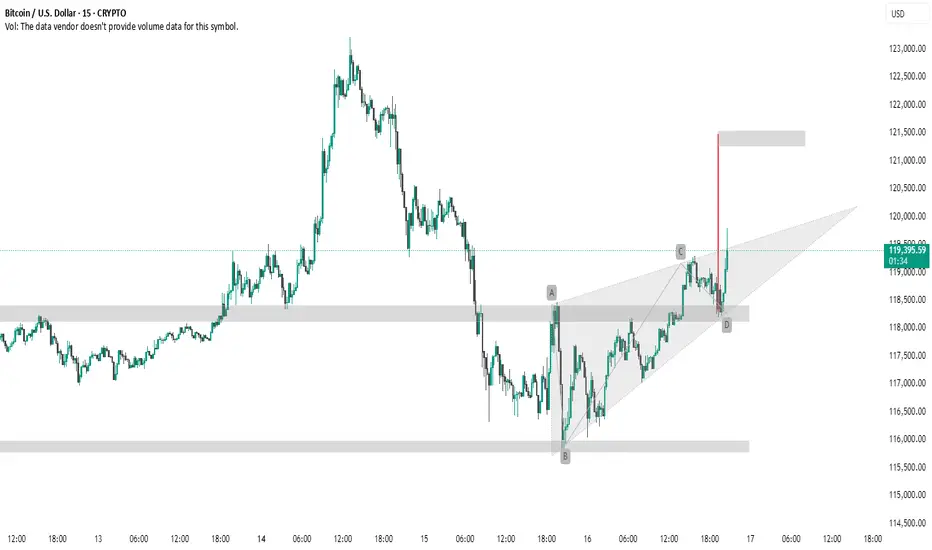
BTC #Trangle BreakoutThis 15-minute BTC/USD chart presents a **bullish breakout** from a **rising wedge pattern**, which typically has bearish connotations but in this case broke upward — suggesting strong buying pressure.
Key Observations:
* **AB=CD Pattern**: The chart shows a completed harmonic AB=CD pattern, typically a **reversal** or **continuation** signal, depending on context.
* **Breakout & Target Zone**: Price broke above the wedge resistance near point D, with a projected target zone around **\$121,500**, shown with the red vertical line and grey box.
* **Support Zones**: Well-defined support areas near **\$118,000** and **\$116,000** provide a strong base for the bullish move.
Summary:
This setup indicates a **bullish continuation** with a breakout from the wedge, validated by the harmonic pattern and volume momentum (if available). Traders may watch for price holding above \$118,000 to confirm continuation toward \$121,500.
thank u
Bitcoin bull runthe $120k bitcoin all time high comes earlier than expected, it looks like our next stop might be $150k by the end of these year
