BTCUSD trade ideas

BTC/USD Bullish Reversal Breakout Pattern BTC/USD Bullish Reversal Breakout Pattern 🚀
Technical Analysis:
🔹 Trend Reversal: The chart shows a clear inverse head and shoulders pattern highlighted with orange circles — a strong bullish reversal signal after a downtrend.
🔹 Breakout Zone: The neckline resistance around 108,000 USD has turned into support (marked as “SU00QT” due to a typo, assumed to be “SUPPORT”). Price action is consolidating just above this zone.
🔹 Trendline Support: The upward blue trendline confirms bullish structure, with price forming higher lows. Recent price action is bouncing off this trendline, showing strength.
🔹 Bullish Confirmation: Green arrows indicate strong bullish rejections from key levels, aligning with breakout retests.
🔹 Target Projection: The measured move from the inverse head and shoulders pattern projects a target towards the 114,000 USD resistance zone 📦 highlighted above, suggesting a potential 5-6% upside move 📊.
Conclusion: As long as price holds above the 108,000 support zone and the ascending trendline, BTC/USD remains bullish with potential continuation towards 114,000 USD. A breakout above minor consolidation could trigger a strong bullish rally 💥.
🛑 Invalidation: A sustained break below 106,000 USD would invalidate the bullish structure and may lead to further downside.

BTC flag with a pole to 140on a weekly BTC formed a flag, on Daily it's already bouncing off the flag treandline. the pole measured move is to 140. Just what my eye thinks it sees :)

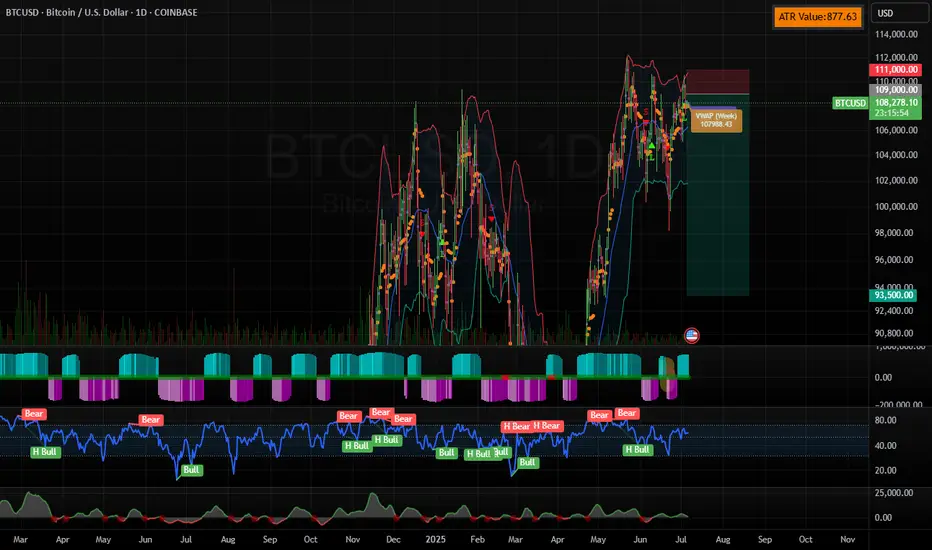
BTC ShortResistance at 111k has proven to be challenging for BTC, and I believe that it needs to retrace to regain momentum to go meaningfully higher.
On the hourly chart, price has been squeezing for the longest since June which resulted in a drop of more than 10%. The squeeze and RSI divergence pattern between the two periods is very similar. BTC enjoyed the tailwind of the USD falling significantly since the beginning of the year, but I believe it will start to strengthen again.
TP is the 93-94k range. I will cut losses at 111k. If the trade gains momentum and slices through 93k, then I will continue to trail stops until it reverts. At that time, I will most likely go long for the next major upside push.
Risks:
There are three major pieces of crypto legislation that could cause unpredictable swings.
Also, it's crypto, so anything can and routinely does happen :P
An entry for a long position incoming
It looks like a good entry point for a long position.
Close the position once the price hits the SR above or the Road level
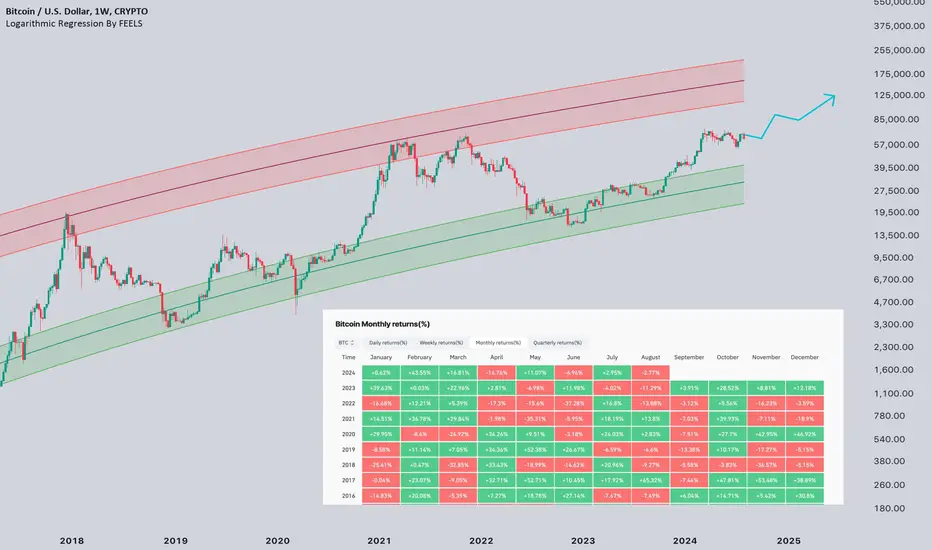
BTC monthly yelling at us for something interesting ?We read daily news about ETF, accumulation by institutes and scarcity in the exchanges, but I recognize something different in the chart based on multiple indicators. Historically, BTC boomed after touching 50 EMA and whenever it is extended it traces back to 50 EMA on monthly chart. As per current data, BTC is extended far from it. Also RSI and MACD indicating that it is losing momentum with -ve divergence. Volume as well descreasing since last leg, though price moved up. So, I expect price to retrace to 50 EMA which coincides with previous high at 60K. Let us see how it unfolds.

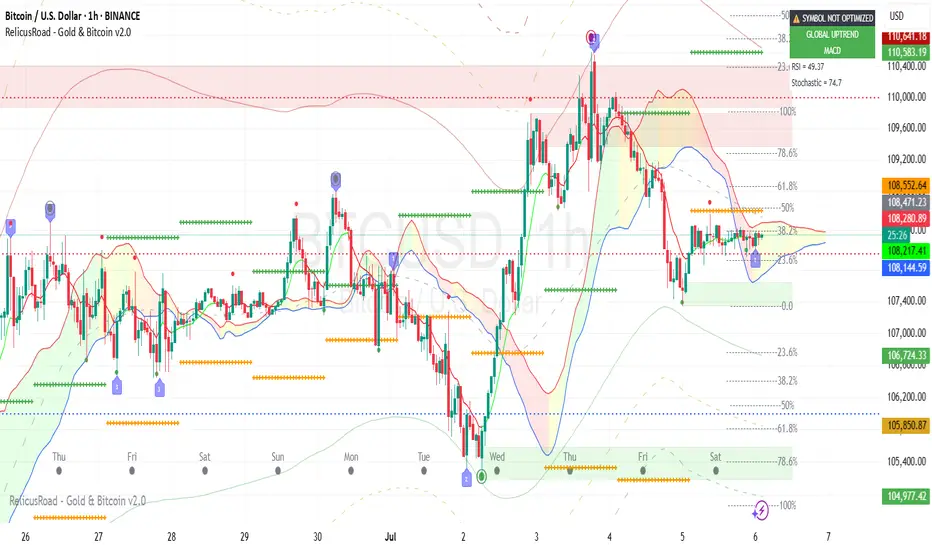
BTC/USD – Pullback Before Moonshot?4H Outlook by WrightWayInvestments
Bitcoin just delivered a textbook breakout from the descending channel and is currently consolidating above the breakout trendline. This is a critical zone where market participants are deciding between continuation or a retest.
🧠 Technical Breakdown:
🔹 Breakout Confirmation – Clean bullish breakout above channel resistance
🔹 Ascending Trendline Support – Currently being tested
🔹 Fibonacci Reload Zone – Between 0.382–0.618 (🟦 $105,853–$102,942)
🔹 Bullish Scenario – Potential higher low before aiming for major fib extension
🔹 Target Zones:
• TP1: $110,525
• TP2: $113,827
🧭 Game Plan:
A retracement into the fib support zone ($104K–$102.9K) offers the highest RR for long entries, ideally on bullish candlestick confirmation + volume spike. A break and close above $108.5K could negate pullback expectations and signal direct continuation.
🔔 Final Note:
Volume expansion on breakout + controlled retrace = power setup.
Let the market come to you — high-probability zones don’t chase.

Are we breaking this resistance ? or not yet? BTC is currently trading around $108,000, sitting at a key trendline support zone. The market is at a critical decision point, with two main scenarios: a bullish breakout or a rejection and move lower.
🔍 Technical Structure Overview
Chart timeframe: 1D (Daily)
Major support: $104,000 (horizontal) & ascending trendline (cyan)
Major resistance: $110,000–$112,000 zone
Long-term resistance channel: Yellow trendline capping BTC near $140,000
Volume: Currently low — needs a spike to confirm any breakout
🟢 Bullish Scenario
BTC bounces off the ascending trendline (current zone)
A strong breakout above $112,000 with volume would confirm a Potential Breakout Bounce #2
Targets:
$120,000 (short-term)
$130,000–$140,000 (upper yellow trendline in long-term channel)
✅ Confirmation needed:
Daily candle close above $112K with high volume
RSI rising above 50, MACD bullish crossover would help confirm move
🔴 Bearish Scenario
BTC fails to hold the trendline and breaks below $104,000
This confirms a rejection and a likely move toward $96,000
If momentum weakens, this could turn into a deeper correction or sideways consolidation
BTC is in a tight consolidation range, nearing a major decision point. A breakout above resistance could send prices to new local highs, while failure to hold trendline support will likely trigger a correction. Watch key levels carefully and let volume + momentum indicators confirm your trade.

Weekend BTC Trend Analysis and Trading SuggestionsLet's review this afternoon's market performance. The BTC price, as we anticipated, rebounded to around 109,000 in the afternoon before plummeting sharply. Living up to "Black Friday", this violent drop was well within our expectations. In the afternoon's live trading, we also reminded everyone that as long as there was a rebound to the upper zone, it was a good opportunity to go short. This drop has created a space of nearly 1,500 points. Currently, the BTC price has pulled back to around 107,800.
From the current 4-hour K-line chart, after a strong upward surge, the market encountered significant resistance near the upper track of the Bollinger Bands. As bullish momentum gradually faded, the price started to come under pressure and decline, suggesting that the short-term upward trend may come to a temporary halt. At present, the market has recorded multiple consecutive candlesticks with large bearish bodies. The price has not only effectively broken below the key support level of the Bollinger Bands' middle track but also caused the Bollinger Bands channel to switch from expanding to narrowing, indicating that market volatility is decreasing. In terms of trading volume, it showed a moderate increase during the price pullback, which further confirms the authenticity of the bearish selling pressure.
BTCUSD
sell@108000-1085000
tp:107000-106000
Investment itself is not the source of risk; it is only when investment behavior escapes rational control that risks lie in wait. In the trading process, always bear in mind that restraining impulsiveness is the primary criterion for success. I share trading signals daily, and all signals have been accurate without error for a full month. Regardless of your past profits or losses, with my assistance, you have the hope to achieve a breakthrough in your investment.
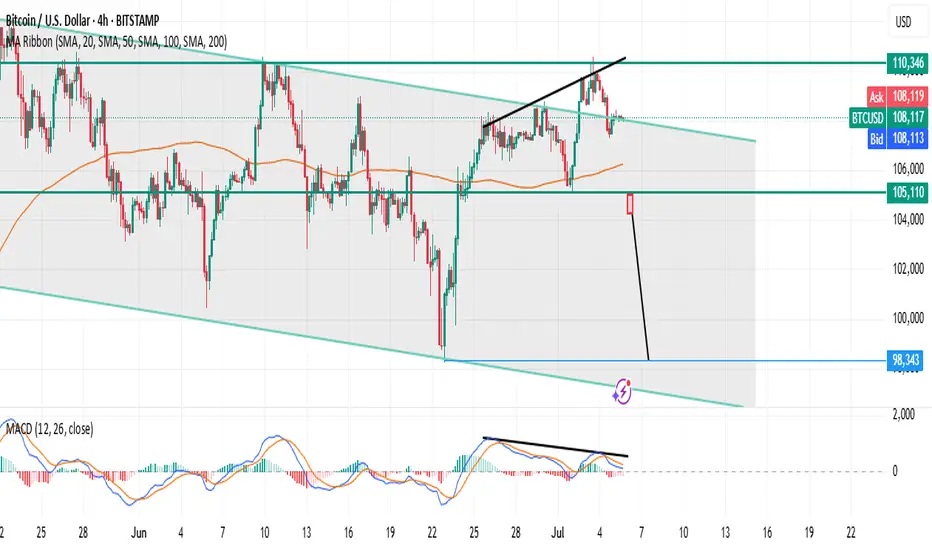
BTC/USD (4H): Classic FRL short setup unfoldingTrading = capital management under uncertainty.
Bitcoin is trading inside a clear descending channel on H4.
Price recently tested the upper boundary of this channel while forming a bearish divergence on MACD. This divergence hints at a weakening upward phase, signaling a possible phase shift according to Fractal Reversal Law (FRL).
Why is this a classic FRL setup?
✅ Phase Identification:
The prior local upward phase within the descending channel is weakening.
✅ Reversal Pattern:
A double top / wedge has formed at the upper boundary with a bearish divergence.
✅ Neckline:
The neckline aligns with the MA100 cluster on H4, now acting as a horizontal rubicon.
✅ Confirmation:
We wait for a full candle close below the neckline on H4 to confirm the phase shift.
✅ Targets:
– TP1: Mid-channel grey zone.
– TP2: Lower boundary of the channel.
✅ Stop:
Above the recent highs or channel top, depending on your risk management.
Plan:
Wait for H4 close below neckline → enter short.
Use the channel structure for target planning.
Manage risk with a tight, structure-based stop.
This is a clean FRL textbook scenario:
Phase → Pattern → Neckline → Confirmation → Target.
It aligns with the larger market structure, using the combination of price action, divergence, and structure clarity to guide your trade decisions.
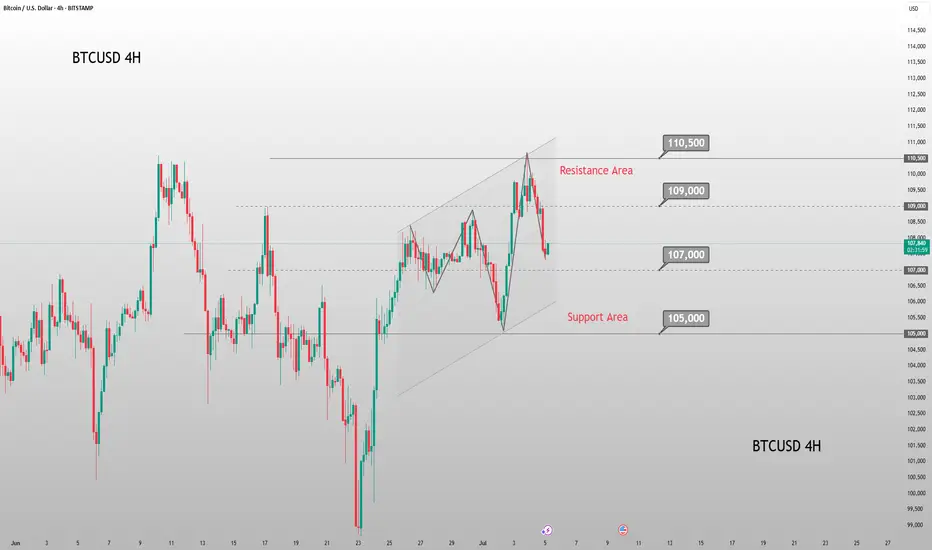
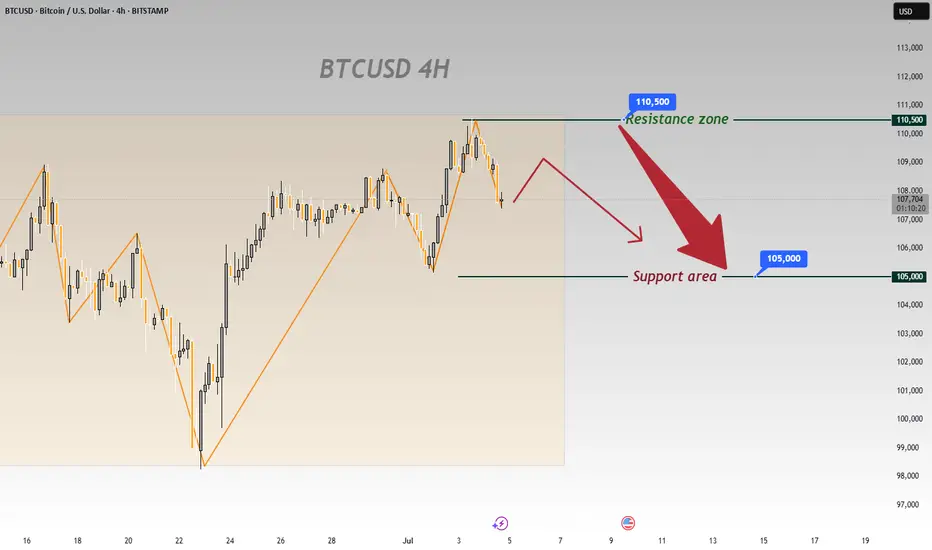
On BTCUSD’s 4 - hour chart, downside risks prevailOn BTCUSD’s 4 - hour chart, downside risks prevail:
Resistance Holds
Price failed to break 110,500, showing strong selling pressure that caps bulls 🚫. A pullback is likely.
Downtrend Signals
Post - resistance, price is retracing. Candlesticks and chart arrows point to a drop toward 105,000 support, fueled by building bearish momentum ⬇️.
Support Test Looms
105,000 is the next key level 🔑. Even if support slows the fall, the setup favors downside—bullish reversals seem unlikely after resistance failure.
Trend Weakness
Orange trendlines show the prior uptrend is fragile 🧊. Failing at 110,500 signals fading bullish force, setting up for a bearish correction.
In short, the 4 - hour chart is bearish. Watch for drops to 105,000; 110,500 will likely block bulls 🛑. Trade cautiously with this bias.
🚀 Sell@108500 - 107500
🚀 TP 106500 - 105500
Accurate signals are updated every day 📈 If you encounter any problems during trading, these signals can serve as your reliable guide 🧭 Feel free to refer to them! I sincerely hope they'll be of great help to you 🌟 👇
Triple Bearish DivergenceWe have bearish divergence on the MACD(Chris Moody) and the CCI and the RSI. Also the MACD looks like it can make a bearish cross over in the future. BTC is near all time high and volume is drying up and this week candle is forming a hanging man(week is not over yet). If the Bulls can keep price above the 10 EMA 103,333.98(purple curve) they have a fighting chance but the bears are patiently waiting.

Why Bearish?Why are we falling and why do I think there will be no deep correction?
🗣The first is, of course, geopolitics, risks are growing again in the Middle East,
🗣The second is additional liquidity from the US government and mt GOX.
🗣A crisis of narratives, nothing very positive will happen in the next 2 months, and the seasonality in those months also does not give anything positive.
🗣Fears that key rates will be lowered will bring negativity to the market, as has been the case historically.
Why these are not big problems?
💡Geopolitics. I don't want to delve into possible options, but in the basic version, I expect a repetition of the option as it was in April, after which the situation cooled down.
💡The market will absorb the liquidity here and as in the past, as we saw in the story with the sales of the German government.
💡I think there will be narratives, and seasonality does not show us a deep correction, only consolidation.
💡I consider that the negative will be only in snp500 and then very short-term. In general, lowering rates is positive, both for business and for risky assets such as cryptocurrencies.
P.S. In the table of seasonality, I left only the necessary months, taking away bear years and too early years.
Upward to 111k+ 4h chartThis is a 3 wave corrective move NOT a bullish move. Looking at 111-112k then epic down side. Running flat may keep the target above 74k

Long Setup Loading… (BTC)My key demand zone for potential long setup – confluence of Fibonacci 0.66/0.618 and liquidity grab expected.
This highlighted golden zone will be my key area to look for long entries. It's aligned with the 0.66–0.618 Fibonacci retracement from the previous impulse, and I expect potential liquidity sweep below recent lows before a strong bullish reaction.

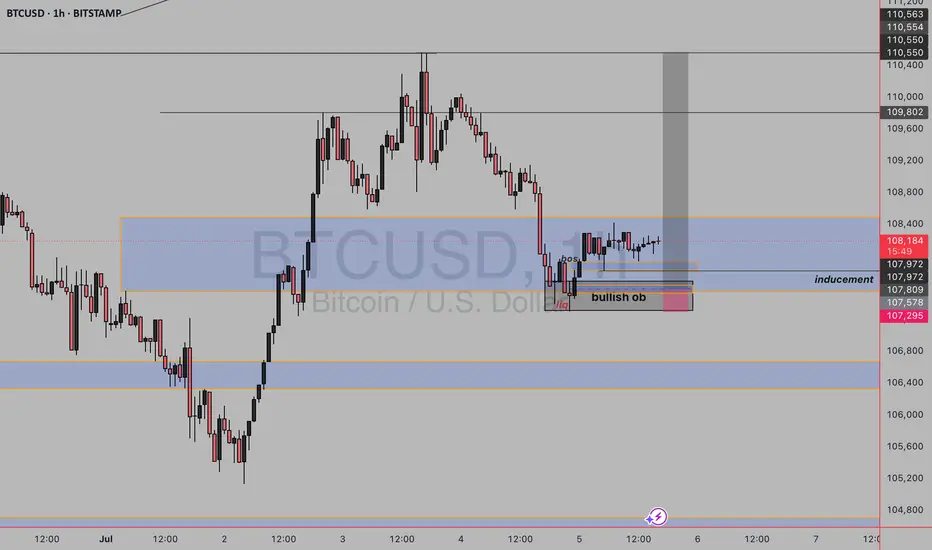
BULLISH BITCOINAs we can see we are currently on an uptrend on higher timeframe and price is in daily fvg and has mitigated the bullish order block on daily tf on lower timeframe we have seen liquidity sweep and break of structure and clear inducement provided so we wait for price to tap the ltf orderblock and buy
Current Pivot Points on the BtcUsd Pair📈 Classic Pivot Points (Daily Timeframe)
Using yesterday’s data:
High = $109,723.7 (Jul 3)
Low = $108,544.8
Close = $108,590.5
investopedia.com
+15
marketmilk.babypips.com
+15
dailyforex.com
+15
investing.com
+1
coinlore.com
+1
Compute:
Pivot Point (PP) = (109723.7 + 108544.8 + 108590.5) / 3 ≈ $108,953.0
Resistance 1 (R1) = (2 × PP) – Low ≈ $109,361.2
Support 1 (S1) = (2 × PP) – High ≈ $108,182.3
Resistance 2 (R2) = PP + (High – Low) ≈ $109,912.0
Support 2 (S2) = PP – (High – Low) ≈ $108,023.0
These central and level lines offer key zones where price might reverse, pause, or breakout.

HelenP. I Bitcoin may correct to support level and continue growHi folks today I'm prepared for you Bitcoin analytics. If we look at the chart, the price has formed a clean upward channel after bouncing from the strong support zone at 103500 - 103000 points. This movement marked the beginning of a new bullish phase. Price continued to rise step by step, confirming the structure with higher highs and higher lows. After reaching above 110000 points, it made a minor pullback but still trades above Support 1 - 108800 points. This zone, 108800 - 108200 points, aligns well with the midline of the channel and may serve as a strong area for buyers to re-enter. The price is currently trading around 110382 points and is still respecting the channel structure. As long as BTCUSD stays above the support zone and inside the ascending channel, I expect a potential continuation toward the upper boundary. My current goal is 114000 points - near the resistance line of this bullish channel. Given the strong trendline support, clean reaction at each correction, and buyer activity on lows, I remain bullish and anticipate further growth. If you like my analytics you may support me with your like/comment ❤️
Disclaimer: As part of ThinkMarkets’ Influencer Program, I am sponsored to share and publish their charts in my analysis.

BITCOIN - Price can drop from resistance area to $103000Hi guys, this is my overview for BTCUSD, feel free to check it and write your feedback in comments👊
Some days ago, price entered a pennant pattern, where it at once made an upward impulse from support line.
Then the price reached $98700 level and soon broke it, after a small correction, and then continued to move up.
Later BTC rose to the resistance line of the pennant, but soon turned around and started to decline, breaking $110000 level.
Price little corrected and then tried to bounce back and failed, after which it fell to $98700 level and then started to grow.
In a short time, BTC rose to a $110000 resistance level and tried to break it again, but recently turned around and started to fall.
Now, I expect that BTC can grow to the resistance area and then drop to $103000 support line of the pennant.
If this post is useful to you, you can support me with like/boost and advice in comments❤️
Disclaimer: As part of ThinkMarkets’ Influencer Program, I am sponsored to share and publish their charts in my analysis.

Magic awaits for Bitcoin!The breakout from this pattern will likely come within weeks.
I think Q3-Q4 Bitcoin will absolutely blow our minds.
US institutions have been accumulating Bitcoin for almost a year.
They don't buy tops.


Bitcoin the exact scenariobitcoin may need some mre liquidity to fuel back up , so it's better to see this scenario as the most accurate, in order to make some new all time high
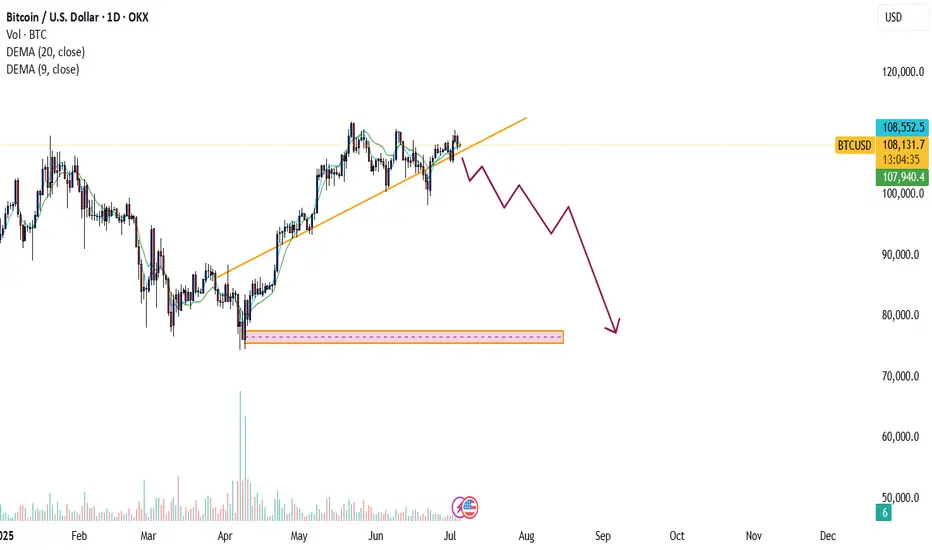
Bitcoin(BTC/USD) Daily Chart Analysis For Week of July 4, 2025Technical Analysis and Outlook:
During this week's trading session, Bitcoin rebounded from our Mean Support level of 104900 and, with significant momentum, subsequently completing the Mean Resistance level of 110300. Currently, the cryptocurrency is poised for a continuation of its downward trajectory, with a target set at the Mean Support level of 105500. This downward trend may necessitate heightened resilience to address the Key Resistance point at 111700 and the emerging historical price action of the Outer Coin Rally at 114500 and beyond. Nonetheless, it remains essential to acknowledge the possibility that current prices may experience an uptick from this juncture, bolstering the rally mentioned above.
