$BTC 2013\2017 vs. 2021\2025bitcoin is exactly repeating the reflection of the 2013-2017 period
zoom out!
BTCUSD trade ideas

Bitcoin Long: Completion of wave 4 (5-wave instead of 3-wave)In this video, I updated the wave counts for Bitcoin, primarily the change is in wave 4 where I believed that it has formed in 5-waves instead of 3-waves.
Because of the new low, both our stop loss and take profit are now lowered:
SL: $113,858.
TP: $124,000
Good luck!

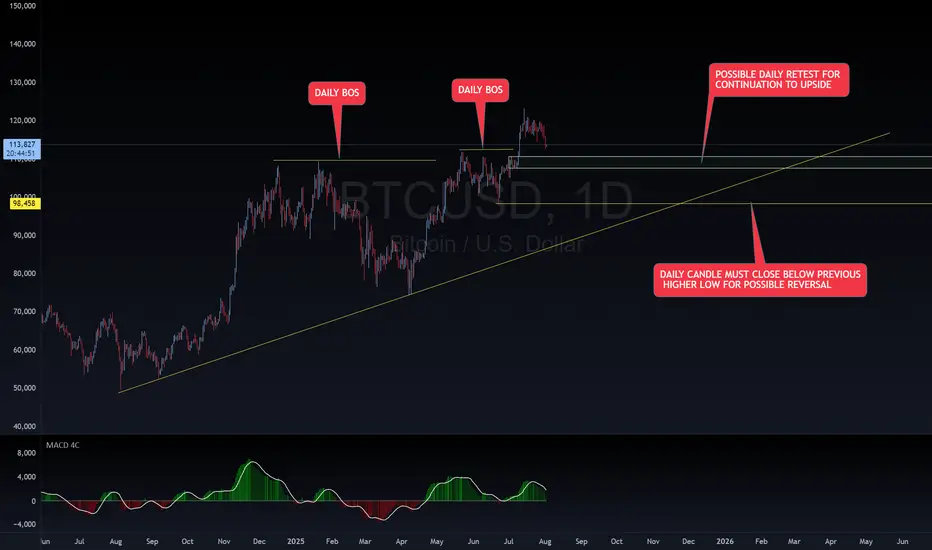
BTC BUY SET UPBTC is on an overall DAILY uptrend with a DAILY BOS. Waiting on a DAILY retest for continuation upward. If DAILY candle breaks and closes below last DAILY HL, it could potentially cause a reversal to downside. Happy trading!
~~~~I want everyone to succeed!
Bitcoin Has Bearish DivergenceOverbought bearish divergence.
I pointed this out last week. In my mind, this is the most reliable signal for tops (bullish divergence for bottoms) that exists in technical analysis. We can see that this continues to play out, and know that it usually leads to RSI making the trip to oversold.
It looks like more correction is likely, standard fare in a bull market.


Bitcoin - The cycle is just starting!⚔️Bitcoin ( CRYPTO:BTCUSD ) just created new highs:
🔎Analysis summary:
Bitcoin is currently - especially with the new all time high breakout - just perfectly following previous cycle behavior. Since there is no real resistance above current price, apart from psychological levels, I do expect a substantial rally back to the upper channel resistance trendline.
📝Levels to watch:
$300.000
🙏🏻#LONGTERMVISION
Philip - Swing Trader


Let's buy BTCUSD on correction!I found interesting opportunity in BTCUSD right now.
It has been moving in consolidation channel after recorded its all time high.
Based on Elliot Wave count, the price right now is making it's wave 4.
The next possible target is 120-125k.
CHEEEERRRSSS..!!!

BTC Bearish DivergenceBINANCE:BTCUSDT
Rezistance Levels: 123,217.39.
Support: 98,299.89
Trade Setup:
Target 1: 110,758.64 (0.50 Fibonnaci Golden Zone).
Target 2: 107,818.37 (0.618 Fibonnaci Golden Zone).
Target 3: 103,632.23 (0.786 Fibonnaci Golden Zone).
Target 3: 98,299.89 (1 Fibonnaci).
Stop Loss: 123,217.39 (above recent high, ~25% above current price).
RSI Analysis: The RSI shows a bullish divergence (price making lower lows while RSI makes higher lows), suggesting potential upward momentum. Current RSI is around 62.80, nearing overbought territory (>70), so caution is advised.

to 65K soon BTC/USD – Historical Cycle Analysis & Mid-Term Outlook (1W)
Exchange: Coinbase
Timeframe: Weekly (1W)
Key Observations:
Long-Term Trendline Resistance
The black ascending trendline has historically acted as a major resistance zone since 2017.
Every touch of this line in the past has been followed by a significant correction.
Bearish Divergences (DIV / HDIV)
Red arrows indicate historical bearish divergences on RSI/MACD.
Each divergence marked a local or macro top before a sharp retracement.
Major Historical Resistance – $64,899
Derived from 0.5 Fibonacci retracement of the primary cycle.
Served as a key ceiling during previous cycles before new all-time highs.
Bitcoin Cycle Behavior
BTC historically forms parabolic tops followed by deep corrections.
The current cycle (2024–2025) mirrors 2017 and 2021 structures, suggesting we may be approaching a macro inflection point.
Mid-Term Scenario
Price near the trendline (~$120K) implies high risk of volatility and correction.
Primary support zone: ~$65K (historical + Fibonacci confluence).
Likely scenario: range-bound movement between $65K–$120K before any sustainable breakout or new parabolic leg.

BTCUSD: Local Bullish Bias! Long!
My dear friends,
Today we will analyse BTCUSD together☺️
The market is at an inflection zone and price has now reached an area around 114,020 where previous reversals or breakouts have occurred.And a price reaction that we are seeing on multiple timeframes here could signal the next move up so we can enter on confirmation, and target the next key level of 114,821.Stop-loss is recommended beyond the inflection zone.
❤️Sending you lots of Love and Hugs❤️
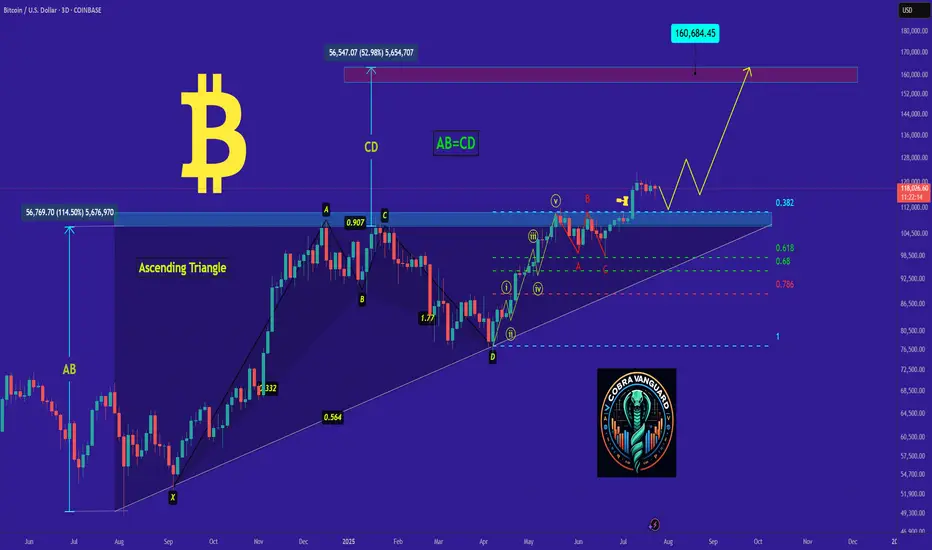
bitcoin- Time to buy again! (Update)As I said, Bitcoin broke the triangle, and now with a slight price correction, it could surge to $160,000, and you still think I'm joking!!
Previous analysis
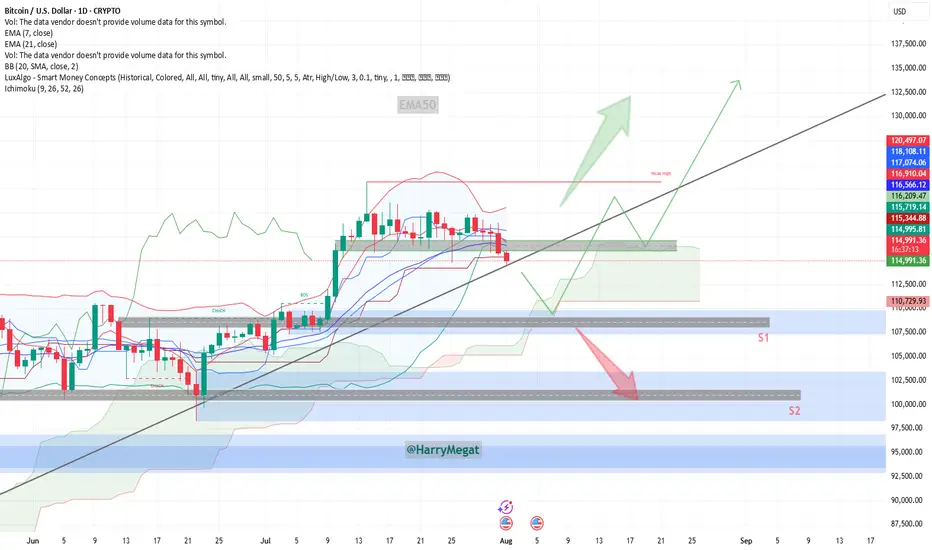
Analysis BTC/USD Daily ChartAnalysis BTC/USD Daily Chart
**Chart Overview (Daily Timeframe)**
**Current Price**: \~\$114,937
**EMA 7**: \$116,896 (short-term)
**EMA 21**: \$116,561 (medium-term)
**Trendline**: Price is testing the long-term ascending trendline
**Key Zones:**
* **Support 1 (S1)**: \~\$110,000
* **Support 2 (S2)**: \~\$102,000
* **Immediate Resistance Zone**: \~\$116,000–\$120,000
**Bullish Scenario**
**Conditions**:
* Price **holds above the ascending trendline**
* A strong **bounce from current level (\~\$115K)** or a reclaim above **\$116K**
**Buy Setup**:
* **Entry**: \$115,000–\$116,000 (if bounce confirmed)
* **Stop-loss**: Below \$114,000 or the ascending trendline
* **Targets**:
* TP1: \$120,000
* TP2: \$125,000
* TP3: \$132,000+
**Confirmation**:
* Bullish candle formation near the trendline
* Reclaim of EMAs (especially EMA 7)
**Bearish Scenario**
**Conditions**:
* Price **breaks below the ascending trendline** and **closes below \$114K**
* Rejection from \$116K zone with a strong red candle
**Sell Setup**:
* **Entry**: Below \$114,000 (on confirmed breakdown)
* **Stop-loss**: Above \$116,000
* **Targets**:
* TP1: \$110,000 (S1)
* TP2: \$105,000
* TP3: \$102,000 (S2)
**Invalidation**:
* Quick recovery above \$114.5K and trendline reclaim = possible fakeout
**Bias**
**Neutral to Bullish**, as price is **at trendline support**.
Watch closely for **price reaction at current levels** for the next directional trade.
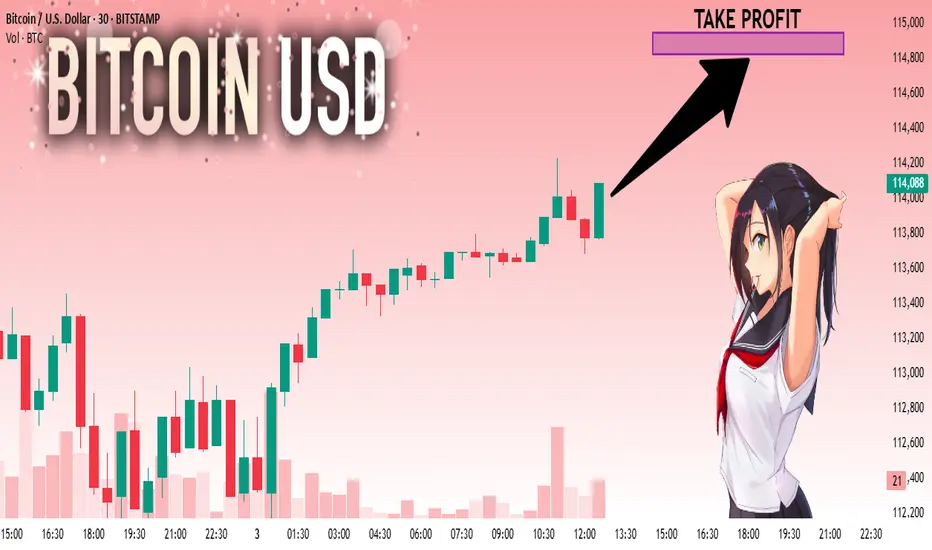
BITCOIN BULLYING Bitcoin hit take profit previously and now I will be looking at another buy within this trend and price action combined with patterns

Bitcoin Outlook – Early August🟩 1M Timeframe (Monthly Overview)
The August monthly candle has just begun forming, so it’s too early to draw solid conclusions. While there’s selling pressure visible, it’s not yet a confirmed reversal on the higher timeframe.
🟨 1W Timeframe (Weekly View)
On the weekly chart, structure leans bearish. If momentum continues, a mid-term downside target of $105,000 remains in play.
🟧 1D Timeframe (Daily Perspective)
The daily chart shows some buying interest around $108,500, suggesting a possible short-term rebound.
However, if price fails to hold above this level, it may drop to retest the $105,000 zone.
A break below that would open the door for a move toward $102,000.
⸻
🧭 Key Notes:
1. If the bearish view is to remain valid, price must not break above $120,000.
A higher high would indicate potential trend continuation on the bullish side.
2. Rebounds are possible along the way.
Opening a short position in the current zone is viable, but a tight stop-loss around $114,500 ± $500 is advised.
This level is a lower high on the 4H timeframe — a critical pivot that, if held, confirms bearish continuation.
But if price breaks above it, the downtrend scenario weakens, and traders may wait for a re-entry closer to the $120,000 resistance zone.
⸻
🧠 Summary & Strategy:
• Monthly: too early to call
• Weekly: bearish bias, targeting $105,000
• Daily: watch $108,500 for short-term support
• Downside levels: $105,000 → $102,000
• No new high above $120,000 if bears are to stay in control
• Short entries okay here; SL ~ $114,500 ± $500
• Wait to re-short at $120,000 if invalidated

BTCUSD: Long Signal with Entry/SL/TP
BTCUSD
- Classic bullish formation
- Our team expects growth
SUGGESTED TRADE:
Swing Trade
Buy BTCUSD
Entry Level - 11326
Sl - 11231
Tp - 11516
Our Risk - 1%
Start protection of your profits from lower levels
Disclosure: I am part of Trade Nation's Influencer program and receive a monthly fee for using their TradingView charts in my analysis.
❤️ Please, support our work with like & comment! ❤️

Bitcoin at $110,000?After reaching its last ATH, Bitcoin practically went into a coma. Now, with the strengthening of the dollar, it's undergoing a correction — and if that correction deepens, there's a possibility it could drop to \$110,000. We'll have to see whether it finds support around the \$112,000 level or not.

BTC/USD – Strong Buy Opportunity from Demand Zone BTC/USD – Strong Buy Opportunity from Demand Zone
🟢 Technical Outlook:
Bitcoin (BTC/USD) has tapped into a well-defined Demand Zone near 115,000–116,000, showing early signs of a potential bullish reversal. This level aligns with key liquidity zones, smart money concepts, and price inefficiencies — offering high-probability long setups.
🧠 Key Technical Highlights:
🔻 Equal Lows + Sell-Side Liquidity:
Market swept equal lows, grabbing liquidity below support — a common institutional setup before a bullish push.
✅ Break of Structure (BOS):
A prior BOS indicates a shift from bearish to bullish structure after liquidity collection.
📉 Fair Value Gap (FVG):
Price created and respected an FVG after the BOS, validating bullish intent.
📊 Imbalance Filled:
A prior price inefficiency has now been filled, completing a clean move from imbalance back into structure.
📈 Target Zone: 119,000 USD
Marked as the logical next stop — sitting near prior resistance and a liquidity zone.
🎓 Educational Insight:
This is a textbook Smart Money Concept scenario:
Sell-side liquidity sweep
Demand zone tap
Imbalance rebalancing
Shift in market structure
It shows how institutions often engineer liquidity grabs before a large directional move.

BTCUSD CORRECTIONBTCUSD just met strong supply at 120 K, showing clear distribution from large sellers, yet price still respects the primary rising trendline. Below, absorption blocks cluster at 110 K–105 K where bids keep stepping in.
Targets:
• Upside — 125 K if the trendline holds and 120 K is reclaimed.
• Downside — 110 K on a break of trend support.
#BTCUSD #globaltrade #investment #investing #stockmarket #wealth #realestate #markets #economy #finance #money #forex #trading #price #business #currency #blockchain #crypto #cryptocurrency #airdrop #btc #ethereum #ico #altcoin #cryptonews #Bitcoin #ipo

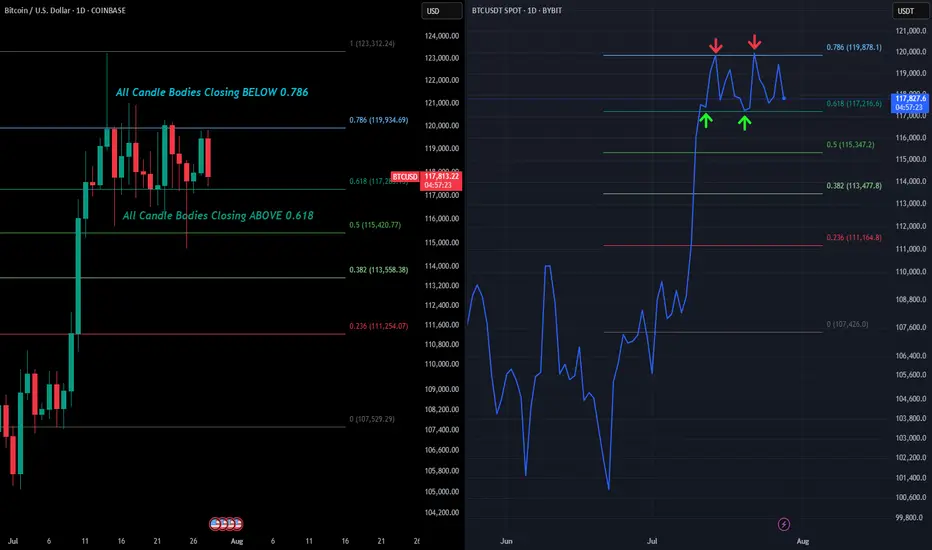
BTC - 1D RangeboundIf you saw our recent post on the warning signs of BTC's weekly chart, we are now going to zoom into the daily and examine how that structure will be decided.
For the last 2 weeks BTC's daily price action has been rangebound between 2 very important levels. The 0.786 (as we have been outline for the past couple weeks) and the 0.618.
So far every rejection (wick high) has happened around the $120.4k level. This is the 1.618 extension target we have had outlined for a while.
And if you look at the actual candle bodies, each has closed below that 0.786 confirming the rejections. The only way to negate this would be to close a daily candle ABOVE the 0.786 which would be over $120k on the Binance chart.
What we have also seen is bulls holding strong support at the 0.618. Everytime we wick below bulls quickly buy it up thus creating our range.
This can clearly be seen by the line chart we have added on the right. The line chart only takes into account candle body closes which shows the perfect bounces between support and resistance.
However if we close a daily candle below the 0.618 $117.2k then that would signal lower price action tests are likely to ensue. Will update this post once we get the confirmation breakout or breakdown from this micro range.
Bitcoin Dominance & The Fall of AltcoinsBitcoin has sold off sharply in recent session.
Allowing alt coins to capture small percentages of bitcoins liquidity which resulted in epic bullish moves.
Now that Bitcoin is retesting a major moving average (50 MA) we might see BTC recapture some of that crypto dominance.
Other alt coins are well off of their 50 day moving average making them a riskier buy.
When BTC dominance starts to take leadership we often see alt coins and the total market cap sell off.
Bitcoin dominance is hitting a multi year trendline and looks poised to capture some of the alt liquidity.
We still think BTC can sell off and go lower, but on a relative basis it should hold up better than other alt coins & Ethereum.
There are some key nuances that are building and shaping up for a very similar topping formation that occurred in 2021.

BTC SELL?A nice short opportunity for sell on Btc/Usd.
Intraday trade.
If it get continuation BTC could drop to lower levels.
Aiming for at least 3R
Let’s see how it plays out.

BITCOIN Is this just a giant Bull Flag?Bitcoin (BTCUSD) is basically on its first strong pull-back since the July 14 All Time High (ATH), as it is the 3rd straight red day going from roughly $120300 to below $115000 as of this moment.
Technically this Channel Down pull-back looks like a Bull Flag to the uptrend that started following the June 22 Low. The 1D RSI pattern is similar to the May 22 - 30 fractal, which was also a correction that started after a Channel Up and initially hit the 1D MA50 (blue trend-line), only to rebound a settle for a last dip lower closer to the 1D MA200 (orange trend-line).
If the 1D MA50 fails to contain the current correction, we may again be faced with a slightly more prolonged pull-back, which may be translated into an Accumulation Phase that could eventually lead to prices above $130000 by September.
Do you think that will be the case or we will see an instant rebound? Feel free to let us know in the comments section below!
-------------------------------------------------------------------------------
** Please LIKE 👍, FOLLOW ✅, SHARE 🙌 and COMMENT ✍ if you enjoy this idea! Also share your ideas and charts in the comments section below! This is best way to keep it relevant, support us, keep the content here free and allow the idea to reach as many people as possible. **
-------------------------------------------------------------------------------
💸💸💸💸💸💸
👇 👇 👇 👇 👇 👇
