going lower or bouncing on resistance? market is respecting key support/resistance or channel boundaries. These points often become decision zones where big moves occur.
Signs this could be a fakeout:
BTC wicks above a resistance or below a support with little follow-through
Volume spikes only on the wick, then dies quickly
Price reverses back into the range soon after breaking it
If BTC recently broke a trendline with low volume, it smells like a trap move — a liquidity grab.
If it’s testing support again after failing to rally, and volume is increasing on red candles, a leg down is possible.
However, macro trend is still up unless we lose a major higher low (say, sub-$60k or sub-$56k depending on your chart).
BTCUSD trade ideas

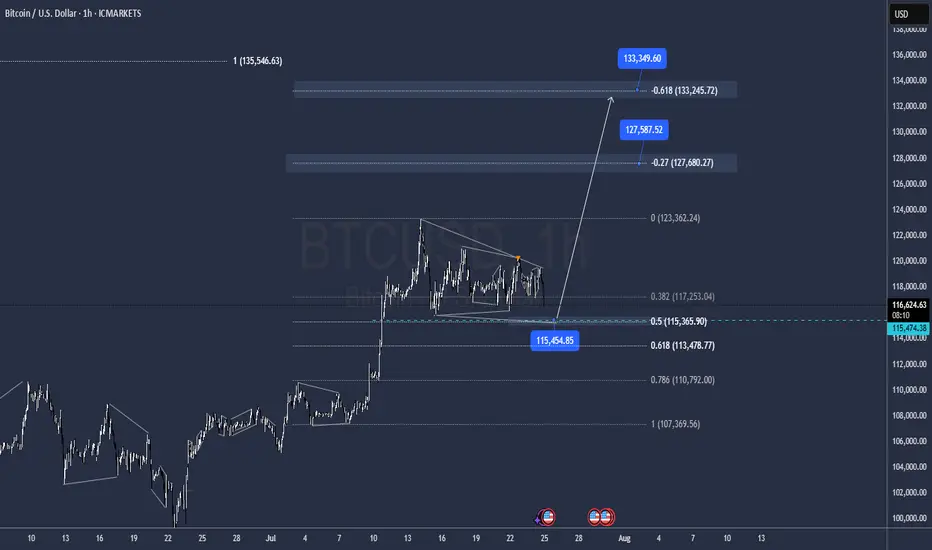
BTC Correction may be overOn a new look to the structure with the lat moves, it has the Potential to be over after tapping 115.500 and go for new Highs @ 127.500 / 133.000 as all internal impulses seeems to be matched.
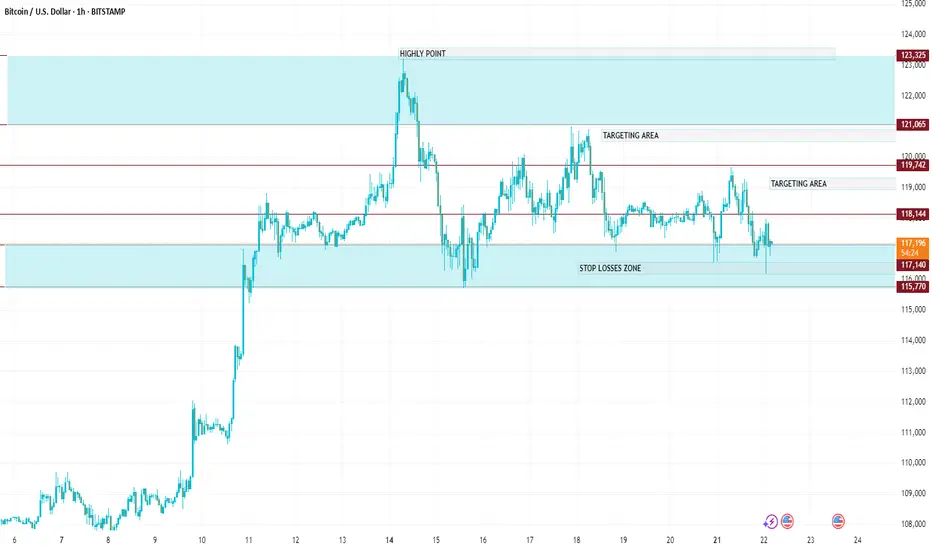
BTCUSDTarget Levels (Upside Potential)
📍 Entry Zone:
Enter near stop losses zone (approx. 117,000 – 117,200 range).
Ideal after bullish confirmation (hammer, engulfing, or breakout from small range).
🎯 Take Profit Targets:
TP1: 117,800 – 117,900 → First "TARGETING AREA"
TP2: 118,300 – 118,500 → Second "TARGETING AREA"
TP3: 119,000+ → Final move towards the "HIGHLY POINT
These levels are based on previous structure highs and visually marked zones.
🔻 Stop Loss (SL):
Below 116,700 – 116,800
This level is below the lower boundary of the “STOP LOSSES ZONE,” offering protection from false breakouts.
Bitcoin Ready For Another Leg Higher?Bitcoin currently shows characteristics of bullish consolidation. Following a notable upward move after the election , the price action has entered a phase of sideways trading within a defined range since inauguration.
This period allows the market to digest recent gains and for buyers to accumulate further positions before the next anticipated leg up. Technical indicators, while showing a temporary pause in upward momentum, generally remain supportive of a bullish continuation, with key support levels S1-75k, S2-100k holding firm. The consolidation phase, marked by decreasing volatility, often precedes a strong directional move, suggesting that Bitcoin is coiling for another potential surge.

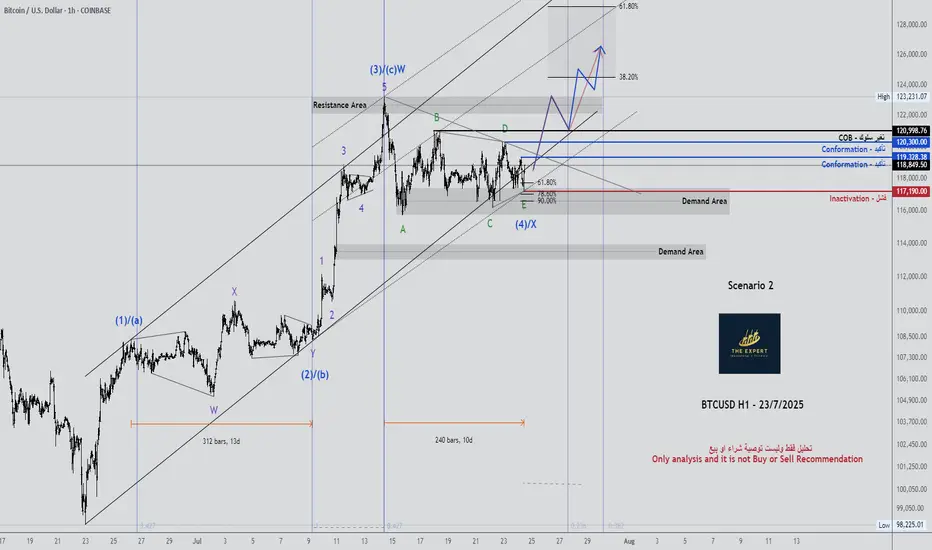
BTCUSD H1 - Updated 23/7/2025BTCUSD H1 - Updated 23/7/2025
chart has language
Only analysis and it is not Buy or Sell Recommendation.
Good-luck.
Bitcoin - Trust the higher timeframe!⚔️Bitcoin ( CRYPTO:BTCUSD ) is still 100% bullish:
🔎Analysis summary:
For the past couple of months we have been seeing an overall consolidation on Bitcoin. But looking at the higher timeframe, Bitcoin remains in an underlying strong bullrun. Consolidations are always expected and no reason to freak out since everything is still bullish.
📝Levels to watch:
$100.000
🙏🏻#LONGTERMVISION
Philip - Swing Trader

BTC / USD Daily ChartHello traders. Taking a look at the Daily on Bitcoin, I am watching for support to hold and for a break out above the $120k area. Leveraged traders need to be careful to not get smoked during any dips. Eventually we will need to retest that $111k area. Patience is key. We are just days / weeks away from Bitcoin going parabolic. Buckle up. All my thanks goes to Big G. Be well and trade the trend. Shout out to my crypto bro Josh. Happy Wednesday!!

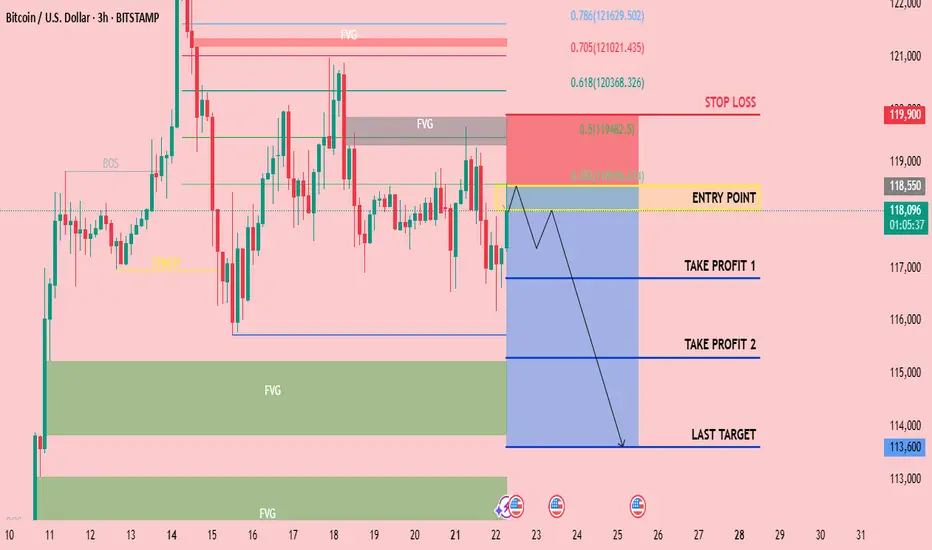
CHECK BTCUSD SIGNAL READ CAPTAINEntry Point: Around 118550 118100
Stop Loss: Around 119900
🎯 Target Levels
Take Profit 1:
116800
Take Profit 2:
115300
last target
113600
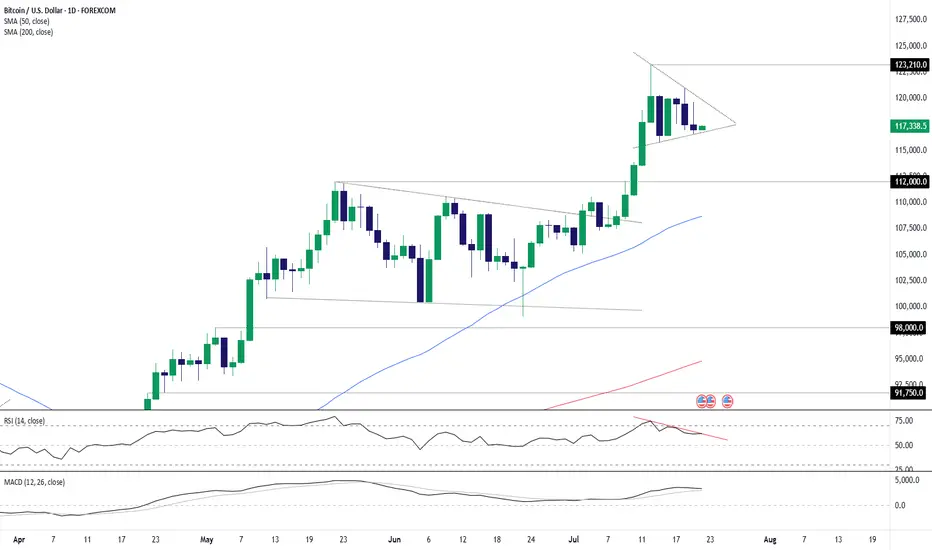
Bitcoin: Setup Builds for a Run Back Towards the HighsBitcoin is coiling within what resembles a bull pennant pattern, hinting at another bout of consolidation before the rally resumes. Trading near the lower end of the recent range, Monday’s pullback offers an appealing entry point, allowing longs to be established around current levels with a stop beneath the July 15 low for protection.
The downtrend from the record highs looms as the first hurdle, sitting around $119,700 today. A break above that level could prompt an accelerated move towards the current record high just above $123,000—an appropriate target for the trade.
Good luck!
DS
BTC/USD 21.07.25Targeting the $125,500 Resistance
Market Overview:
After a correction down to $116,850, Bitcoin held above the 144 EMA and is recovering toward the key resistance zone around $125,500. A bullish continuation pattern is forming.
Technical Signals & Formations:
— Strong support reaction from $116,850
— 144 EMA on 4H holding as dynamic support
— ABCD harmonic structure supports upside
— Break above $120,000 will confirm bullish momentum
Key Levels:
Support: $116,850, $113,700
Resistance: $123,300, $125,500–$126,000
Scenario:
Primary: continuation upward toward $125,500 with potential breakout
Alternative: minor pullback to $116,850 before next leg up

BTC / USD Daily ChartHello traders. This chart is for leveraged Bitcoin traders. Anyone freaking out about what Bitcoin will do should know that this dip now is only about a 10% dip or so from the ATH. We could easily shake out all the long positions in profit by revisiting the area marked on the chart. These temporary dips are for buying, not for getting taken out. Never forget that in order for you to win a trade using a leveraged account, someone or some entity must lose a trade. So it's better to try and ride the wave and trade the trend than to think we can outsmart algolorithmic stop loss hunting programs designed to take your profits. Better to DCA Bitcoin and Ethereum than to take chances of blowing your account on a perfect, yet volatile asset like BTC. Big G gets my thanks. Be well and trade the trend. Happy Friday.

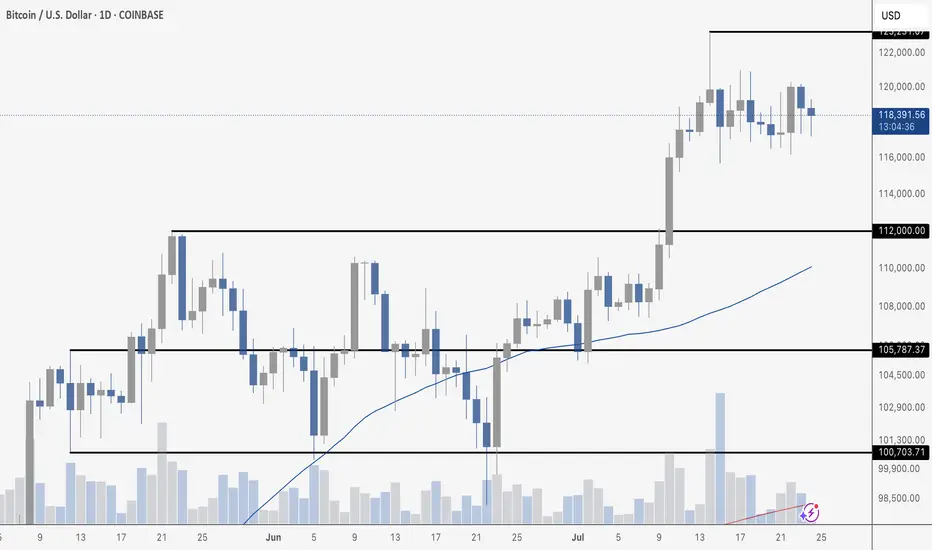
BTC CONSOLIDATESBitcoin is clearly consolidating after its recent breakout above $112K. Price is chopping between roughly $116K and $121K, taking a breather after last week’s rally. Tuesday marked the highest daily close in BTC history, but follow-through has been muted so far.
Volume is trending lower during this range-bound action, which is typical during consolidation. The 50-day moving average continues to rise and now sits around $110K, providing a strong cushion if price pulls back.
The structure remains bullish above $112K, but traders are watching for a breakout above $125K to confirm the next leg higher. Until then, expect more chop as the market digests gains.
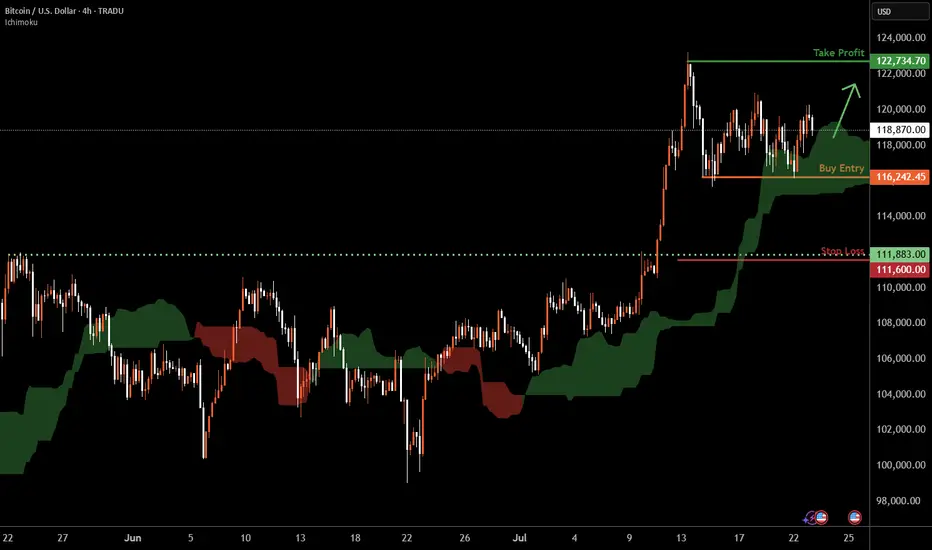
Bitcoin H4 | Crypto to remain elevated?Bitcoin (BTC/USD) is falling towards a multi-swing-low support and could potentially bounce off this level to climb higher.
Buy entry is at 116,242.45 which is a multi-swing-low support.
Stop loss is at 111,600.00 which is a level that lies underneath a pullback support.
Take profit is at 122,734.70 which is a swing-high resistance.
High Risk Investment Warning
Trading Forex/CFDs on margin carries a high level of risk and may not be suitable for all investors. Leverage can work against you.
Stratos Markets Limited (tradu.com ):
CFDs are complex instruments and come with a high risk of losing money rapidly due to leverage. 66% of retail investor accounts lose money when trading CFDs with this provider. You should consider whether you understand how CFDs work and whether you can afford to take the high risk of losing your money.
Stratos Europe Ltd (tradu.com ):
CFDs are complex instruments and come with a high risk of losing money rapidly due to leverage. 66% of retail investor accounts lose money when trading CFDs with this provider. You should consider whether you understand how CFDs work and whether you can afford to take the high risk of losing your money.
Stratos Global LLC (tradu.com ):
Losses can exceed deposits.
Please be advised that the information presented on TradingView is provided to Tradu (‘Company’, ‘we’) by a third-party provider (‘TFA Global Pte Ltd’). Please be reminded that you are solely responsible for the trading decisions on your account. There is a very high degree of risk involved in trading. Any information and/or content is intended entirely for research, educational and informational purposes only and does not constitute investment or consultation advice or investment strategy. The information is not tailored to the investment needs of any specific person and therefore does not involve a consideration of any of the investment objectives, financial situation or needs of any viewer that may receive it. Kindly also note that past performance is not a reliable indicator of future results. Actual results may differ materially from those anticipated in forward-looking or past performance statements. We assume no liability as to the accuracy or completeness of any of the information and/or content provided herein and the Company cannot be held responsible for any omission, mistake nor for any loss or damage including without limitation to any loss of profit which may arise from reliance on any information supplied by TFA Global Pte Ltd.
The speaker(s) is neither an employee, agent nor representative of Tradu and is therefore acting independently. The opinions given are their own, constitute general market commentary, and do not constitute the opinion or advice of Tradu or any form of personal or investment advice. Tradu neither endorses nor guarantees offerings of third-party speakers, nor is Tradu responsible for the content, veracity or opinions of third-party speakers, presenters or participants.
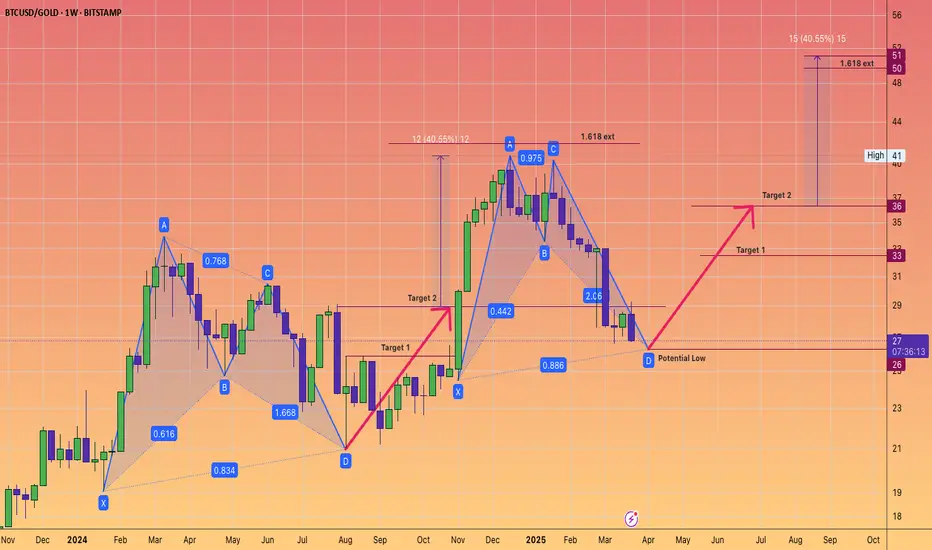
Bitcoin harmonic pattern. Back to back Gartley. BTCGOLD ratio.The BTC/GOLD ratio has experienced a significant correction, currently standing at 27 gold ounces per 1 Bitcoin, down from a peak of 41, representing a decline of 34%.
Gold, priced at $3,114 in US Federal Reserve notes, is in a sustained bull market.
It is reasonable to anticipate that the digital equivalent of gold will gain traction once gold stabilizes at a higher price point.
The Gartley pattern is recognized as the most prevalent harmonic chart pattern.
Harmonic patterns are based on the idea that Fibonacci sequences can be utilized to create geometric formations, which include price breakouts and retracements.
The Gartley pattern illustrated indicates an upward movement from point X to point A, followed by a price reversal at point A. According to Fibonacci ratios, the retracement from point X to point B is expected to be 61.8%.
At point B, the price reverses again towards point C, which should reflect a retracement of either 38.2% or 88.6% from point A.
From point C, the price then reverses to point D. At point D, the pattern is considered complete, generating buy signals with an upside target that aligns with points C and A, as well as a final price target of a 161.8% increase from point A.
Often, point 0 serves as a stop-loss level for the entire trade. While these Fibonacci levels do not have to be precise, greater proximity enhances the reliability of the pattern.
Will these consecutive Gartley patterns succeed in bolstering Bitcoin's strength? We will soon discover the answer.
Bitcoin Extends Rally – Eyeing $121K+📊 Market Overview:
•Bitcoin is trading around $120,013, up +0.0149% on the day, with a daily range of $117,715 – $120,691 — continuing momentum after a historic rally.
•The rally is supported by strong inflows into BTC ETFs, institutional demand, and pro-crypto legislation recently passed in the U.S. House of Representatives.
📉 Technical Analysis:
• Key resistance: $121,000 – $122,000 (next technical target post breakout)
• Nearest support: $118,000 – $119,000 (aligns with 50 MA and previous consolidation zone)
• EMA 09: Price is above the EMA 09, confirming strong short-term bullish momentum
• Candlesticks / Volume / Momentum: RSI and MACD remain bullish; rising volume in ETFs and institutional flows confirm upward momentum.
📌 Outlook:
Bitcoin is likely to extend its gains in the short term if it holds above $119,000–$120,000 and institutional buying continues.
• Holding above $120,000 → potential to test $121,000 – $122,000
• Falling below $119,000 → risk of correction to $118,000
💡 Suggested Trading Strategy:
BUY BTC/USD at: 119,500 – 120,000
🎯 TP: 121,500
❌ SL: 118,500
SELL BTC/USD at: 121,000 – 122,000 (if bearish reversal signals appear)
🎯 TP: 120,000
❌ SL: 122,500

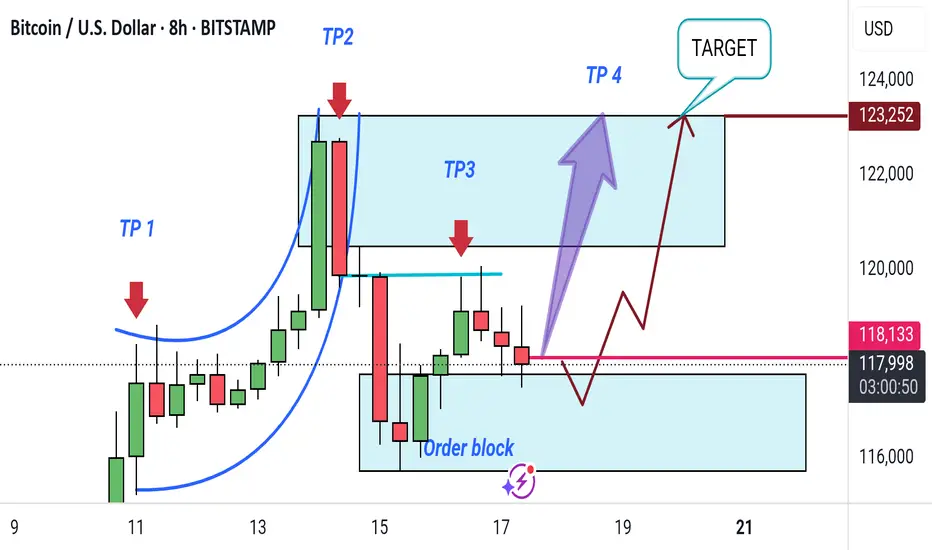
"Bitcoin Bullish Reversal Setup with Target Zones (8H Chart)"This 8-hour Bitcoin/USD chart shows a potential bullish setup. Key takeaways include:
Order Block: Identified support zone for possible reversal.
TP1 to TP4: Target points for profit-taking as price moves upward.
Target Zone: Final target area near $123,252.
Expected move: A short-term dip into the order block, followed by a rally toward the target zone.
BITCOIN I am short 121,600The chart posted is my work in Bitcoin I am short using the Blackrock Etf in PUTS 70strike

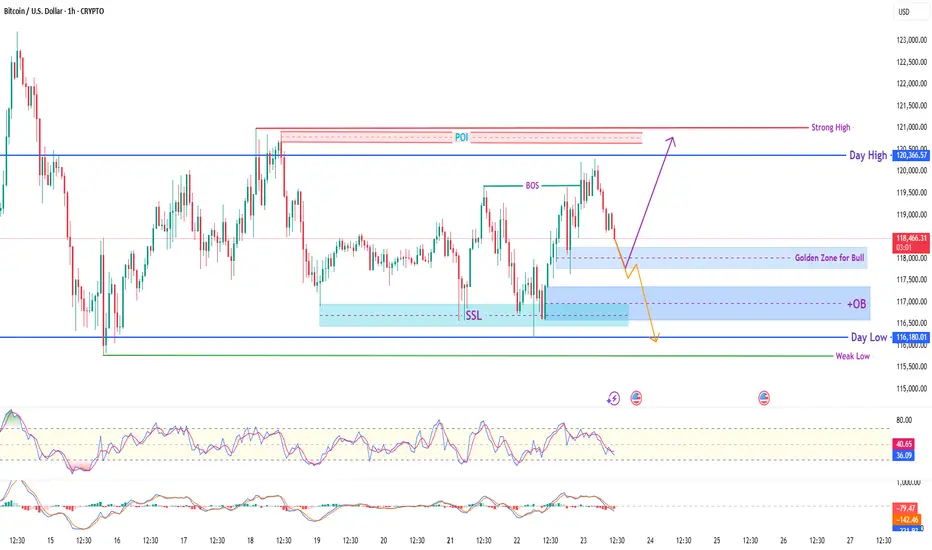
BTC/USD Smart Money Concept (SMC) Analysis – 1H TimeframeThis BTC/USD analysis is based on pure Smart Money Concepts. After a clean Sell-Side Liquidity (SSL) sweep and a strong Break of Structure (BOS), the market is retracing into a high-probability Bullish Reversal Zone.
📍 Trade Plan (Buy Setup):
🔹 Entry Zone:
116,800 – 116,200
(OB + Golden Zone + FVG confluence)
🔹 Stop Loss (SL):
Below 115,800
(Under Weak Low to avoid liquidity trap)
🔹 Take Profits (TP):
✅ TP1: 118,500 (Partial profit + BE move)
✅ TP2: 120,366 (Day High)
✅ TP3: 121,200 (Above Strong High / POI Liquidity Grab)
🧠 Key SMC Elements in Play:
✅ BOS Confirmed
✅ SSL Taken Out (Liquidity Sweep)
✅ OB + FVG Overlap (Refinement Zone)
✅ Golden Reversal Zone
✅ Day High & Strong High Liquidity Above
This setup reflects Smart Money behavior — liquidity grab followed by structural shift and pullback to premium OB/FVG zone for re-accumulation.
Watch for bullish price action confirmation (like bullish engulfing, internal BOS, or lower timeframe CHoCH) before executing the entry.
⚠️ Disclaimer:
This analysis is for educational purposes only. Please trade responsibly with proper risk management. Do not consider this financial advice.
📊 #BTCUSD #SmartMoneyConcepts #OrderBlock #LiquiditySweep #TradingStrategy #PriceAction #CryptoTrading #TradingViewAnalysis #SMC #FVG #TechnicalAnalysis
BTC FORECASTExpected push to the downside(below 114,400 region)
Breakout above current marked high.
Expected ATH(125,000) as target.
Best Regards,
Gideon Stephen (GS)
#bitcoin #crypto
A Legends Continuation. BTCHello I am the Cafe Trader.
Today we are going to look at a trade inspired by the Legendary Trader and Scalper Al Brooks.
If you are not familiar with him I recommend having a strong foundation with price action before giving him a look.
It's no secret that BTC is at levels many thought it would never reach, and yet many others are convinced of 5 - 10x more from this run alone. It can be crushing to feel like you missed out on the move, so instead of getting FOMO, I've detailed a guide to help you in the short or the long term.
Long Term
As of right now you are looking at 4 different levels of demand. It is up to you to measure your conviction, understanding why you want to invest, and how much you are willing to risk. Recognize that Many Big hedge funds have been hesitant with accumulating hoards of Crypto do to its volatile nature, considering it too risky.
So with this in mind, I have given you 4 levels to add BTC to your long term depending on your personal conviction.
Hyper Aggressive = Top of Demand $115,500 (willing to risk 50%)
Aggressive = Demand $99,500-101,250 (willing to risk 40%)
Fair Price = Strong Demand $74,000 - 78,000 (willing to risk 25%)
Steal = Extreme Demand $42,000 - 50,800 (willing to risk 10%)
Thinking about how much you are willing to risk will help you level out your Fear of missing this move, and get pricing that meets your personal demand.
Short Term
My fellow traders, this is a nugget (inspired) from Al Brooks. The "Two Bar Trend Break" .
In a strong trend (not in a range), When you get a trend break (I like to go top of wick to top of wick for this trade), if the second bar doesn't have a huge topping tail, but closes near the top, you can enter this trade.
Here is a trade that happened this month That hasn't filled yet (it got close).
Entry At the close of the second green candle $116,000.
Measure the bottom of the First candle that broke (called the Signal candle) to the top of the second bar that broke (called the Entery Candle). If you take that measurement, and add it to your take profit, you will have a 1R Scalp (1 measure of risk to 1 measure of reward).
This isn't a true scalp, typically they should be in the same bar or next bar, but this follows similar principles.
That's all for BTC, stay tuned for more analysis as we go over Ethereum, XRP, and one more of your choosing.
Happy Trading!
@thecafetrader

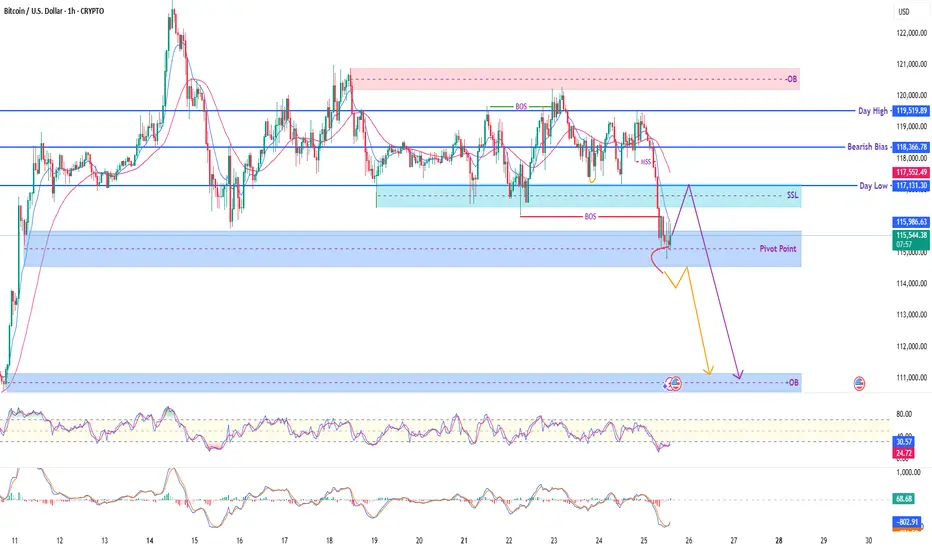
Bitcoin / USD – 1H Smart Money Outlook🔹 Current Price: $115,549
🔹 Key Zones:
🔴 Supply OB (Resistance): $119,500 – $121,000
🔵 Demand OB (Target Zone): $111,000 – $112,000
🔻 Bearish Bias: Below $118,366
⚠️ Pivot Point: $115,987
🔹 Day Low: $117,131 | Day High: $119,519
🧠 Market Structure Overview:
❌ BOS + MSS indicates internal weakness
🔁 Price rejected key resistance (OB) and shifted structure bearish
🔹 SSL (Sell-Side Liquidity) near $117,000 likely to be targeted
📉 Expected Scenario:
Retracement to SSL / Pivot → Continuation Drop
Possible minor bullish pullback but overall structure favors downside
📊 Indicators:
RSI: Bearish divergence zone (30.70)
MACD: Bearish momentum building
Price trading below EMA
✅ Bias: Bearish
🕰️ Timeframe: 1H
🎯 Plan: Look for short setups on retracement toward SSL / OB
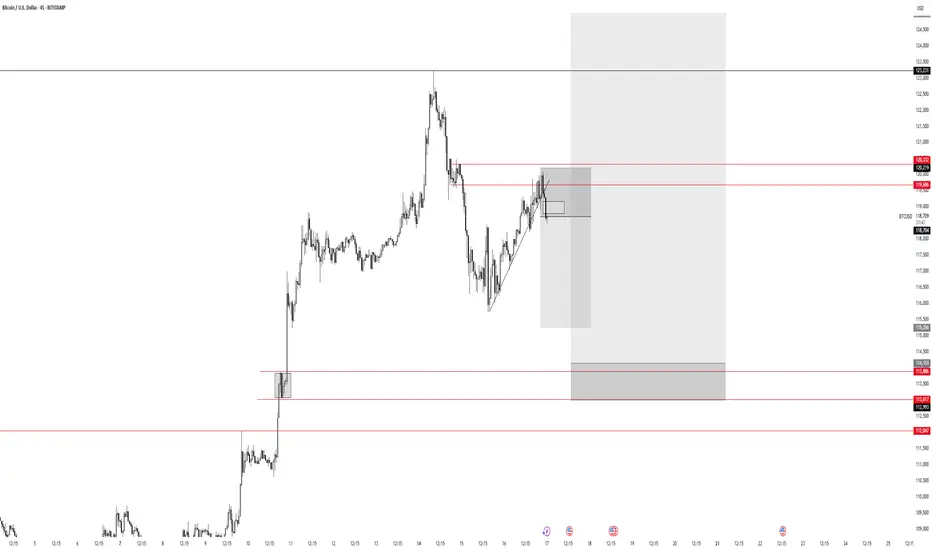
LONG BTC hello.
i m expecting to long from the w biSI
and the target is the projection
of course i will not go in without confirmation and 4 h bisi would be good
i will wait the price to give me an 4 h bisi then i will buy .targets are on the chart 1.62 fibo
is perfect

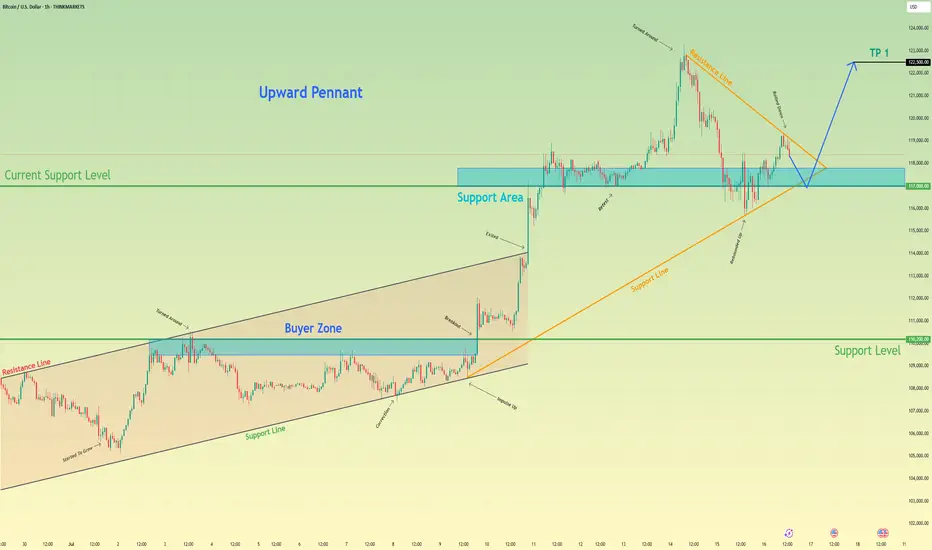
Bitcoin may exit of pennant and then rebound up of support areaHello traders, I want share with you my opinion about Bitcoin. Earlier, the price was moving inside an upward channel, respecting both the resistance and support boundaries. After reaching the buyer zone (110200–109500 points), BTC made a strong impulse up, breaking out of the channel and entering a new phase of growth. This breakout led to the formation of a bullish pennant, which often signals a continuation of the uptrend. Right now, the price is testing the support area between 117000 and 117800, which previously acted as a breakout zone and now serves as a current support level (117000). The structure shows that this level has already worked as a rebound zone multiple times. In my opinion, BTC may continue the correction toward this support area, potentially exiting the pennant to the downside for a short-term pull-back. After that, I expect a new upward movement, targeting the next local high. That’s why I set my TP at 122500 points, which is just below the recent ATH. Given the impulse move, strong support zone, breakout from the channel, and the bullish pennant pattern, I remain bullish and expect BTC to resume its upward trend soon. Please share this idea with your friends and click Boost 🚀
Disclaimer: As part of ThinkMarkets’ Influencer Program, I am sponsored to share and publish their charts in my analysis.