BTCUSD trade ideas

BTCUSD – Bullish Recovery Setup Forming Near Trendline Support🧠 Market Structure & Technical Breakdown
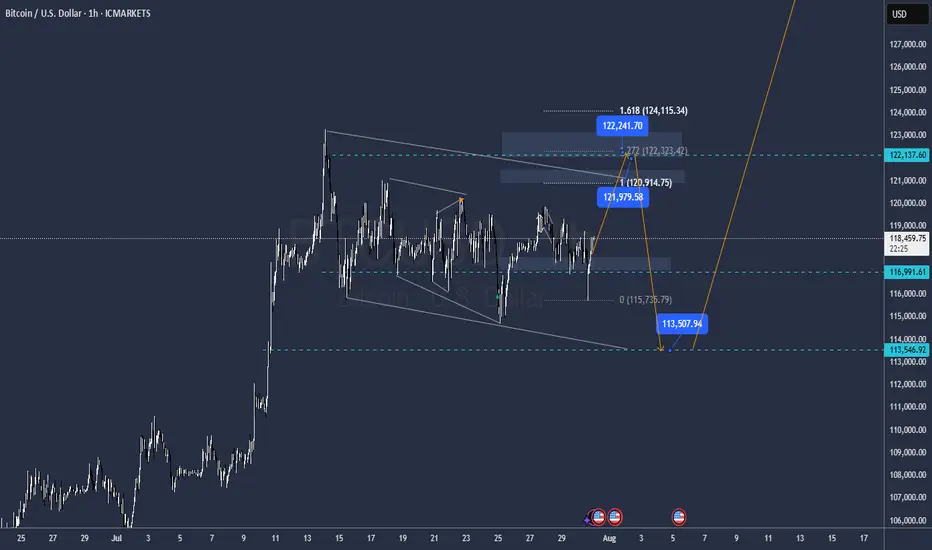
The BTCUSD 4H chart showcases a well-formed descending triangle or falling wedge structure with clearly respected major and minor descending trendlines. Currently, price action is testing a dynamic support zone, highlighted in green, which has been a strong reaction area in the past.
This area aligns with a bullish accumulation zone, from which buyers have previously stepped in to initiate impulsive moves. Given the confluence of diagonal support and horizontal price reactions, we may be on the verge of a bullish breakout opportunity.
📍 Key Zones & Trendlines
✅ Green Support Channel (Demand Zone): Acting as a key pivot for multiple recent rejections, this area (~114,000–113,000) is now being revisited again, offering potential buy interest.
📉 Minor Trendline: A short-term descending resistance around 120,000—likely the first barrier in case of a bounce.
📉 Major Trendline: A more extended dynamic resistance line connecting swing highs, currently intersecting near the 124,000 region.
🔄 Potential Price Scenarios
Primary Bullish Setup (MMC Plan):
Price bounces off the green demand zone.
Breaks above the minor trendline (~120K).
Pullback retest to confirm breakout.
Continuation toward the major breakout level (~124K and beyond).
Invalidation / Bearish Case:
A clean breakdown below 113,000 with strong bearish momentum would negate this setup, likely targeting the psychological support near 110,000.
🧠 MMC Mindset: Trade with Patience & Confluence
This is a classic accumulation-to-breakout scenario. Smart traders wait for confirmation—especially as BTC often exhibits false breakdowns before a major move. Monitor candle behavior, volume, and reaction to the minor trendline.
Let the market show signs of strength (like bullish engulfing, pin bars, or a breakout-retest) before committing to the upside. Avoid FOMO; the key is discipline and precision entry at structural break points.
✅ Trade Plan Summary:
Watch zone: 113,000–114,500 for bullish price action
Breakout level: Minor trendline (~120,000)
Target zone: 123,500–124,000 (Major resistance)
Stop-loss idea: Below 112,800 (Invalidation of structure)

BTC USD 180K BIG HOW?Trends and price targets is how, but realistically, it looks like 134k in the short term.
Drop is wicked if it were to occur, takes price to literally 12k, which you want to go all in if that occurs.
55k is another drop zone.
Otherwise, it looks fairly bullish.
buy zone marked in green,
sell in red.
watch the trends
and price targets are pretty accurate usually.
good luck!!
Custom charts by request.

BITCOIN, GOLD ANALYSISQuickly we dive into analyzing our favorite pairs for the day we check and confirmed our directional biased which at the end of the day 1:2 is being targeted. BTC is is in a tricky spot but we will always follow the direction of the market to be more o the safer side.


Trading balanceTrading balance The price of the asset has rebounded from the balance zone. With the prospect of growth into the resistance zone.

BTC SELLGoing for 4h reversal, dayle timeframe has a low that should be broken and potental liquidity taken to move higher, currently its shrinking price twords a middle price.
Red trend lines are potental buy direction, if brakes below, we go lower, if does not, it can be a pivot for buys.
Yellow squears are 5min gaps
Puruple are higher timeframe gaps
Ultimetly looking at 4h to either open below lows(117k) or wick to dayle low(red straight lines)

Bullish continuation?The Bitcoin (BTC/USD) has bounced off the pivot and could rise to the 1st resistance.
Pivot: 116,724.27
1st Support: 111,336.90
1st Resistance: 123,341.37
Risk Warning:
Trading Forex and CFDs carries a high level of risk to your capital and you should only trade with money you can afford to lose. Trading Forex and CFDs may not be suitable for all investors, so please ensure that you fully understand the risks involved and seek independent advice if necessary.
Disclaimer:
The above opinions given constitute general market commentary, and do not constitute the opinion or advice of IC Markets or any form of personal or investment advice.
Any opinions, news, research, analyses, prices, other information, or links to third-party sites contained on this website are provided on an "as-is" basis, are intended only to be informative, is not an advice nor a recommendation, nor research, or a record of our trading prices, or an offer of, or solicitation for a transaction in any financial instrument and thus should not be treated as such. The information provided does not involve any specific investment objectives, financial situation and needs of any specific person who may receive it. Please be aware, that past performance is not a reliable indicator of future performance and/or results. Past Performance or Forward-looking scenarios based upon the reasonable beliefs of the third-party provider are not a guarantee of future performance. Actual results may differ materially from those anticipated in forward-looking or past performance statements. IC Markets makes no representation or warranty and assumes no liability as to the accuracy or completeness of the information provided, nor any loss arising from any investment based on a recommendation, forecast or any information supplied by any third-party.

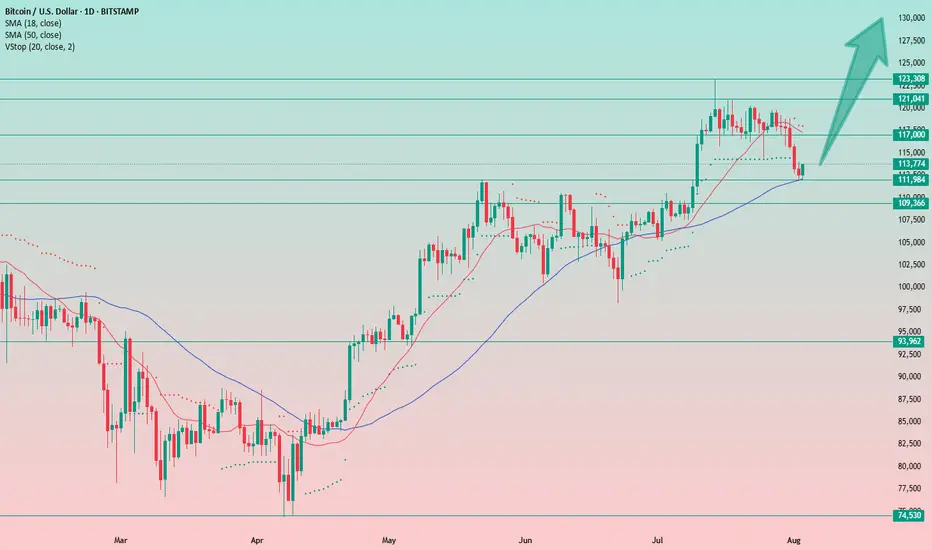
Bitcoin at Key Support: A Strategic Long OpportunityBitcoin has reached a significant support level, coinciding with the 50-day moving average around 112,000. The recent correction appears to have been absorbed by the market, and the broader uptrend remains intact.
This area presents an attractive opportunity for long entries, with a recommended stop-loss placed just below Friday’s low.
Target levels for the upward movement are projected at 117,000, 121,000, 123,300, and potentially higher.
Traders should monitor price action closely around this zone to confirm bullish momentum and manage risk accordingly.
sell pullback wave 4🌀 Elliott Wave Analysis Overview
The chart shows a completed major Wave (3), followed by an ongoing correction forming Wave (4).
Inside Wave (5), there is a clear 5-wave impulsive structure (labeled 1 to 5 in red).
After the peak at subwave 5, the market entered an ABC correction (labeled A, B, C in red):
Wave A marked the initial drop,
Wave B a brief retracement,
Wave C is currently developing and may still continue.
📉 Rising Wedge & Breakdown
A rising wedge pattern formed and broke to the downside — typically a bearish signal.
Current price (around $113,813) sits below the resistance zone at $115,000–$120,000.
If the correction deepens, major support lies at:
$102,548 (key support level),
$100,000 (psychological level),
And deeper Fibonacci projections (2.618 to 4.886 extension) between $89,000 to $83,000 — potential completion zone for Wave C.
🚀 Next Move Expectation
If Wave C is complete, BTC could launch into the next impulsive Wave 3 of a larger cycle, targeting:
$120,000
$123,879
Or possibly higher as Wave (5) unfolds.
🔍 Summary
This chart suggests Bitcoin is at a critical turning point:
Either it bounces from current support to start a new impulsive move up (Wave 5), or the correction extends deeper into the Fibonacci zone before a real bullish continuation.

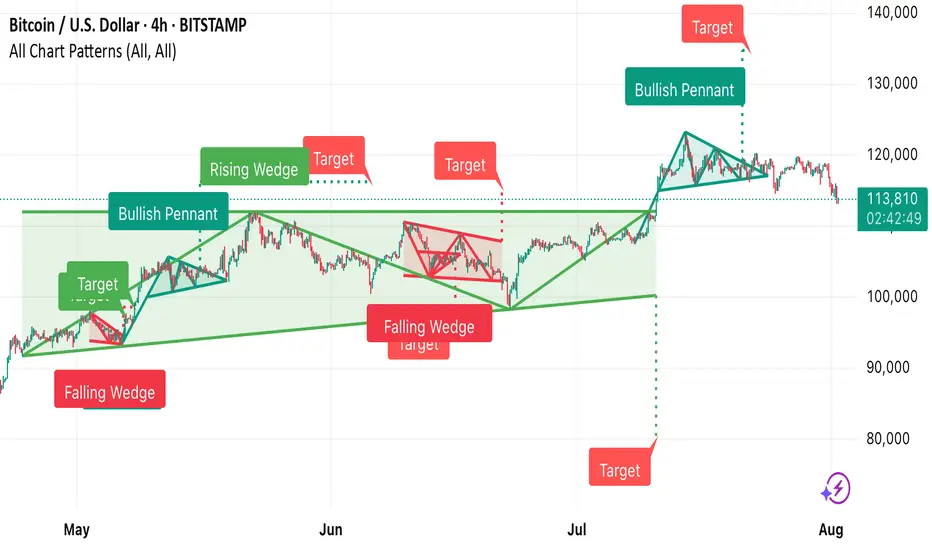
This Bitcoin 4-hour chart from TradingView shows multiple techni • Falling Wedge (early May) → Bullish breakout, target achieved.
• Bullish Pennant → Strong upward continuation.
• Rising Wedge (June) → Bearish breakdown, target met.
• Falling Wedge (mid-June) → Bullish breakout, target achieved.
• Bullish Pennant (late July) → Upward move toward the 140,000 target zone.
Currently, BTC is trading around 113,829, below recent highs, and near the dotted horizontal support zone from the last breakout.
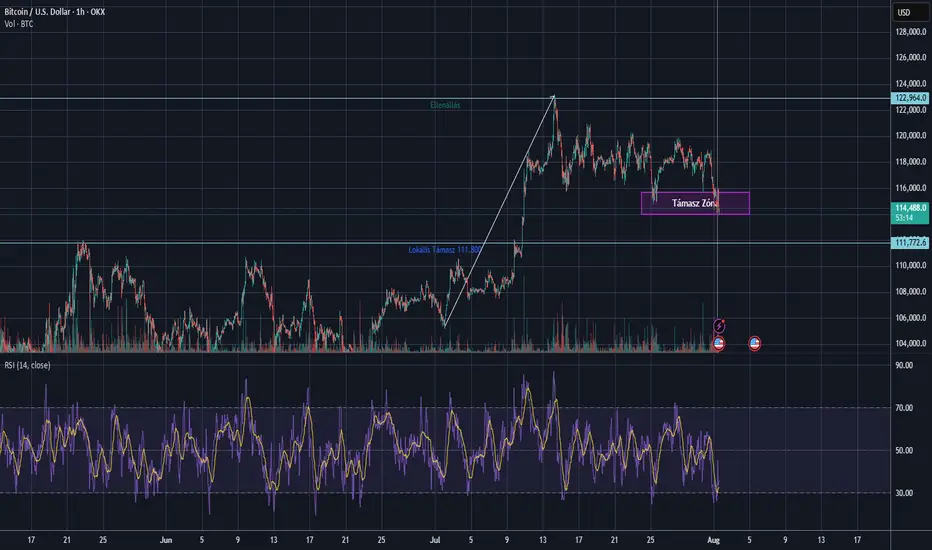
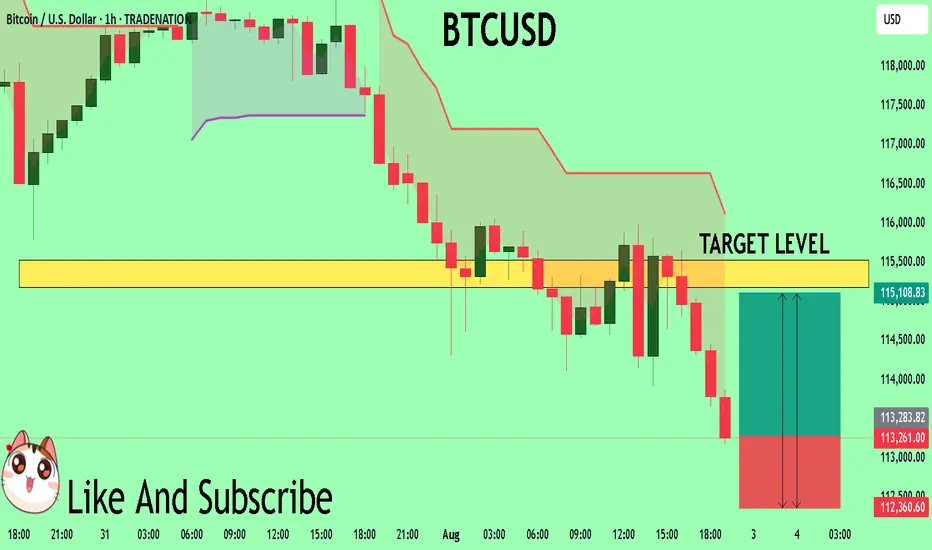
BTC Breaks Support – What's Next for Bitcoin?🧠 Bitcoin Technical Analysis – August 1st, 2025
📉 BTC/USD is under pressure, currently trading near $114,200, after dropping from the recent range highs. The chart shows a clear breakdown from a key consolidation zone between $114,000–\$115,500, marked as a crucial support zone.
🔍 Key Observations:
Major resistance remains at $123,000, where BTC topped mid-July.
A bullish trendline from early July has been broken — confirming momentum shift.
Local support sits at $111,800, a potential next landing zone if this breakdown continues.
The RSI (14) is now in oversold territory, below 30, signaling potential bounce or short-term relief — however, no bullish divergence is visible yet
---
🔎 Volume Spike & Momentum:
A noticeable volume spike has appeared alongside the breakdown, confirming strong selling pressure .
Short-term moving averages (e.g., 10 EMA) are now above price, adding to the b earish short-term bias.
🧭 Conclusion :
This region is critical for bulls — if BTC can reclaim the purple support box, it could invalidate the breakdown and trap aggressive shorts. Otherwise, \ $111,800 is the next area to watch for a reaction.
Let me know your thoughts below — Will this support hold or is \$110k next?
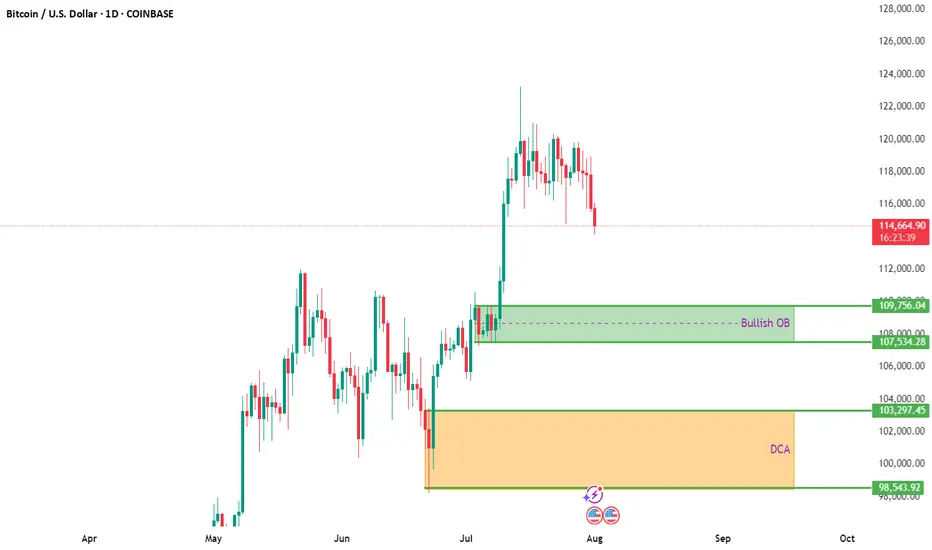
BTCUSD Daily Analysis – Key Entry & DCA ZonesBitcoin is currently pulling back after a strong bullish move, now hovering near $115K. The correction opens a potential window for smart entries based on prior market structure and order block analysis.
🔍 Bullish Order Block (OB):
✅ Zone: $107,534 – $109,756
This area previously served as a breakout zone after consolidation. A retest of this region could act as strong support, making it a prime candidate for short- to mid-term bullish setups.
🟧 DCA Zone (Long-Term Accumulation):
✅ Zone: $98,543 – $103,297
Ideal for long-term investors looking to build exposure gradually. Dollar-cost averaging in this zone allows entry at historically undervalued levels in case of a deeper pullback.
🧠 Trading Insight:
Patience pays. Let price come to your levels rather than chasing. Use alerts and consider scaling into positions with proper risk management.
📌 Chart Context: 1D | COINBASE
📆 August 2025
📈 TA by: @NFX_Solutions
#BTC #Bitcoin #Crypto #BTCUSD #TechnicalAnalysis #OrderBlock #TradingView #CryptoStrategy #DCA #SwingTrade #SupportZone
NO FEAR on BITCOIN!I was waiting for a break on this level from some days, and here we go! We catched a nice long setup previous days, and now Bitcoin broke down the key level i highlited last week. This is an important support area that will now act as resistance, so i expect a continuation to the downside till the second support area at $112.000. To invalidate this setup we should expect a clean break above $116.800.
Let me know in the comment what do you expect!

Bitcoin Intraday Analysis 31-Jul-25Quick analysis on bitcoin, the main area of interest i will be monitoring are 110,500, 115k, 120K. Keeping in mind that we still have important economic data tomorrow (US Employment Data).
Disclaimer: easyMarkets Account on TradingView allows you to combine easyMarkets industry leading conditions, regulated trading and tight fixed spreads with TradingView's powerful social network for traders, advanced charting and analytics. Access no slippage on limit orders, tight fixed spreads, negative balance protection, no hidden fees or commission, and seamless integration.
Any opinions, news, research, analyses, prices, other information, or links to third-party sites contained on this website are provided on an "as-is" basis, are intended only to be informative, is not an advice nor a recommendation, nor research, or a record of our trading prices, or an offer of, or solicitation for a transaction in any financial instrument and thus should not be treated as such. The information provided does not involve any specific investment objectives, financial situation and needs of any specific person who may receive it. Please be aware, that past performance is not a reliable indicator of future performance and/or results. Past Performance or Forward-looking scenarios based upon the reasonable beliefs of the third-party provider are not a guarantee of future performance. Actual results may differ materially from those anticipated in forward-looking or past performance statements. easyMarkets makes no representation or warranty and assumes no liability as to the accuracy or completeness of the information provided, nor any loss arising from any investment based on a recommendation, forecast or any information supplied by any third-party.

BTC this other snicky guyit is amazing as the meassures remains the same
The buy it is not ready the buy is in 113.500
either from 121000 or from 122000 it will fall, Im in the internalk buy right now and also will be selling from 121.000 and 122.000 too
GG
BTC / USD Daily ChartHello Crypto traders. Just a quick chart about what is happening in my opinion with Bitcoin. There is way too much institutional money and wall street money now flowing into Bitcoin, that when this pops, it will be epic. Saying that, I have marked the areas of interest on the chart. Until we break and close above $120k on a daily or 4 hour at the minimum, we are just ranging. As long as $117,087 / $118,000 area holds as support, we should push up at some point this week. If we lose support at said area, we can easily look to fill the wick. It's early in the week, so we will see what paths Bitcoin carves out. Be well and trade the trend. All my thanks goes to Big G. Thank you so much for checking out my chart/analysis.


SELL BTCUSD for bullish trend reversal SELL BTCUSD for bullish trend reversal
STOP LOSS : 122,500
Trade trade is based on false breakout and divergence.....
First what is false breakout, A false breakout in Forex occurs when the price breaks through a key level (like support or resistance) but quickly reverses and returns to its original range, often trapping traders who were expecting a continuation of the breakout. It's essentially a false signal, indicating a potential trend reversal or continuation, but the price doesn't follow through....
Secondly what is divergence ,In forex trading, divergence occurs when the price of a currency pair moves in one direction, while a technical indicator (like an oscillator) moves in the opposite direction. This mismatch can signal a potential trend reversal or weakening trend. There are two main types: bullish and bearish divergence.
On this trade we are taking it because we saw regular bearish divergence
Regular Bearish Divergence
In case of Regular Bearish Divergence:
* The Indicator shows Lower Highs
* Actual Market Price shows Higher Highs
We can see a strong divergence on the RSI already and There is a strong trend reversal on the daily time frame chart.....
The daily time frame is showing strength of trend reversal from this level resistance so we are looking for the trend reversal and correction push from here .....

BTCUSD Will Explode! BUY!
My dear followers,
I analysed this chart on BTCUSD and concluded the following:
The market is trading on 11326 pivot level.
Bias - Bullish
Technical Indicators: Both Super Trend & Pivot HL indicate a highly probable Bullish continuation.
Target - 11517
Safe Stop Loss - 11236
About Used Indicators:
A super-trend indicator is plotted on either above or below the closing price to signal a buy or sell. The indicator changes color, based on whether or not you should be buying. If the super-trend indicator moves below the closing price, the indicator turns green, and it signals an entry point or points to buy.
Disclosure: I am part of Trade Nation's Influencer program and receive a monthly fee for using their TradingView charts in my analysis.
———————————
WISH YOU ALL LUCK
bitcoin sell setup.price dropped below previous low and remain down there for a long time, this shows sellers strength and willingness to push down. we expect a sharp move from here

BTCUSD looking to SellI'm expecting BTC USD to enter into the break of structure and retest zone that is in f4HRS and and then push down from there with a 1:4RR hitting the next point of interest / area of interest

BTCUSD has boken Support and falling to 110KBTCUSD has boken Support and falling to 110K. This decline is due to General fall in equity market due to Tariff war.
