Bitcoin correction. Waiting for 70k-76kBitcoin correction. Waiting for 70k-76k
The previous idea suggested Bitcoin would reach $95,000-$100,000 before entering a 1-2 year bear phase alongside the U.S. stock market decline.
Bitfinex:
However, based on Coinbase orders in the $70,000-$76,000 range and recent BTC sell-offs on Bitfinex over the past three days, it looks like this correction is being dragged out to trigger more liquidations.
This crypto correction might also align with an SP500 drop. Waiting for lower levels to find good entry points.
Coinbase orders:
BTC/USDC Liquidation Heatmap
BTCUSDC trade ideas

Shorting BTC into daily resistance200D MA and BMSB act as resistance. Shorting into such a big resistance with good R:R Is a good ideea. The EQ highs present a risk for a draw on liquidity but also the lows that remain untapped below the ranging that let to this pump.

BTC ShortTop of the range into 200DMA and BMSB. Risky trade since we have those EQ highs but the R:R is there and we are shorting into resistance. Also the ranging before the pump left untapped lows for liquidity.

Short trade
📉 Sell-side Trade – BTC/USD
📅 Date: Sunday, April 20, 2025
⏰ Time: 4:00 AM (NY Time) – London Session AM
📊 Timeframes:
Structure: 4Hr
Entry: 15min
Trade Parameters:
Entry: 84700.0
Take Profit (TP): 84423.5 (–0.33%)
Stop Loss (SL): 84756.5 (+0.07%)
Risk-Reward Ratio (RR): 4.89
Reason: RSI divergence on the 5min TF and after confirmation of lower high rejection within a 4Hr bearish structure seemed indicative of a sell-side trade. Bearish FVG on the 4Hr TF or imbalance to fill is my assumption for target.

Long trade
📈 Trade Breakdown – Buyside (BTC/USD)
📅 Date: Thursday, April 17, 2025
⏰ Time: 3:00 PM (NY Session PM)
🪙 Pair: BTC/USD
📊 Trade Direction: Buy (Long)
Trade Parameters:
Entry: 84,552.5
Take Profit (TP): 85,333.5 (+0.92%)
Stop Loss (SL): 84,467.5 (–0.10%)
Risk-Reward Ratio (RR): 9.19
🧠 Trade Narrative:
Entry into the discount zone of a short-term range
With the assumption of price expanding towards a local high or imbalance for a buyside trade idea.

Long trade
📈 Trade Breakdown – Buyside (BTC/USD)
📅 Date: Thursday, April 17, 2025
⏰ Time: 12:00 PM
🪙 Pair: BTC/USD
📊 Trade Direction: Buy (Long)
Trade Parameters:
Entry: 84,569.5
Take Profit (TP): 85,338.0 (+0.91%)
Stop Loss (SL): 84,384.5 (–0.22%)
Risk-Reward Ratio (RR): 4.15
🧠 Trade Narrative:
A midday NY session continuation to the upside. Targeting the next liquidity pocket above recent highs.

BTC 4H VS 1D 200 EMAIt's quite a rare occurrence when the 200 EMA finds itself in a very similar position but right now BTC has that exact setup.
On the 4H BTC is fighting the moving average for the 12th time since losing the support level at the beginning in February. At this time the bearish trend channel upper limit also coincides with this level now, IMO a big move is being setup, but the direction is unsure.
On the daily we're seeing the moving average also in line with the trend resistance however the curve itself differs to the 4H in the way that it's levelling out from an uptrend, not levelling out from downtrend.
Bullish scenario - Breaking out above the moving average and trend channel with strength I believe would start to bring buyers back. Now I would not expect buyers to come flooding in at once as many have been burned too many times trying to long a breakout only for it to be a fakeout. I could see many looking for a form of confirmation, be that a retest as new support or a new HH & HL structure.
Bearish scenario - Yet another rejection off this level would be continuation of the downtrend with many adding to their shorts. This to me would be tied to the SPX/ Tradfi movements although those markets are much stronger than this time last week.
In conclusion there is no clear sense of direction just yet but I think it's coming very soon. The chop we are seeing at the moment is a symptom of a lack of confidence and uncertainty in market conditions. Naturally this lends itself to a continuation of the downtrend but all it takes is a catalyst and some big believers to push BTC out above the downtrend to continue the bullrun. I think we get our answer soon.

Long trade
Trade Breakdown – Buy-Side (BTC/USD – Intraday Setup)
📅 Date: Monday, April 7, 2025
⏰ Time: 1:15 PM NY Time (NY Session PM)
📈 Pair: BTC/USD
📈 Trade Direction: Long (Buy)
Trade Parameters:
Entry Price: 78,281.5
Take Profit (TP): 79,619.0 (+1.71%)
Stop Loss (SL): 77,890.0 (-0.50%)
Risk-Reward Ratio (RR): 3.42 🚀
Reason: The Buyside trade idea is based on the midday continuation move, possibly a pullback entry from intraday demand. Targeting near-term highs or key resistance, with structure suggesting bullish continuation.

BTC Massive Drop Imminent (50% - 70% Value Shed-off)The wisdom of regression is clear- SHORT BTC.
BTC is on a journey to shed off significant amount of it's weight. We are talking 50% -70% shed-off.
Possible Reversal Points include 67,000-60,000 and 35,000-40,000.
This move is not for the faint-hearted. Requires patience.
Hold on position for a good number of months ahead.
All the best.


Last upward phase of a 4-year cycleTakeProfit range: 136-141k
Duration: 3-5 months
On a pure simple technical basis.
Today:
- Bitcoin: Exchange Inflow (Total) - All Exchanges:
Strong Friday, weekly peak Friday traffic 49k
25k on Saturday, compared to 7-8e on previous weekends.
- Bitcoin: MVRV Ratio 1.92
- Frear & Greed Index: 26
Source:
cryptoquant.com
cryptoquant.com
www.coinglass.com
Risk:
If the chart breaks to the downside, a longer 2-year sell-off will start.

BTC DAILY - MA compression On the daily timeframe something very interesting is happening. A convergence of price around the blue KEY S/R is very interesting when you factor in what the moving averages are doing around this level also.
1D 200 EMA is completely flat having lost all of its momentum with the months of chop and then the sell-off into current levels. For a bullrun to be credible you want to see price above this level and a steady/steep slope up. Due to the lack of direction of this moving average price is able to climb above and drop below very easily and therefor it is neither support nor resistance until there is a trend.
1D 25 EMA is a different story, now that BTC has put in a local top and trending down, the 25 EMA is resistance but has been flipped in the last few days with price bouncing off the level 4 days in a row. This is good news for the bulls but the longer we linger here there is more chance dropping back under it.
Diagonal resistance as simple as it is has 4 points of contact and will be a big point of resistance and one many traders will be keeping an eye on.
On the lower timeframes we're seeing a bullish channel, a loss of this channel would be a huge red flag and a catalyst for a risk off event IMO, continuing the downtrend.

BTC About to pumpThe fib shown is from the daily. Next target is 93k and if that breaks, we approach 100k again.

My view on BTC and Global crypto marketAfter breaking out of a larger descending wedge, BTC has been steadily climbing and is now forming a rising wedge on the daily chart. This pattern often signals a possible pullback, especially as price approaches a key horizontal resistance.
If BTC manages a clean breakout above 90,000 and holds, it would invalidate this short setup. In that scenario, I’ll step aside and wait for a clearer opportunity.
Remember, risk management is key —use a stop loss and size positions responsibly. This is not financial advice, just my personal view.
Good luck and happy trading!

Bitcoin Plan B Update — a correction to $95,000-$100,000.I’m now expecting a correction to $95,000-$100,000.
After that, the bearish phase kicks in, targeting $5,000.

BITCOIN 4H - 8th time lucky? The 200 EMA is a great indication of the environment a certain asset is currently in. If the 200 ema is not being respected as neither support nor resistance then generally the market environment is rangebound. If an asset is in a trending environment then the 200 ema is often being respected, as in the moving average acts as a key support in an uptrend or as resistance in a downtrend.
What we have seen from BTC is a clear shift from rangebound PA where it seems as though the 4H 200 EMA has no effect on price and is sat relatively neutral with no gradient, to a clear downward gradient capping off any attempt for the bulls to move higher. Eight separate occasions the bulls attempted to flip the moving average and failed each time, until now?
Having ended last week strong with a reclaim of $86,000 an early Monday push has seen BTC close a 4H candle above for the first time in 7 weeks. It is important to note that when the MA is still sloping downward it is still seen as a resistance level, a retest as new support while the slope levels out is always a possibility.
I am now interested in the question of, if Bitcoin reclaims the 4H 200 EMA, does it flip to a bullish trend or another rangebound one? That's where the $91,000 S/R comes in, as a reclaim of that level would put BTC into a LTF rally and therefor bullish trend, rejection off that level would see the MA level-out and becomes less important and therefor rangebound.
Comment with your thoughts on this idea.

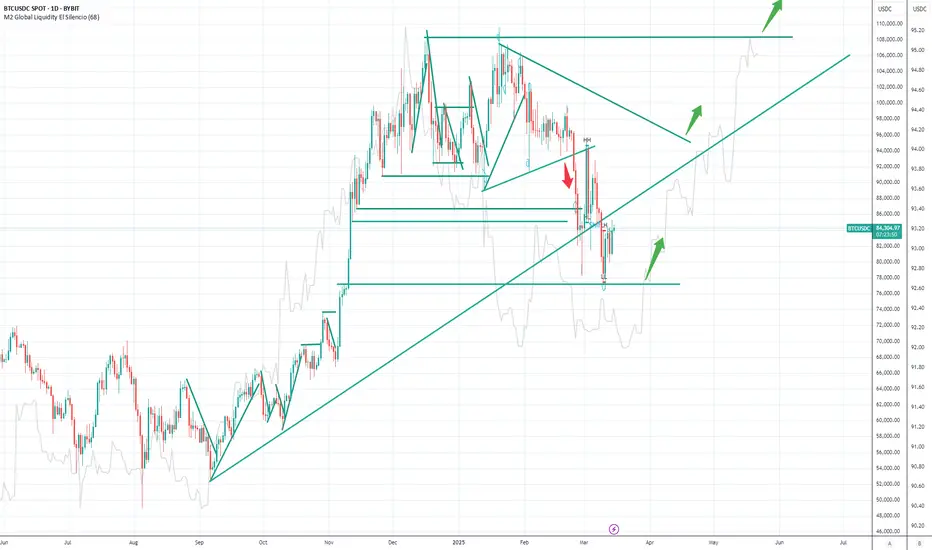
M2 LiquidityTrend reversal expected around March 25-30!
77k support, bull run can start. Bounce is expected if the fall continues. Double bottom formation with narrow STOP entry option.
M2 Liquidity indicator forecast 10 week offset W1 (68 day D1 view).
big crash 13/3 big crash 13/3 20% down the bull market is over....Trump is full of shit just a Jesuit puppet

Bitcoin is gearing up to drop to $50-$55K.Bitcoin is gearing up to drop to $50-$55K:
Hey everyone!
As you’ve probably noticed, this week altcoins and meme markets have been falling aggressively, including names from Murad's list like $SPX.
➖ The broader market also shows signs of a downturn. If you check monthly charts for the Dow Jones, S&P 500, and other indices, they’re aligning for a drop.
➖ The catalyst could be anything—from the wildfires in California to a potential strike by Iran on Israel.
Take note of the prepared orders on Coinbase targeting $50-$55K.
➖ Binance’s BTC/USDT Liquidation Heatmap over the past 6 months (Model 3 from CoinGlass) also highlights liquidation interest in this area.
When you put all the pieces together, the odds favor a drop. Market makers would likely want to shake out recent buyers of altcoins, meme coins, etc., before any significant rally.
Avoid leverage or futures trading—it’s the easiest way to lose your deposit in this environment.
No Financial Advice, Do Your Own Research.

Bitcoin follows Fibanacci Leverls PERFECTLY - Easy tradingBitcoin has a habit of moving Rapidly, Randomly and at times, with Huge levels of volatility.
An yet, ALWAYS, it obeys Fibanacci levels to the Key.
The chart above shows this very well on a Weekly time scale.
Since the Low and start of this cycle on 13 Jun 2022, Bitcoin has moved Time and time again with Fib Extensions and Fib Fans providing Support and resistance.
The Diagonal Rising lines are a Fib Speed Resistance Fan and the Horizontal lines are Trend-Based Fib Extension
See how on each "Step" or period of Ranging that Bitcoin has done since the low, it has been perfectly "Contained" by 2 Fib lines.
The Fib Fan can also be seen to act as support or Resistance along the way.
And right now, if we Look at the daily version of this chart, we see the situation unfolding.
Firstly, see that rising Fib resistance line that just rejected PA on sunday - STRONG
It pushed PA back below that 3 Fib extension
That same 3 Fib ext line acted as strong support since we entered this range back in December 2024. It maybe as tough to cross back over and flip back to support.
See how PA has already tested the 2.768 Fib extension below, using the rising Fib Fan and then that Fib extension to stop its fall.
To me, this points towards PA possibly remaining in this Range, between the 3 and the 2.768 fib lines till we meet that next line of rising Fib fan in the later half of March ( Around 21st )
The 50 SMA ( not shown) is rising just below this line currently and I expect PA to bounce higher when the two meet.
And so, for me, I am expecting PA to remain in a range between 91K and a low around 82K with wicks Flashing Lower to around 78K
Obviously, Things can change very Quick with Bitcoin and invalidate all this in no time..but, for now....I have my SPOT Buy Orders from lows at 78600
I am not going to miss the chance of Buying Bitcoin at that price, understanding the real Cycle ATH will be in Q4 and expected to be over 200K
Lets see if this works out

Bitcoin Bottom Coming -65,500Watch out this week bitcoin Will draw a big dropping line to bottom at 65,500.
Strategy is we sell the crests till the bottom.
All the best....

Bitcoin's Bottom Coming - 65,500Watch out this week BTC will draw a big bearish line to the bottom 65,500 before it can rebound.
Strategy is we sell the deep till 65,000.
All the best.

Be careful with BTC !!!The price drops to around 93K dollars and then pumps to 97K dollars.
Give me some energy !!
✨We spend hours finding potential opportunities and writing useful ideas, we would be happy if you support us.
Best regards CobraVanguard.💚
_ _ _ _ __ _ _ _ _ _ _ _ _ _ _ _ _ _ _ _ _ _ _ _ _ _ _ _ _ _ _ _
✅Thank you, and for more ideas, hit ❤️Like❤️ and 🌟Follow🌟!
❗Disclaimer
⚠️Things can change...
The markets are always changing and even with all these signals, the market changes tend to be strong and fast!!
