BTC/USD SHORT IDEAbtc at resitance trend line, shorting to two zones, tp1, tp2. price reject of the resistance
BTCUSDC trade ideas


Btc routeBitcoin will have 3-4 weeks green and after that will find buttom
It is just my opinion so you need to dyor

BTCUSDC CYCLE CHART Purchase position READY FOR FILL THE PORTFOLIO ?????
looking for an up move in BTC to open a short position
or
waiting for buy altcoin in $23000 channel of BTC

BTC Bitcoin Price CurrentlyProjection with squeezes, and idk because the description takes the entire screen and I can't see my chart when I'm typing but fulfilling the allotted space required to present a image, messed up ... i know .. check it..

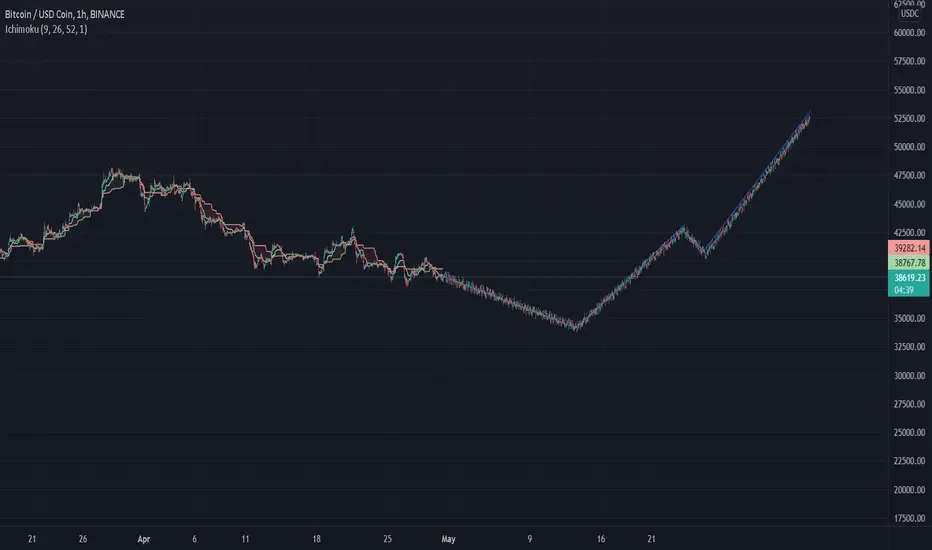
Bitcoin to $52k by end of MarchMaybe by March 10th. Yes, 46 days from now.
The number of short ideas on tradingview right now is funtastic. $25k, $20k, $15.. and so on.
Price action could not break $29.8k on July 20th with 2,568,000,000 exchange reserves @ $29.8k it is not going to break $30k with 2,379,000,000 today. A year ago today, Jan 24th 2021: 2,452,000,000 @ $32.3k
I don’t know where the bottom is, but it very close and will be found by mid-Feb at the latest between the above numbers $32.2 to $35k (the orange lines on the above 1-day chart). This is not a place you should be going short.
As for statistics, this one is sickening. Over the last 1-2 weeks almost 80% of selling volume came address created last year. Can you believe that? I don’t know what prices those coins were acquired but it is very likely they were sold at a loss.
To the date and target.
Red boxes:
66 days exactly from the peak price action to the death cross. Both previous and current. Spooky.
Orange boxes:
32 days from the death cross to the breakout, that would mean sideways price action between $34k and $41k between now and February 15th.
From the June death cross price action fell a max of 23% (wick to wick). Just where price action is now, -24% at $34k. It is no coincidence $34.4k and $36k are offering a lot support, look left, right on top of past resistance.
Green boxes:
It took price action 24 days to return to the 0.618 golden ratio as measured from peak to trough (April through June). Now the only assumption made here is the bottom is $34k. If the bottom is $32k it takes $500 off the $52k target. No great shakes.
The sell off over the last several days was drastic, the recovery could be just as quick, like March 2020. Look left. This is the reason for the March 10th date. However should the recovery be elongated as with the summer of 2021; then by end of March.
What will drive the recovery? The end of the stock market correction. There’s an idea about that coming up, keep a look out! Much will depend on what the FED says this coming week during the Tuesday / Wednesday meetings.
Good luck.
WW

BTC/USDTPatiently waiting for BTC to complete its consolidation phase.
After that we will see if BTC bounces back or breaks to lower prices.

$BTC Lower high! Double top! (Inverted)Pair of lower highs here and a double top after a nice run up to the 1.272 on the Bullish dragon breakout!
(Inverted of course)
The idea here is Bitcoin (Inverted) does not look like an asset id be going long on, infact, it looks like a great asset to short.
This is a nice exercise to do when evaluating your bias.
I wouldnt be surprised to get another go at the lows we outlined in previous charts, but time frame is tough here, because while options expiry would suggest we will be over 39k tommorow, there is plenty of time to attack the lows and spring out of the range prior, or run to the highs first and then go for the lows afterwards when the liquidity is released. In either case, there has been no invalidation of the bullish trend, and my bias remains the same until invalid.

BTC/USDTPossible short on BTC?
The consolidation phase had breakout to the down side and now seems like it is forming a low-timeframe correction to continuo its movement.

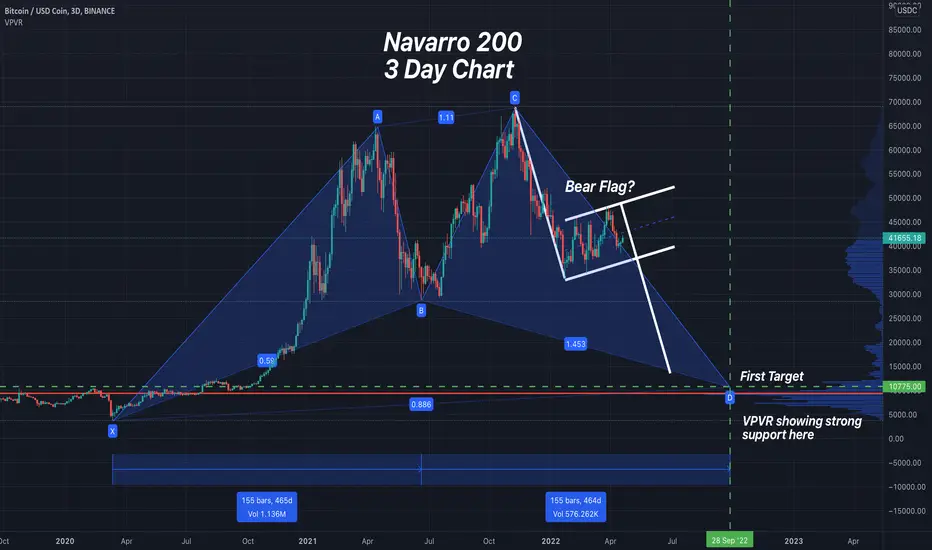
Bitcoin Analysis 4/21/22 (Navarro 200 Harmonic Pattern)Bitcoin appears to be forming a Navarro 200 Harmonic Pattern on the 3D chart. The first price target of this pattern is around $10.7k around late September 2022. It's hard to imagine Bitcoin dropping this low but at the same time when Bitcoin was at $69k everybody on YouTube was saying Bitcoin at $60k is cheap. Anything can happen in the Crypto Market. Especially the things we thought were impossible.
BTC until 2025We can see that we are starting a long accumulation process.
We are all bullish on crypto in the long run due to the mass adoption. Nevertheless, we should not forget about the regulation also. This is in many cases hitting the growth.
Hacks are affecting less and less to the general price action. Instead regulation is affecting as well as the natural way of the halving.
Halvings are affecting not just to BTC but to the general growth of the industry.
My analysis comes up from the study of the happenings after the last ATH for each halving cycle, and also what happened before the next halving for each halving cycle.
We can find similarities in the behaviors of BTC by approx. 1 year after the ATH, and by approx. 1 year before the next jump.
I draw a few entries point I hope it helps you to make the perfect entries and set your best targets.
Appreciate the hard work and press like.
Happy trading,
Raf

$BTC #BitcoinI think its still a little early here to call but if we manage to break above 44k again here, we could catch a nice breakout and usher in the Bullish Gartley return. You can see momentum is beginning to shift, and even if the larger trend was to remain bearish, i think there is a mean reversion play here using the Trend cloud or a moving average/vwap. We've also gotten a signal from the Pulse RSI and a divergence on the VWAP crossover. The money flow is coming up as well, but hasnt gone positive just yet.
Working keeping an eye on here, with 1 trading day left in the week, im not sure short sellers on wallstreet would want to keep positions open over the weekend. Wouldnt be surprised to see a green day into the weekend and some consolidation before next mondays open, but thats just me thinking outloud.

$BTC Bitcoin Bearish CypherWhile we do have an open trade here on Bitcoin from 34,000, ive had a few people ask me about trading it at these levels. Our next targets on the trade setup are 48 and 51500 from the smaller patterns but there is the large pattern here that i still like because of its confluence with my leading diagonal thesis.
You could argue it would safer to play the breakout rather than entering from these levels after a substantial move up, but entering here makes the trade less susceptible to stop hunts if the breakout happens in our favor.
I would look at the swing low at 40,500 as a partial decline, and use that as a strategic stop loss level. One could set up limit orders lower as well in case we do see the typical false move before the rally up. This would give you a better cost basis and your lower entrys would cut back on risk as well. In the same fashion, one could add buy stops above the breakout zone to catch it before the major move begins.

BTC/USDTesting/tracking elliot wave theory. Please do not trade off idea without S/L. Not financial advice.
If my counts are correct, this is the most likely scenario before we go up. 33-38k should be our bottom.

Bitcoin: A Short Term Pop? Bitcoin and most major markets have been trending downward for several months, and we may be seeing some signs of a reversal. Ascending triangle pattern on the 4H time frame we may see a quick pump up to my daily levels at approx $58k.
Will we be able to sustain this rally or is there still more pain left?
Only time will tell...
Namaste!

BTC 1D Trade IdeaBINANCE:BTCUSDT Chart analysis. Could be moving within this pennant looking for a siginicficant move either way soon. Will look to play swing trade on the retest of the breakout either long or short. Long could see a move back to 52k at heavy resistance and 0.5 fib level which from there I would then be bearish and short could see us coming back to 28k where we could either see a reversal or a heavy breakdown back to the low 20 thousands possibly 18k.

BTC Triple top patternOn a Daily frame, we can see a Triple top pattern. this pattern actives if the we breakout 34300 support and fails only after a daily close above 45800-46K.

bitcoin will continue "downwarding" even to 20klast couple of weeks 9nly short breakdown in downward trend.

BTC Analysis and Trade IdeaBINANCE:BTCUSDT Analysis 🤔📈
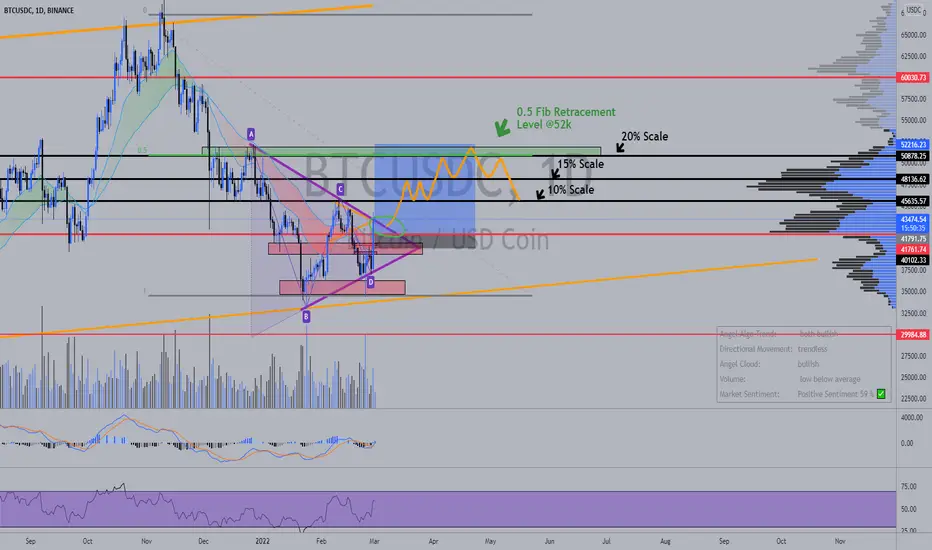
Since November we saw a 50% move on BTC back to 35k. Since then we have been bouncing around between this 45k and 35k level and I believe we have a possible pennant like pattern forming at the bottom of this down trend. A breakout to the upside and I think we can see a run back to at least 52k. There is a lot of resistance here at 52k as well as out 0.5 Fib Retracement level so a move higher is something we would have to consider in the future.
BTC Swing Trade Idea 🔥
I plan to take a Spot or 2-5x entry on BTC at around the 42k level here we have good support from out recent 10% pump yesterday. I plan to put my SL at 3-4.5% which is about the 40k mark. This would give us a RR of 8.3 and 25% gain if we hit our PT at 52k. I plan to scale out at around 10%, 15% and 20%. I will try and update an entry and more information soon!
If anyone has any questions please feel free to DM me!
btc Elliot wave analysis Btc Elliot wave analysis on 1 day chart According elliot wave we are in minuette waves

BTCUSDC As BTCUSDC price tested the support section at 38382.00 my expectation is to see uptrend to 52000.00
