A nice hit!-I confess that a rise of more than 20% was not in my plans.
-In previous analyses, some scenarios were considered based on the current situation, and one of them would be prices testing the long average region at $19.8K on the daily chart, as well as the 50% FIBO region of the high pivot mounted on the monthly chart. A priori this is what happened!
-However, the following week, prices were strange suggesting that we would have a double top on the daily chart in the region of $25.4K.
-This did not happen, and caused prices to disengage from the long average (springboard) and rise more firmly, leaving a beautiful hammer on the weekly chart, which, with its break, served as an impetus to seek the region of $27.4K, leaving only the attempt to reach the upper region of $32.3K.
-The daily chart suggests corrections to the pivot point region at $24.4K, to form a “pull back” and look for the steepest target at $32.2K, which is a region of important bottoms lost.
-You will like this graphical analysis!
-Do your analysis and good business.
-Be Aware, If You Buy, Use Stop!
-See below for other graphic reviews!
BTCUSDLONGS trade ideas

Mastering the Art of Trading Bitcoin: A Comprehensive GuideTitle: Mastering the Art of Trading Bitcoin: A Comprehensive Guide
Introduction
Welcome to the world of Bitcoin trading! In this blog post, we will delve deep into the exciting world of cryptocurrency trading, specifically focusing on Bitcoin. Whether you are a beginner or an experienced trader, this comprehensive guide will provide you with the knowledge and tools you need to succeed in trading the world's most popular digital asset.
Understanding Bitcoin and Blockchain Technology
Before diving into Bitcoin trading, it's essential to grasp the basics of Bitcoin and blockchain technology. Bitcoin is a decentralized digital currency that operates on a peer-to-peer network called the blockchain. The blockchain is a public ledger that records every transaction made using Bitcoin, ensuring transparency and preventing double-spending. Familiarize yourself with terms like mining, nodes, and wallets to better understand the Bitcoin ecosystem.
Setting Up Your Trading Account
To start trading Bitcoin, you will need to create an account on a cryptocurrency exchange. There are numerous exchanges to choose from, each with its pros and cons. Consider factors like fees, security, user interface, and available trading pairs before settling on an exchange. Once you have chosen an exchange, set up two-factor authentication (2FA) to secure your account.
Choosing Your Trading Strategy
There are several strategies employed by Bitcoin traders, and selecting the right one depends on your goals, risk tolerance, and time commitment. Some common strategies include:
Day trading: Involves making multiple trades throughout the day, aiming to profit from short-term price fluctuations.
Swing trading: Focuses on capturing larger price movements over a few days or weeks.
Position trading: A long-term approach, where traders hold their positions for months or even years, aiming to benefit from sustained price trends.
Technical Analysis (TA)
Technical analysis is a popular method used by traders to predict future price movements based on historical price data. By examining patterns, trends, and indicators, traders can make informed decisions on when to enter or exit trades. Some commonly used TA tools include:
Moving Averages: Help identify trends by smoothing out price data.
Relative Strength Index (RSI): A momentum oscillator that indicates overbought or oversold conditions.
Fibonacci Retracement: Helps identify potential support and resistance levels.
Fundamental Analysis (FA)
Fundamental analysis involves evaluating Bitcoin's intrinsic value by considering factors like market adoption, regulatory developments, and technological advancements. By understanding the factors that drive Bitcoin's value, traders can make better-informed decisions on long-term price movements.
Managing Risk
Trading Bitcoin can be risky due to its volatile nature. It's crucial to employ risk management techniques to protect your capital. Some risk management practices include:
Setting stop-loss orders: Allows you to exit a losing trade automatically when the price reaches a predetermined level.
Position sizing: Allocating only a small percentage of your trading capital to each trade.
Diversification: Spreading your investments across different assets to reduce the impact of a single asset's poor performance.
Conclusion
Trading Bitcoin can be an exhilarating and potentially lucrative venture. By understanding the fundamentals of Bitcoin and blockchain technology, choosing a suitable trading strategy, conducting technical and fundamental analyses, and employing proper risk management techniques, you can increase your chances of success in the world of Bitcoin trading. Remember, the key to successful trading is continuous learning and refining your skills as the market evolves. Happy trading!

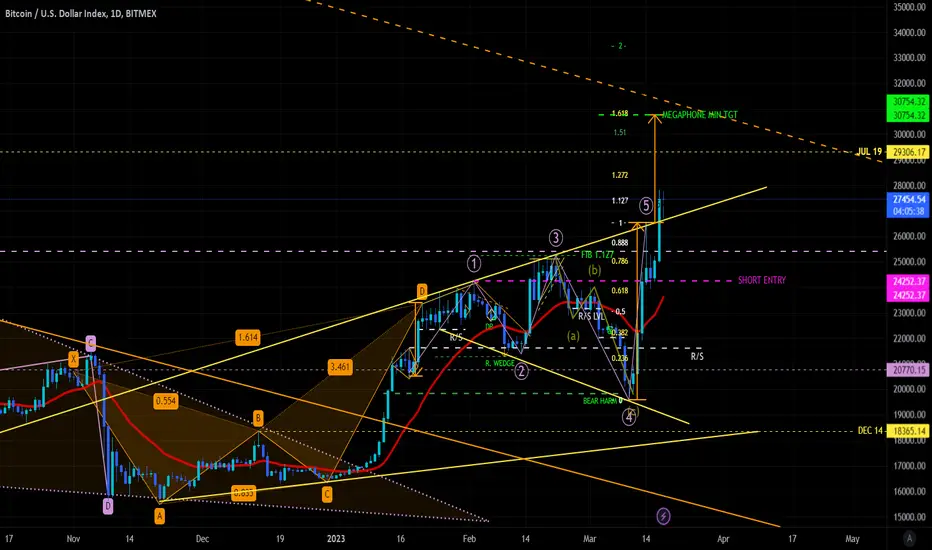
BTC MEGAPHONE ANALYSISBTC megaphone pattern appears to have already broken out & retested the upper TL. Looking for continuation to about 30.750. Alternatively, the short entry from this pattern is also included, but due to upward b/o, is very unlikely compared to upward continuation.
Bitcoin is up 65% since Bukele starts buying daily #bullishAFA mist the FTX turmoil the president of El Salvador announced the country was adding to their stash with a daily Bitcoin purchase. Since, Bitcoin, the only decentralized crypto asset, has moved 65% percent up.

Bitcoin Bullish ScenarioI would want to see three things align for a bullish scenario. The first has been fulfilled which is a bullish Ichimoku cross. The second is for Bitcoin to not only tap this liquidity above but to flip this region and form support. Finally in order to support the bullish cross I'd want to see a green cloud forming to confirm a shift in trend to a bullish environment. The macro aligns for this opportunity lets see how it plays out.

Bitcoin RebornTechnically the stongest buy signal , personaly i wil invest 15 per cent of my portofolio

BTCUSD - Gann Angles of HalvingRatio, ratio, ratios.. Halving of the price action is also a reflection that the momentum is losing speed with the square root. Vice versa it has to overcome those squared areas to 'exponentially' break free from those zones holding it back.

🅱️ Amazing! Part 2 | Bitcoin Weekly Update ($30K to $40K Next) We had a major bullish signal as a hammer on last weeks session... But there is more.
This week we have three major additional signals that support a Bitcoin rise to $30,000+ and beyond.
Let's look at those.
Feel free to 🚀👍 boost/like to get started!
Bitcoin this week is already trading above EMA50. This is a most important level and where we had a rejection mid and late February. Above this level $30,000 is easy and $40,000 possible.
The MACD is entering the bullish zone to the upside for the first time since the year 2020.
The RSI is about to hit 60 and its highest level to the upside since 2021.
These are very strong bullish signals.
Another signal that is developing and might confirm this same week is MA200 weekly.
This level sits at $25,346.
Bitcoin closing above it and our $40K target is basically guaranteed.
Good days ahead.
Cryptocurrency is bullish.
The Altcoins are bullish.
And the charts are pointing to sustained growth for many weeks.
Enough time to buy and hold and later sell to secure profits.
Namaste.

Above all key levels, will it hold?STEADY LADS -
Greetings traders,
I am excited to share my bullish outlook on the market with you all. As I see it, the correction is behind us and the bull market is back in full swing. In fact, I am more bullish now than I have been in the past seven years.
I firmly believe that we will not be dipping below 20K any time soon. We have successfully moved off of all critical support levels and have even broken through all the resistance levels that I had previously identified. This is an incredibly positive sign for the future of our beloved market.
Of course, we may encounter some bumps along the way. For instance, we might see some slowing down around the 26K mark. However, I am confident that this will be a temporary setback and that we will eventually see 28K-30K becoming our new support levels.
All in all, I believe that we are in for a bright and prosperous future in the market. So buckle up, my fellow traders, and let's enjoy the ride together. Cheers to profits and success!
I'm not saying it's up forever from here - it should correct. but I'm buying more on any dip, obviously.

I HAVE SEEN THIS PATTERN BEFOREBitcoin is forming a head and shoulders pattern on weekly time frame.
The larger the time frame, the more positive probability it is.
But, this will play out when BTC breaks the heavy resistance on it's current price at ($24.4k - ish).
But don't forget to anticipate the consolidation inside the demand and supply zone. Let's just follow and ride the trend.
But over all, $BTC is freaking bullish. Bullish bullish bullish!!

🅱️ Amazing! | Bitcoin Weekly Update ($30K to $40,000 Next)The weekly session just closed and Bitcoin ended with a very strong bullish candle.
This is a hammer with a super long lower wick.
Bitcoin Weekly Hammer = Low Set/Support Found
Bitcoin moved down on a strong shakeout move but bounced before reaching the 0.618 Fib. retracement level and closed the week above EMA10, sending a very strong bullish signals.
Patience is key my friends.
✔️ Bitcoin is ultra-bullish above $23,500.
✔️ Bitcoin is mega-bullish above $22,222.
✔️ Bitcoin is strongly bullish above $20,000.
The current price points to $30,000 as the next target and $40,000 still in the cards in this current bullish wave.
You can find our trade signal with full numbers, 10X lev. below.
🅱️ 10X Lev. BTC (XBTUSD) Long Trade Signal (730% Potential)
Thanks a lot for your amazing support.
Thanks for the trust.
Good days ahead.
Namaste.

Arise from the Ashes, but what about the underpinning?From the low of the 2018-2019 bear market to the peak of April 2021:
High: $64,200
Low: $3,120
0.236 retracement level: $13,207
0.382 retracement level: $22,138
0.5 retracement level: $33,660
0.618 retracement level: $45,182
From the low of the 2018-2019 bear market to the July 2021 crash low:
High: $64,200
Low: $28,800
0.236 retracement level: $37,332
0.382 retracement level: $46,956
0.5 retracement level: $46,500 (between 0.382 and 0.618 levels)
0.618 retracement level: $56,580
From the July 2021 crash low to the November 2021 double top:
High: $69,420
Low: $28,800
0.236 retracement level: $43,064
0.382 retracement level: $51,182
0.5 retracement level: $57,610
0.618 retracement level: $64,037
From the November 2021 double top to the November/December 2022 low:
High: $69,420
Low: $15,500
0.236 retracement level: $26,393
0.382 retracement level: $36,655
0.5 retracement level: $42,460
0.618 retracement level: $48,266

bitcoin longbitcoin stay sideway.
nasdaq hit the support
I think there is a chance of bitcoin price to go up next week
price show rejection now.
so entry at 20600
stoploss 19900
take profit at 24500

Catastrophe ahead?- In a previous analysis, prices were considered to retest the $19.8K region as well as the long average of the daily chart. A priori, this is exactly what happened!
-For the next few days we have the long average served as support for prices, where we can see attempts of rebounds up to the region of $22.1K. If prices fail to stay above this level, it will unfortunately open up grounds for us to have a test in the $18.1K region.
-If prices do not respect the $18.1K region, it is wiser to expect us to aim for the $16.8K region
-On the weekly chart we have prices losing the long average (a bad sign) as well as having a symmetry of daily and weekly targets. Will we see a catastrophe soon for BTC?
-Do your analysis and good business.
-Be Aware, If You Buy, Use Stop!
-See below for other analysis!

BIT COIN SURPRISES NEOWAVE ANALYSIS on BTC
Exp flat correction completed on Dec'22
Reaction is ABC zigzag , tgt 44000, time Jan'24
Action...... Pump

up or down ? BitcoinWhat are your thoughts on this ? up or down ??
I am waiting for this channel to break...

Potential 5 Wave ABC on Bitcoin Nice setups for short-mid term trades if this plays out. Especially for a short around the neckline

BTC Longs Bart Pattern?The BTC Longs got a massive run up when Luna crashed (BTC price at 30k) and again when Celsius crashed (BTC price 25k) and has flat lines ever since
This would mean logically that all those millions of dollars worth of longs are STILL under water. The BTC price topped out at their break even point from when they entered at the time of Celsius fall.
Is this going to be a MASSIVE Longs squeeze?
Assume it was the same person (of country government) if you average out the difference between the 2 massive run ups it would be around 23k
A 2x leverage would get liquidated at 11.5k which happens to still have a CME gap open as well as the lowest one down at 9.8k
So, I assume the price on BTC will wick down to 7.8k and close candles around 10k

Bitcoin headed much lower...Bitcoin has just completed a false breakout. One of the most bearish signals in technical analysis.
I would expect much more pain in the crypto markets going forward as a result.

price to reject 200/50 cross area and test 20 as supportwell, the price has been throwing us a lot of mixed signals lately, however i believe it was necessary that was test and reject this area, being that we are witnessing the first weekly death cross in bitcoin history. we have already been rejected from these MAs on the market cap chart, so i think it is likely we will print a firm rejection on this weekly candle and move to breakdown the wedge over the rest of this month. we are at the top of the wedge, at the top of the weekly bollinger band. ive been trying to graph this wedge for awhile now, i believe this is the final form. charting weekly charts makes everything a waiting game, time will be our friend here, upside is very limited by the MAs right now, so longing before a break over is irrational. conservative target is bottom trendline of the channel, then 50MA, then local low, then discovery.

we moved to the bottom trendline, now are we going lower?we moved down to the bottom of the wedge as i called at the top, now my question is will we go lower? indicators have barely budged despite the price decrease, time will tell.

BTC run up end of yearseems like were copying Jan 2020 run to dump in March 2020 which built into the bull run end of 2021

BITCOIN still short. 19000 USDHi,
BTC continue falling down.
We expect get target to 19 000 USD.
Good Luck !
