Bitcoin Bullish Continuation in Progress🔵 Bitcoin Weekly structure confirms higher highs & higher lows, reinforcing the bullish trend.
📈 As long as CRYPTO:BTCUSD holds above key support near $106K, the next leg could target $127K–$143K within the coming 2 months.
Key data points
Previous close
—
Open
—
Day's range
—

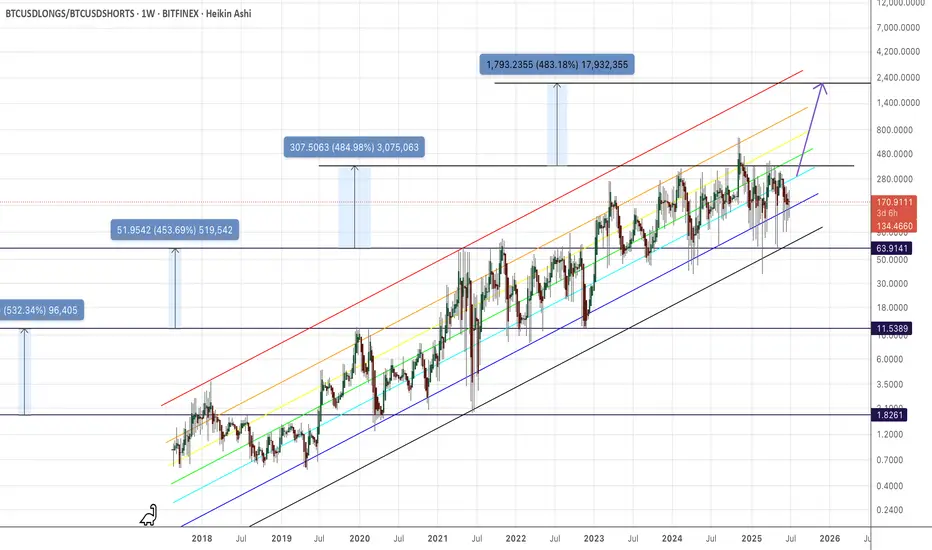
LONG/SHORT RatioHi,
Here's the long short ratio in a Fibonacci channel. Seems to me the ratio has consolidated near the highs for quite some time, and recent volatility could set up BTC for a pump into fresh high longs.
I'm calling for 95% "gap-close" attempt in the BTC.D, and simultaneously a $1M BTC as a "r
_Bitcoin Update
No need for long caption, this legend pattern tell the possible move. 😄〽️
— Whitebox support keylevel ( broke down & invalidated as support )
— If price stays below whitebox bias will be bearish
— For bullish reclaim we need to sit down again above whitebox support
— Bear possible target at PBr1

Bitcoin: Weekly Bullish Continuation🟠 The weekly divergence between the March 2024 and January 2025 peaks has driven the recent 3-month decline.
🔴 BTC is expected to make a weekly move higher, creating another divergence in the way.
🔵 BTC held above the 2024 peak range 73K without overlap, while the Stock RSI has completed a full re

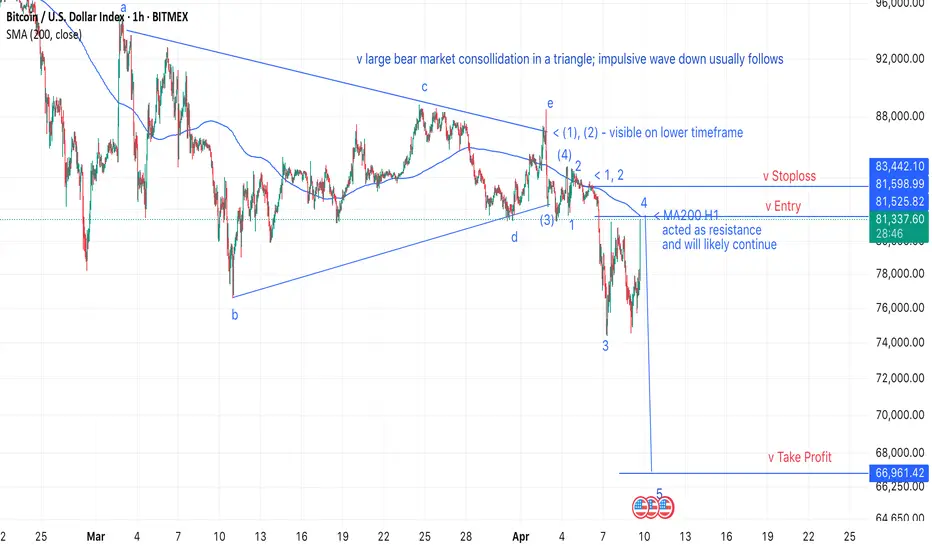
[BTC short] Entry: 81.5k, SL: 83.5k, TP: 67kThe backdrop is my prediction of a 2008-style crash, with Bitcoin (BTC) dropping to $26k (see related ideas).
During the crash, I’ll aim to capitalize on short-term moves, targeting clear patterns with high reward-to-risk ratios.
Following a prolonged consolidation—resembling a triangle—an impulsi
[BTC] Crash to $26k: Generational Buying OpportunitySince 2022, Bitcoin has surged in a major bull market, hitting the psychological $100k milestone. However, a triple divergence on the weekly RSI signals an overbought market, pointing to an imminent pullback.
The recent peak likely marked the end of Wave (3). Given that Wave (2) was an expanding fl

[BTC] $1M Bitcoin Inevitable—After a $26k CrashToday, I posted predictions that Bitcoin (BTC) will crash to $26k and the S&P 500 (SPX) will retest COVID lows (see related ideas). Yet, I firmly believe that post-crash, Bitcoin will soar to $1 million per coin—an inevitable outcome that could unfold rapidly, perhaps within one or two years.
Consi


Let's see if ICT's right...Casual markup of where BTC might be headed this year. Purely technical; not accounting for fundamentals here. Just curious to see if this will play out as marked up.

BITCOIN FORECAST RANGE BETWEEN 66K AND 50K Just testing a theory I've had for awhile now... BTC seems to move between a certain range ever sense its initial spring into a bullish market from around 5k. Using the springs initial range and finding a rough 50% area between the price points you can almost exactly forecast (Swings & Corrections).

See all ideas
Summarizing what the indicators are suggesting.
Oscillators
Neutral
SellBuy
Strong sellStrong buy
Strong sellSellNeutralBuyStrong buy
Oscillators
Neutral
SellBuy
Strong sellStrong buy
Strong sellSellNeutralBuyStrong buy
Summary
Neutral
SellBuy
Strong sellStrong buy
Strong sellSellNeutralBuyStrong buy
Summary
Neutral
SellBuy
Strong sellStrong buy
Strong sellSellNeutralBuyStrong buy
Summary
Neutral
SellBuy
Strong sellStrong buy
Strong sellSellNeutralBuyStrong buy
Moving Averages
Neutral
SellBuy
Strong sellStrong buy
Strong sellSellNeutralBuyStrong buy
Moving Averages
Neutral
SellBuy
Strong sellStrong buy
Strong sellSellNeutralBuyStrong buy
Displays a symbol's price movements over previous years to identify recurring trends.