BTCUSDSHORTS HITTING HIGHTERM LEVELBTCUSDSHORTS has reached our monthly level of 818.2817.
This may signal an overall increase number of short positions openings for the crypto space, which may signal a bearish sign.
I will keep monitoring this chart very closely in the next coming days/weeks to see if it will reverse to the upside
If you think you've gotten awesome content from my TA, please smash that like (boost) button!
It keeps me motivated to continue hitting the charts for y'all!!
I'd also love to see requests on any chart you'd like me to look at!
So please leave a comment on what Analysis you'd like me to do next! <333333
BTCUSDSHORTS trade ideas

BTC.USDTExactly according to the analysis of the second correction wave
The formation is where Bitcoin up to 20-21 thousand dollars
will be corrected

LONG BITCOIN FUTURES TRADING WITH HIGH PRECISION AND CONSISTENCYLEVERAGE BTC Futures LONG ✅
Entry Point : USD 22840
Goal : USD 24000
Stop Loss : USD 22506
Stall Brake:
Leverage is extremely risky and must be executed with money that we are willing to lose or touch the stop loss
Leave a comment that is helpful or encouraging. Together we can dominate the markets.
Trading is the only trade in which the only one responsible for our actions is oneself, our worst enemy is oneself, here there is no one to blame, this is not a collective work, the only one who presses the sell button buy and knows how much to invest and where to stop losses is you, and only you, so always remember that.
Important note: THE LEVEL OF LEVERAGE, the alert for taking early profits, the adjustment of the stop loss and the closing of a forced operation are not made by this means.
And also always remember to have control over your losses, focus on this and you will lose.
Comment: WARNING!!!!
I AM NOT A FUTURIST, I DO NOT MAKE PREDICTIONS.
I AM A 100% MARKET OPERATOR, I WORK BASED ON MY EXPERIENCE, CONSISTENCY AND MY TRADING PLANNING.

🅱️₿ How To Handle The Current Bitcoin Crash?Bitcoin is dropping... So let's define all the most important support levels in the short-term.
Prices are still trading within a higher low compared to the initial peak hit 21-Jan. This peak was hit at $23,345 and the succeeding low at $22,329. With the 1st Feb. peak at $24,252 we can define our consolidation range.
Between $24,252 and $22,329 Bitcoin can easily consolidate on a sideways basis.
The lower end of the range at $22,329 coincides with the 0.5 Fib. retracement level of the bullish move that started 18-Jan. and this gives more importance to this level.
On a broader perspective, Bitcoin continues super strong with many more support levels below. Any trading above $20,000 is EXTREMELY BULLISH. Patience is key.
The next important support levels as I mentioned yesterday are mapped on the chart; $21,877 and $21,231.
IMPORTANT
Opportunities come and go, not always situations like we have now repeat, of course, when one opportunity goes another one shows up but... When an opportunity is available and presents itself it is wise to consider it and even take action if conditions are met.
You can use all retraces and corrections as an opportunity to buy-in, rebuy and reload on Bitcoin and your favorite Altcoins.
The fact that the Altcoins vs Bitcoin (ALTSBTC) pairs are growing by 2 and even 3 digits as Bitcoin consolidates is a very strong bullish signal for Bitcoin.
I know that exactly at this point doubt can creep in.
I know that exactly right now people will come and tell you "I told you so", it is a fake move it is crashing... But that's not the point.
Bitcoin moved from $15,500 to $24,250 in a matter of weeks, corrections are normal but we are not seeing any.
Bitcoin is ultra-strong now and remains super-mega strong above $20,000, do not lose focus.
Continue bullish, continue chilling, relaxed, doing your thing, playing your game... When the time comes for a big crash, for a major crash... It will be 100% clear because the chart will be red and prices will be trading below $20k.
I am wishing you a lovely and productive week in this moment now.
There is always time.
There is always a second, third and more chances.
You can always breathe deeply and center yourself before taking a decision.
The market will reward those that stay in, those that buy and those that hold.
Feel free to message and/or leave comments with your questions.
Feel free to show in whatever way you prefer your amazing support.
Namaste.

BTC bitcoin Camarilla monthly pivotspossible next moves, support, and resistance for bitcoin. We may see a push to H3 this week. or if not... or after... correction to L3.

Yea call me CRaZy - BTC BIG DUMP - Nobody expects this!Bearish Divergence is showing weakness in the market on 4h Chart. This is even more evident on the 1h and 2h charts. Rising Wedge broke downward and now forming an additional extended bearish continuation pattern - a horizontal channel. I keep shorting these small pumps. Strong resistence and Whales got the Bulls trapped who believe we will moon. But I believe bear market is still live and well for one more big leg down.

BTC/USD CAUTIONHello fellow traders,
just wanted to share while the momentum has shifted prices higher for some time now.
The RSI however is showing that the positive price action is running out of steam. In my opinion, I suspect a pullback to 20K (roughly) to confirm as support.
Weekly charts more or less convince us the Bull cycle has started (weekly macd cross, monthly stochostic cross) This is just stating nothing parabolic will likely happen anytime soon, but if anything a healthy stage for the market to prepare for the next bull cycle.


bitcoin is still on the riseAs we stand in this bull trend, i stand bullish.
Average price long : 22 675 $ BTC
Price target to july 2023 : 33k

BTC Into the week of news..Hey Guys,
I know many of you are either trading or looking at BTC.
So I am here to Stop you getting annihilated.
Make sure you do NOT overleverage. Make sure you are trading FACTS.
Dealing with HVA's needs care. nothing crazy. No gambles. Just Core PA.
Watch for more!

BITCOIN BULLISHBitcoin has to avoid a death cross on weekly chart, if it doesn't then short bitcoin.
30k is where it is headed at the moment, It has to be quick!

Thoughts on BTCNot enough momentum to push through, Shorts preferred if break below the marked level

btcusd 1/25all signs point to the wedge having officially broken down and the price to return to the MA range (20-18k, can only include 3 indicators on free)

btcusd wedge 1 hr lookas you can see, there are many signs showing a potential bearish outcome here.

Market bull has been started. now everyone is so confidentWait for Bearish Candlesticks signal then enter the trade.
Bulls:
1. Resistance broken
2. Lower high broken
Bears:
1. LHLL
2. Trendline resistance
3. Fib Resistance 0.236
4. Last time fall after 43% gain, Now again at 43% gain
5. Time cycle of 60 days rise is completed
6. Overbought on RSI
7. RSI Divergence on 4 Hour TF

Bitcoin and EEMDuring the start of the last bull run in crypto I used EEM as a leading indicator to time my trades. This served me very well as I returned over a 20x for the year of 2020. Now I will trust it again.
$20k in MSTR calls
$225 Strike 2/3
$230 Strike 3/17
$290 Strike 4/21

im long up until 28k.Can we make it to the next fib level? I have no idea, im no nostradamus. I'm an ignoramus, outrageous just trying not to get liquidated. We are however, not adding new leverage, in fact we are using the recent volume in defi to pay down our leverage. Liquidation number currently $13,000. Remember it is a huge pain in the ass to trim your leverage when the market is panicking. Going to 28k is a good number for us but we are going to take some action if we reach 24k to convert some BTC into USDC in case there is some downside that we can trim leverage with.

Bullish Capitulation A big bull who’s been holding for months sold all his crypto
He uses E.W.T and he thinks dollar ‘has to bounce’
Profit is profit and he’s a better trader than me
But this time I think he’s wrong
He’s expecting 24kish btc then a pullback to 20 or below
I don’t see a pullback till 30s
GRI 2023
NOT TARDING ADVICE

Short BTCWait for Bearish Candlesticks signal then enter the trade.
Bulls:
1. Resistance broken
2. Lower high broken
Bears:
1. LHLL
2. Trendline resistance
3. Fib Resistance 0.236
4. Last time fall after 43% gain, Now again at 43% gain
5. Time cycle of 60 days rise is completed
6. Overbought on RSI
7. RSI Divergence on 4 Hour TF

Long Bitcoin from this levelclearly breakout seen in bitcoin for EMA61, now we can c some upside from this level next emmidiate target will be 18000. which is 500 points up from this level.if this sustain and us market gives some positive signal from their market then definately bitcoin can rise towards 21000+ level.. My long term target will be in bitcoin 27000+ till june 2023, my long term stol loss will be 15500,,,we can see bitcoin around 24500-25000.

#bitcoin fails to reach channelbearish signal if bitcoin fails again at resistance.
Bullish signal if bitcoin cross the resistance.
(white bottom dash line)
RSI still overbought currently.
i tend to be Bearish on that

BTC completing right shoulderFibb retracement levels as long as we keep on being bullish:
from below
18000
18600
19000
lowest 17500 0.786
the fundamental baias that we will correct to these levels are a mix of profit taking by big players
and fear from fomos that will create the domino effect.
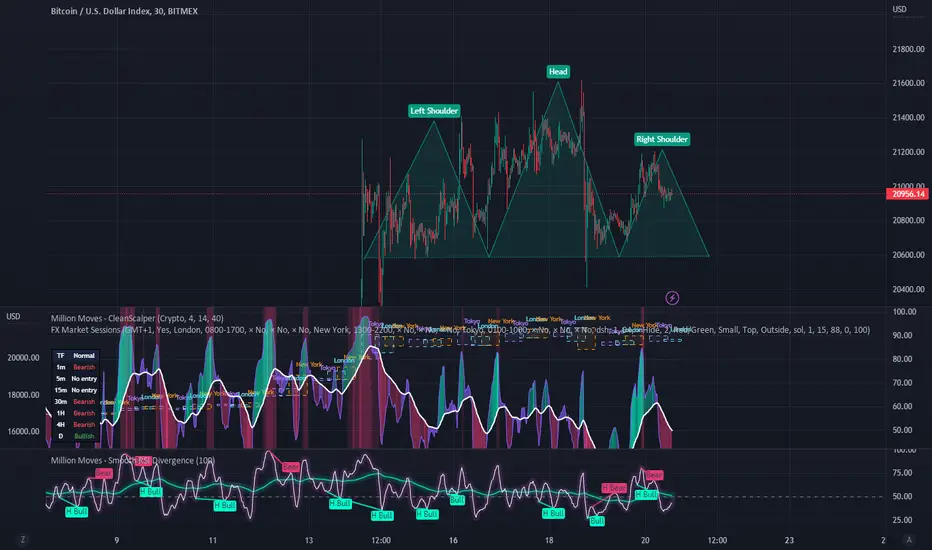
WARNING BTC HEAD AND SHOULDERS HI CAPTAIN OBVIOUS HERE
WARNING BTC IS PRINTING THE HEAD AND SHOULDERS TOP PATTERN
RSI overbought on daily and overbought on 30 min and others, has checked resistance and rejected...
it might go up still but it is currently in a trend reversal move, people are taking profits from the last long..
and we will collapse further
dont get liquidated
dont lose your money
think straight put a nice stop loss, and you might enjoy about 10 percent move down that you can profit from
i already got in at 21128
good luck everyone
