btcIn h1 time frame the price is indecision phase which makes traders more careful to take position in market. Support area is obvious.
BTCUSDT.3L trade ideas

BTCUSDT - UniverseMetta - Signal#BTCUSDT - UniverseMetta - Signal
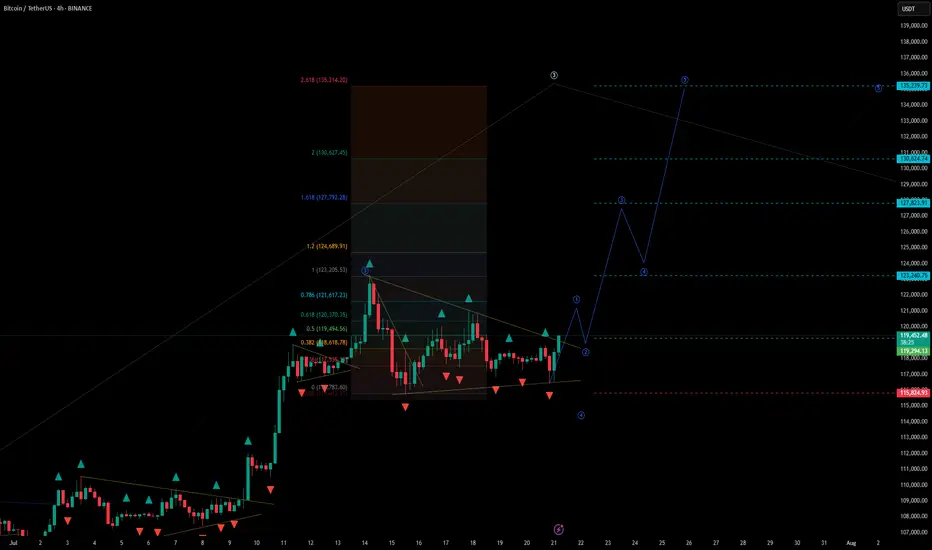
H4 - Formation of a triangular formation in continuation of the trend, for a more confident entry you can wait for a retest and formation of the 3rd wave. Stop behind the minimum of the 1st wave.
Entry: 119294.13
TP: 123240.75 - 127823.91 - 130624.74 - 135239.73
Stop: 115824.93
**BTC/USDT Monthly Analysis: Navigating Key Resistance****Overview:**
On the monthly timeframe, Bitcoin (BTC) is exhibiting significant strength as it approaches a pivotal historical resistance zone. This multi-year resistance, ranging approximately from **$115,000 to $120,000**, represents a critical inflection point for the asset.
**Key Observations:**
1. **Historical Resistance Test:** The current price action sees BTC challenging a formidable resistance level that has previously acted as a major ceiling. A decisive breakout above this zone, supported by strong volume, would signal a continuation of the bullish trend towards new all-time highs.
2. **RSI Bearish Divergence:** A notable observation on the Monthly Relative Strength Index (RSI) is the presence of **bearish divergence**. While price has made higher highs, the RSI has printed lower highs, indicating a potential weakening in bullish momentum. This divergence suggests that the current upward move might be losing steam and could precede a healthy price correction or consolidation phase. This is a crucial cautionary signal for long-term holders and potential new entrants.
**Outlook:**
The bullish macro trend for Bitcoin remains intact, yet the confluence of strong historical resistance and a developing bearish divergence on the monthly RSI warrants caution. Traders should closely monitor for a clear break and sustained close above the $120,000 level to confirm further upside. Conversely, a rejection from this resistance zone could lead to a significant retracement to key support levels.
**Disclaimer:** This analysis is for informational purposes only and does not constitute financial advice. Always conduct your own research and manage your risk appropriately.
**M. Kiani**
```ش

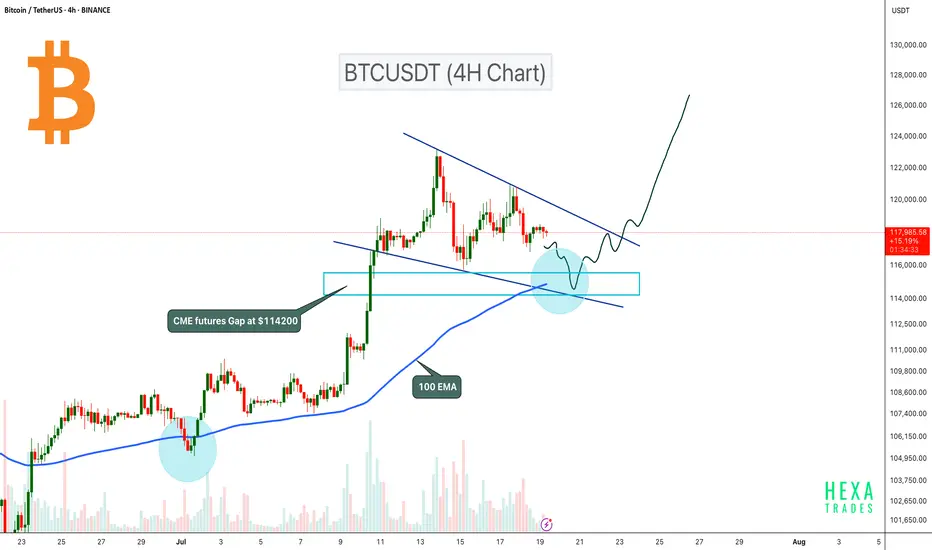
BTC Pullback Expected to $114K Before Next Leg Up!Bitcoin is currently consolidating inside a bullish flag pattern on the 4H timeframe. The price could retest the flag support, where the 100 EMA will act as dynamic support. Additionally, there is a CME futures gap at the $114,200 level, which also aligns with the 0.5 Fibonacci retracement level. Therefore, a retest to the $114,200 zone is likely before the next potential upward move.
A potential bullish reversal could occur if BTC retests this zone and confirms a bounce. A breakout from the bullish flag pattern could signal the next leg up.
Cheers
Hexa🧘♀️
BITSTAMP:BTCUSD CRYPTOCAP:BTC
BTC/USDT: Define Your Next Winning MoveHere's the reality: While others panic and second-guess, successful traders recognize the blueprint when they see it.
The Setup That Separates Winners From Losers
Two major support zones (marked in blue) tell the complete story. My footprint CDV analysis confirms what institutional money already knows - these levels aren't suggestions, they're battle lines.
Your Proven Path Forward
Zone 1: Primary accumulation target - where smart money loads up
Zone 2: Final defense line - where rebounds launch
The Choice Is Simple
Execute at these levels with precision, or watch from the sidelines as others capitalize. My track record speaks for itself - these aren't hope-based predictions, they're data-driven opportunities.
What Happens Next
Follow this blueprint: You position at support, manage risk precisely, and capture the inevitable bounce that follows institutional accumulation.
Ignore it: Watch others profit while you chase price higher later.
Bottom Line
The market has drawn the map. The footprint data confirms the plan. Your success depends on one thing: execution when opportunity knocks.
The zones are marked. The analysis is complete. The choice is yours.

Bitcoin's Critical Zone: Breakout or Breakdown?
✨ Stay ahead of the market — follow for daily crypto insights & smart analysis.
🧠 Think smart. Trade smart.
🚀 Tap the rocket if you're ready for liftoff!
🔍 Bitcoin Analysis (BTC)
📌 Scenario 1:
For BTC to break above 122 this time, it’ll need a real whale push. There are still many micro sellers at that level, and a slow, gradual move like yesterday likely won’t work.
Since buyers already spent their dry powder, they might not have enough left to defend 110 if price gets rejected again.
📌 Scenario 2:
But if price doesn’t attempt 122 again from here, we probably won’t see the 110 bottom either — simply because buyers haven’t deployed capital yet and may be waiting for entries around 115. That forms a potential range between 115 and 122.
🕰️ Daily timeframe:
Market is resting for now.
🎯 Entry trigger: 120.35
If price struggles at this level and BTC dominance isn't strong, we’ll likely shift attention to altcoins.
If BTC gets rejected at 122 and dominance turns red, again — alts may outperform.
💡 Current BTC & ETH positions remain open. No interest in shorts.
As long as we stay above 115, the focus remains on alt/BTC pairs during dips.
📊 TOTAL Market Cap:
🟡 Although we moved above 3.78 yesterday, we don’t call that a breakout — unless price moves away from the level significantly. Right now, it’s still struggling near resistance.
Next key level to watch for a true breakout: 3.91
This is the same region BTC needs a whale to push through.
📈 TOTAL2 – Entry Trigger: 1.05
If any altcoin shows strong momentum and volume before this level breaks (⚠️ low weekend volume is expected), we can consider that a signal.
On Saturdays, volume confirmation is tricky, so we may take small breakout trades using only 0.25% of capital, with fewer positions.
💠 OTHERS.D:
If BTC dominance drops, BTC ranges, and OTHERS.D rises ⬆️
➡️ It suggests that non-top-10 coins are starting to move.
That’s when we should analyze dominance of each top 10 coin individually.
🎯 Entry trigger: 7.80
💵 USDT.D:
No clean level for now, but keep an eye on 3.80 going forward.
🌐 ETH/BTC:
Still bullish, showing no signs of pullback. Price continues to push up.
✨ Stay ahead of the market — follow for daily crypto insights & smart analysis.
🧠 Think smart. Trade smart.
🚀 Tap the rocket if you're ready for liftoff!
BTCUSDT 1 Month Trading Idea... for next 2 Years...I think BTCUSDT will go back to 30,000 - 40,000 USDT price range befor it will go back to 200,000 USDT
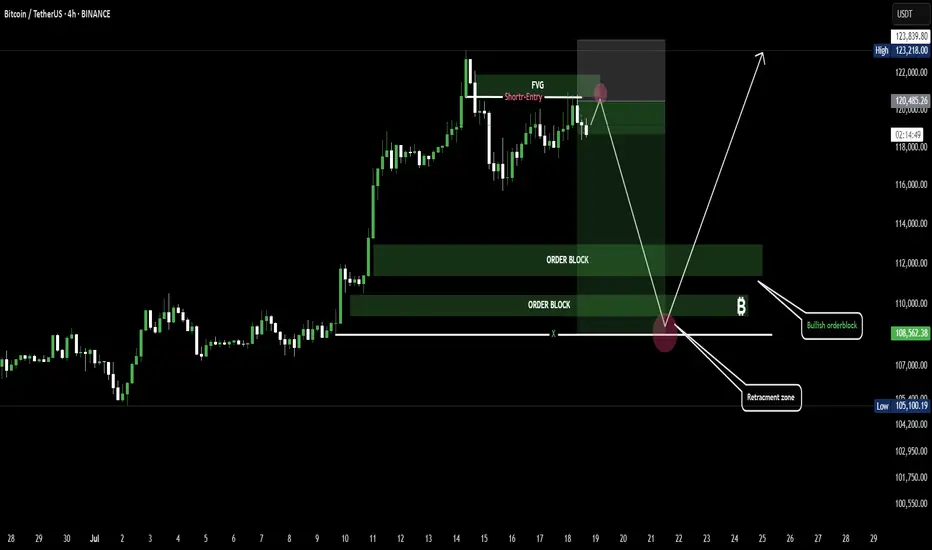
BTC Retracement Loading.....Bullish Bounce Ahead?Bitcoin is showing signs of a short-term pullback after tapping into a Fair Value Gap (FVG) zone, triggering a potential short setup. Price is likely to retrace toward the bullish order block and retracement zone around 105,000–110,000. If that area holds, we could see a strong bounce back toward the 123,000 level.
Bitcoin (BTC/USDT) Price Prediction -1D (Updated)Trend Prediction - BTC/USDT Forecasting -
End of Resistance and Support Lines Falling Wedge Pattern!!!
**** Yousef Sharafi ****
Follow me here for more analysis

BTC AI Prediction Dashboard - 6h Price Path (18.07.25)
Prediction made using Crypticorn AI Prediction Dashboard
Link in bio
BTCUSDT Forecast:
Crypticorn AI Prediction Dashboard Projects 6h Price Path (Forward-Only)
Forecast timestamp: ~11:30 UTC
Timeframe: 15m
Prediction horizon: 6 hours
Model output:
Central estimate (blue line): -118,806
Represents the AI’s best estimate of BTC’s near-term price direction.
80% confidence band (light blue): 118,801 – 119,424
The light blue zone marks the 80% confidence range — the most likely area for price to close
40% confidence band (dark blue): 118,228 – 119,973
The dark blue zone shows the narrower 40% confidence range, where price is expected to stay with higher concentration
Volume on signal bar: 171.10
This chart shows a short-term Bitcoin price forecast using AI-generated confidence zones.
Candlesticks reflect actual BTC/USDT price action in 15-minute intervals.
This helps visualize expected volatility and potential price zones in the short term.

BTCUSDT Another correction and Bounce to topBTCUSDT strong support in the 1H timeframe, with quick rejection and recovery from the lower levels. This behaviour often signals stop-hunting activity, followed by a potential bullish reversal, suggesting accumulation by smart money.
📊 Key Technical Levels:
Immediate Resistance: 118,500
A break and 1H candle close above 118,500 would be a bullish trigger. If price holds and builds above this level, we could see momentum towards: 120,000 / 122,000 / 124,000 (next potential targets)
You May find more details in the chart.
PS: Support with like and comments for more analysis Thanks for Supporting.

Check support at 115854.56-119086.64
Hello, traders.
If you "Follow", you can always get new information quickly.
Have a nice day today.
-------------------------------------
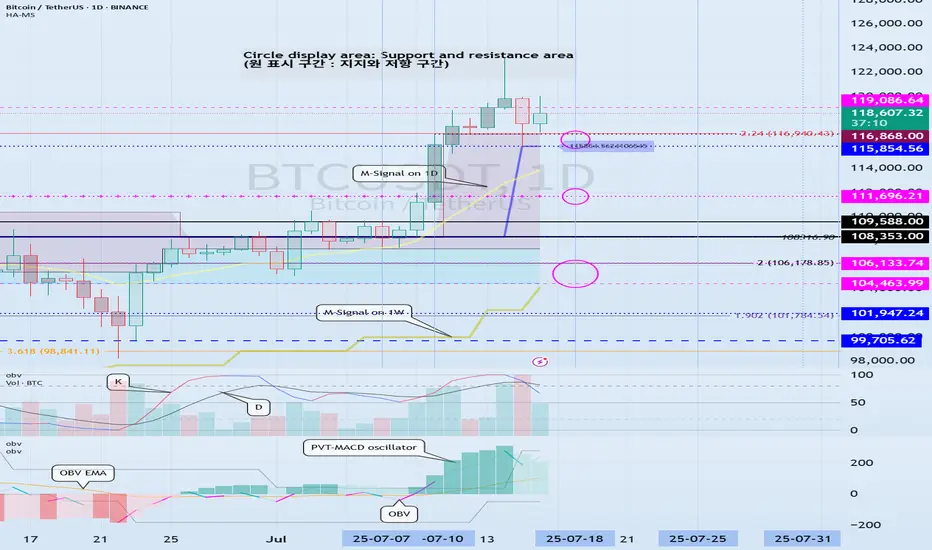
(BTCUSDT 1D chart)
On the 1W chart, the DOM(60) indicator was created at the 119086.64 point.
Accordingly, the key is whether it can be supported near 119086.64.
The meaning of the DOM(60) indicator is to show the end of the high point.
In other words, if it rises above HA-High ~ DOM(60), it means that there is a high possibility of a stepwise upward trend.
On the other hand, if it fails to rise above DOM(60), it is likely to turn into a downtrend.
The basic chart for chart analysis is the 1D chart.
Therefore, if possible, check the trend of the 1D chart first.
The DOM(60) indicator of the 1D chart is currently formed at the 111696.21 point.
And, the HA-High indicator was created at the 115854.56 point.
Therefore, since it cannot be said that the DOM(60) indicator of the 1D chart has been created yet, if the price is maintained near the HA-High indicator, it seems likely to rise until the DOM(60) indicator is created.
We need to look at whether the DOM(60) indicator will be created while moving sideways at the current price position or if the DOM(60) indicator will be created when the price rises.
If the price falls and falls below 111696.21, and the HA-High indicator is generated, the HA-High ~ DOM(60) section is formed, so whether there is support in that section is the key.
-
Since the DOM(60) indicator on the 1W chart was generated, if it fails to rise above the DOM(60) indicator, it is highly likely that the HA-High indicator will be newly generated as it eventually falls.
Therefore, you should also look at where the HA-High indicator on the 1W chart is generated when the price falls.
-
The next volatility period is around July 18 (July 17-19).
Therefore, you should look at which direction it deviates from the 115854.56-119086.64 section after this volatility period.
Since the K of the StochRSI indicator fell from the overbought section and changed to a state where K < D, it seems likely that the rise will be limited.
However, since the PVT-MACD oscillator indicator is above 0 and the OBV indicator is OBV > OBV EMA, it is expected that the support around 115845.56 will be important.
-
Thank you for reading to the end.
I hope you have a successful trade.
--------------------------------------------------
- Here is an explanation of the big picture.
(3-year bull market, 1-year bear market pattern)
I will explain the details again when the bear market starts.
------------------------------------------------------
BTCUSDT - Short Term Buy Cycle BTCUSDT
Short term buy cycle
TP at 120558
% bubble ratio
Currently in a negative bubble either fair value at 120558, the cycle is a short term and expected to be closed within maximum 6 months
Spot trading plan:
Start to buy from (-10%) bubble ratio and below

Just Two Months Left: Navigating Bitcoin and Global ChangesGreetings to everyone reading these lines! Today, I want to share with you not just an analysis, but my personal reflections and feelings about the current situation in the financial and cryptocurrency markets, especially regarding Bitcoin.
Many of you already know that I have always been a firm believer in Bitcoin’s market cycles. Right now, we are approaching the final stage of another such cycle-the distribution phase. The past few months have seen considerable turmoil: Trump's election, escalating conflicts between India and Pakistan, Israel and Iran, rising tensions between Russia and Ukraine, and not to mention China’s increasingly assertive geopolitical moves. I can't shake the feeling that the world stands on the threshold of something significant, perhaps serious. I sincerely hope I'm mistaken, but signs of a global conflict or a substantial reset in the world order are undeniably in the air.
History shows us that after major upheavals and wars, the world undergoes profound changes. It seems we are nearing such a pivotal moment within the next couple of months. For a long time, I've highlighted September 2025 as a critical point in the current market cycle, and now everything confirms this scenario.
In these unstable times, participants in the financial markets face both risks and tremendous opportunities. The distinguishing factor today is the rapid integration of artificial intelligence into all areas of life. I firmly believe that if you don't begin incorporating AI into your activities now, you risk being left behind. Personally, I'm actively integrating artificial intelligence into my professional processes and everyday life, as I see it as inevitable in our near future.
Regarding the cryptocurrency market, I'll be frank: the past couple of years have significantly changed it and even somewhat disappointed me. Liquidity has become diluted, and the market has clearly become seasonal, with brief periods of explosive growth followed by long downturns. This has led me to return to trading Forex and gold, where the market is more transparent and predictable.
Many crypto projects that seemed promising in 2017 are now nearly forgotten and stagnating. Think of Dash, EOS, Litecoin, ZCash, and others-they haven't disappeared entirely, but they no longer play significant roles in the market. The battle for user attention has become overly aggressive, and competition has devolved into chasing short-lived hype. Nevertheless, there are exceptions, such as Solana—a project that achieved success thanks to a fortunate combination of factors. Yet such projects remain exceedingly rare.
Today, I see the most promising and powerful trend as the tokenization of real-world assets (RWA). It doesn’t matter so much which blockchain will be used-the concept itself has already proven effective. While this journey won't be easy, the involvement of giants like BlackRock indicates the trend is sustainable and promising in the long run.
Overall, I am confident that financial markets and digital currencies will continue to evolve and grow. However, in about two months, I plan to adopt a bearish stance. Unfortunately, there are few signs of a quick global economic recovery. The world needs significant restructuring and changes-new rules and agreements are inevitable, and the coming year promises many notable events.
Ask yourself: Are you ready for these changes? Are you prepared to adapt to new conditions, technologies, and realities? Personally, I'm fully ready, which is why I remain active in the market, continuing to share my thoughts, assist, and engage with each of you. If you have questions, ideas, or proposals for collaboration, I am always open to dialogue and eager for any interaction.
I sincerely thank each of you for your support, comments, and attention to my posts. I stay here because I believe in the enormous opportunities available even in the most uncertain times. We have an exciting journey ahead, and I invite you to travel it together with me.
Wishing you success, profits, and above all, peace and kindness on our planet. The time of change is already here. Let’s meet it together.
Warm regards,
Your EXCAVO.


TradeCityPro | Bitcoin Daily Analysis #128👋 Welcome to TradeCity Pro!
Let’s get into the analysis of Bitcoin and key crypto indexes. As usual, I’ll be reviewing the futures triggers for the New York session.
⏳ 1-Hour timeframe
In the 1-Hour timeframe, as you can see, Bitcoin broke the 118494 top yesterday and is now moving upward.
✔️ According to the Fibonacci Extension zones, the price has moved up to the 0.5 Fibonacci level and has been rejected from there, printing a few red candles for now.
📊 The buying volume in this bullish leg was very high, and as you can see, volume was in convergence with the trend. Now that the corrective phase has started, the volume is also decreasing, and still remains in convergence with the uptrend.
🔔 From a momentum perspective, we’ve reached a market top because RSI has reached the ceiling it previously formed at the 85.90 level, reacted to it, and has now dropped back below the 70 zone.
💥 If the 85.90 zone on RSI is broken, we’ll likely see a very sharp and explosive bullish leg from Bitcoin. In that case, the next targets would be the 0.786 and 1 Fibonacci levels.
🔑 For opening a position now, we can enter on the break of 122512, and we could also use the price’s pullback to the SMA25 as an entry. For now, our triggers aren’t highly reliable, so positions should be based more on market momentum.
👑 BTC.D Analysis
Let’s move to Bitcoin Dominance. The dominance range box between the 64.44 and 64.82 is still ongoing, and dominance hasn’t broken out of this box yet.
⚡️ If the box breaks downward, a large amount of capital will flow into altcoins, and we could see major pumps in altcoins.
📅 Total2 Analysis
Moving on to Total2. Yesterday, the 1.3 top was broken and the price moved up toward 1.33 and has now reached that area.
I✨ f that resistance breaks, the next target will be 1.41. If a correction happens, 1.3 and 1.26 are the lower support zones.
📅 USDT.D Analysis
Now to Tether Dominance. A new bearish wave started yesterday and has continued down to 4.22.
🎲 If this zone breaks, the bearish leg can continue down to 4.08.
❌ Disclaimer ❌
Trading futures is highly risky and dangerous. If you're not an expert, these triggers may not be suitable for you. You should first learn risk and capital management. You can also use the educational content from this channel.
Finally, these triggers reflect my personal opinions on price action, and the market may move completely against this analysis. So, do your own research before opening any position.

Bitcoin: New All-Time High — What’s Next?Bitcoin had an incredible run, breaking the old all-time high ($111,980) with strong bullish momentum and setting a fresh ATH at $123,218 (Binance). We just witnessed the first major corrective move of ~6% and a decent bounce so far — but the big question is:
What’s next? Will Bitcoin break higher over the summer or form a trading range here?
Let’s dive into the technicals.
🧩 Higher Timeframe Structure
May–June Range:
BTC was stuck between $110K–$100K, forming an ABC corrective pattern. Using trend-based Fib extension (TBFE) from A–B–C:
✅ C wave completed at $98,922 (1.0 TBFE)
✅ Upside target hit at $122,137 (-1 TBFE)
Full Bull Market TBFE:
➡️ 1.0 → $107,301 → previously rejected
➡️ 1.272 → $123,158 → recent rejection zone
Pitchfork (log scale):
➡️ Tapped the upper resistance edge before rejecting.
Previous Bear Market Fib Extension:
➡️ 2.0 extension at $122,524 hit.
2018–2022 Cycle TBFE:
➡️ 1.618 at $122,011 tapped.
Macro Fibonacci Channel:
➡️ Connecting 2018 low ($3,782), 2021 ATH ($69K), 2022 low ($15,476) →
1.618–1.666 resistance band: $121K–$123.5K.
✅ Conclusion: Multiple fib confluences mark the $122K–$123K zone as critical resistance.
Daily Timeframe
➡️ FVG / Imbalance:
Big daily Fair Value Gap between the prior ATH and $115,222 swing low.
BTC broke the prior ATH (pATH) without retest → a pullback to this zone is likely.
Lower Timeframe / Short-Term Outlook
We likely saw a completed 5-wave impulse up → now correcting.
The -6% move was probably wave A, current bounce = wave B, next leg = wave C.
➡ Wave B short zone: $120K–$121K
➡ Wave C target (1.0 TBFE projection): ~$113,326
➡ Confluence at mid-FVG + nPOC
Trade Setups
🔴 Short Setup:
Entry: $120,300–$121,000
Stop: Above current ATH (~$123,300)
Target: $113,500
R:R ≈ 1:2.3
🟢 Long Setup:
Entry: Between Prior ATH and $113,000
Stop: Below anchored VWAP (~$110,500)
Target: Higher, depending on bounce confirmation.
🧠 Educational Insight: Why Fibs Matter at Market Extremes
When markets push into new all-time highs, most classic support/resistance levels disappear — there’s simply no historical price action to lean on. That’s where Fibonacci extensions, channels, and projections become powerful tools.
Here’s why:
➡ Fibonacci extensions (like the 1.272, 1.618, 2.0) help estimate where trend exhaustion or profit-taking zones may appear. They are based on the psychology of crowd behavior, as traders anchor expectations to proportional moves from previous swings.
➡ Trend-Based Fib Extensions (TBFE) project potential reversal or continuation zones using not just price levels, but also the symmetry of prior wave moves.
➡ Fibonacci channels align trend angles across multiple market cycles, giving macro context — like how the 2018 low, 2021 ATH, and 2022 low project the current 1.618–1.666 resistance zone.
In short:
When you don’t have left-hand price history, you lean on right-hand geometry.
That’s why the $122K–123K zone wasn’t just random — it’s a convergence of multiple fib levels, cycle projections, and technical structures across timeframes.
⚡ Final Thoughts
Bitcoin faces major resistance around $122K–$123K backed by multiple fib and structural levels. A retest of the prior ATH zone (~$112K–$113K) looks probable before the next big directional move. Watch lower timeframe structure for signs of completion in this corrective phase.
_________________________________
💬 If you found this helpful, drop a like and comment!
Want breakdowns of other charts? Leave your requests below.

#BTC Beware of the risk of a pullback📊#BTC Beware of the risk of a pullback⚠️
🧠From a structural perspective, we are continuing the trend of the long-term bullish structure in the long cycle, but there is no bullish structure as a supporting force in the short cycle, so we need to be wary of the possible risk of a pullback!
➡️At present, there is a relatively large resistance near 121,000, and the support reaction near 116,000 has been realized. The short-term support area we need to pay attention to next is 112,000-114,000
Let's take a look👀
🤜If you like my analysis, please like💖 and share💬
BITGET:BTCUSDT.P

BTC - intradayA lot of volatility, which is nice for trading either way.
The high we set on Monday morning gave a very strong rejection, but in the end we simply took out the weekend lows, then reclaimed and are now grinding higher into the imbalance we left.
Price is now coming into the first resistance, so we watch for either a reversal or see if price keeps grinding through this orderblock, in which case we expect the higher imbalance also to get taken out.
If that happens, I expect a lower high which creates bad highs, then into some ranging price action before we sweep the highs again. (a range trader can dream, rigth?)
For today, look for pullbacks into the blue zone. If the slow grind trend is strong, somewhere between the 0.618 and 0.382 is where I'd expect a reaction if we flush a bit at nyo. We have confluence with H4 trend, trendline, fibs and range poc here.
For now all the m1 lows are holding on low timeframe, I wouldn't get overly bearish or even looking for hedges before that breaks.
If price rejects here and loses the poc, look for a sweep of the lows first. There is a lot of OI build up and I expect some longs to be flushed, but that's no excuse to get bearish at the lows before they break. Just like yesterday, price reclaimed the low immediately, that was your moment to long.
Bitcoin to 128kThere is a strong support between 113k to 115k for Bitcoin, as you see that is the 61% of the Fibonacci, and it is just the start for the rally.

Bitcoin playbookSetup simple AF.
Everything is on the chart. First a small bounce into resistance 120 550 $, followed by a continuation to the downside, to the support level at 113 850 $ (to complete a classic ABC corrective structure)
HF & GL
BTCUSDTI expect a bottom to hit 110,000, then another peak. Then to around 130,000. The triple-drive will be complete and I expect a big drop.
