Bitcoin (BTC): Ready For $120K | Maybe Even $140K? Buyers are back in control; after a decent correction we had since forming a new ATH, the price has fallen 8K, which is more than enough.
We see the buyside dominance near the neckline area and now we are seeing more and more bullish volume coming in, which indicates just one thing—we are heading for a retest of the local ATH (and we even might break it).
Swallow Academy
BTCUSDT.3L trade ideas

BTC - 0.786 LTF StrugglePlease refer to our previous post:
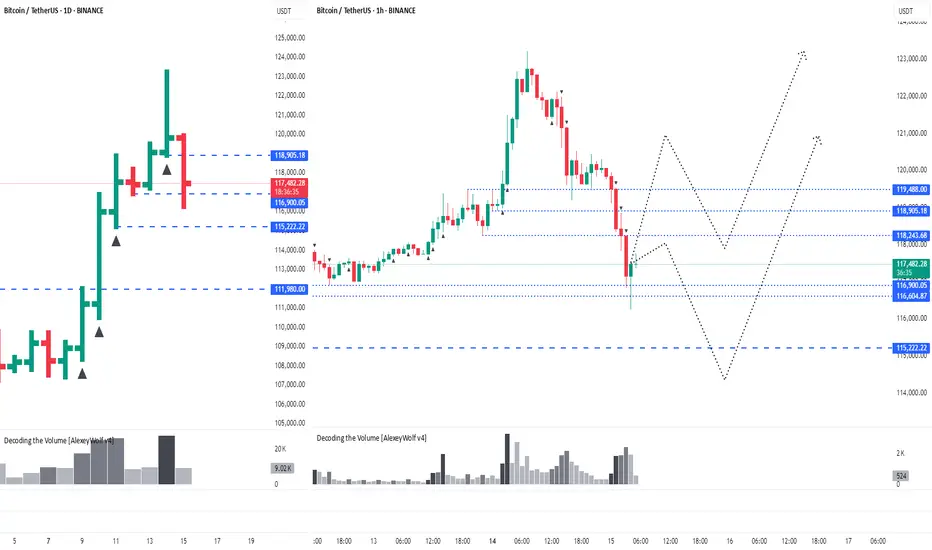
If you look at the predictive fib model we presented in our last post, we are starting to get more accurate developments. Today we just saw another rejection at our 0.786 predictive fib level with a potential reversal doji.
That is now 3 touchpoints of resistance right around $120k (which is also inline with the 1.618 extension).
Therefore if price starts to decline the predictive price targets to the downside remain in place.

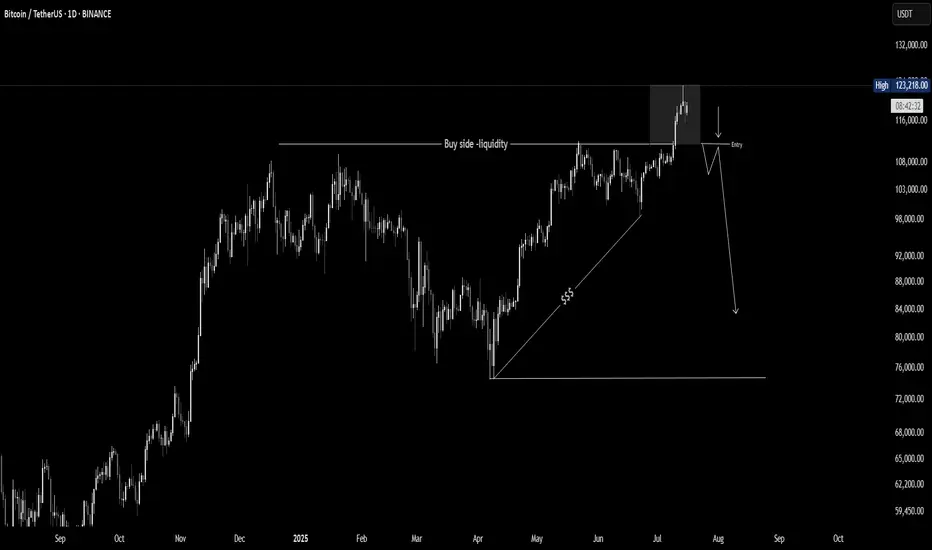
BTC Long London Low 07/16/25Next Monday between 2am-3am EST BTC will have retraced to 116-117k. This is where I will open a long, target 121500k-122k sl 115750.
BTC may sweep below this region before monday but I won't play a long until noted. The reason is based on the fact monday london sets the low range of the week and is the highest probable time to enter a swing trade. Price will most likley reach TP by Wednesday. Also The big confluence is the 1.1 B worth of longs placed at 116000.

Sell and wait because of the 100days growth rule 100 days for ETH BTC and most. Some more days for doge maybe and solana. Then i may buy back if it is a quick drop.

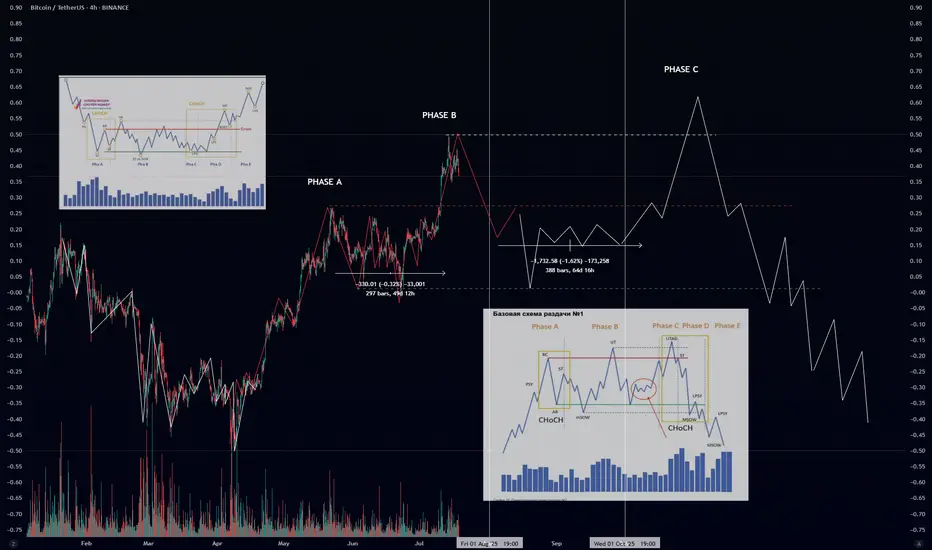
Wyckoff Distribution Schematic #1 – ExplainedIf you’ve ever wondered how smart money offloads their positions before a major downtrend — this is it. The Wyckoff Distribution Schematic #1 is the mirror opposite of accumulation. It reveals how institutions distribute (sell) to retail before the market collapses.
🔍 Phases Breakdown:
🟠 Phase A – Preliminary Supply & Buying Climax
PSY (Preliminary Supply): First signs of selling pressure.
BC (Buying Climax): Sudden surge in price with high volume – often traps late buyers.
AR (Automatic Reaction): Price drops as buyers lose momentum.
ST (Secondary Test): Retest of the top – often with lower volume.
🔄 CHoCH (Change of Character): Early warning sign that supply is increasing.
🟡 Phase B – Building the Cause
Sideways price action where large players distribute their holdings.
UT (Upthrust): Fake breakout above resistance.
mSOW (Minor Sign of Weakness): Slight breakdowns showing cracks in structure.
🔴 Phase C – The Trap
UTAD (Upthrust After Distribution): Final fakeout to trap bulls before the real drop.
Market often shows strength… right before the collapse.
Another CHoCH confirms the shift toward bearish control.
🔵 Phase D – Breakdown Begins
LPSY (Last Point of Supply): Final bounces with weak demand.
MSOW (Major Sign of Weakness): Strong breakdown on high volume — momentum shifts decisively.
⚫ Phase E – Downtrend
Distribution complete.
Price trends downward with weak rallies.
Retaiя is left holding the bag.
📊 Volume matters: look for volume spikes on upthrusts and breakdowns, and declining volume on bounces.
🔁 Compare with Accumulation:
Accumulation ends in Spring → Uptrend 📈
Distribution ends in UTAD → Downtrend 📉
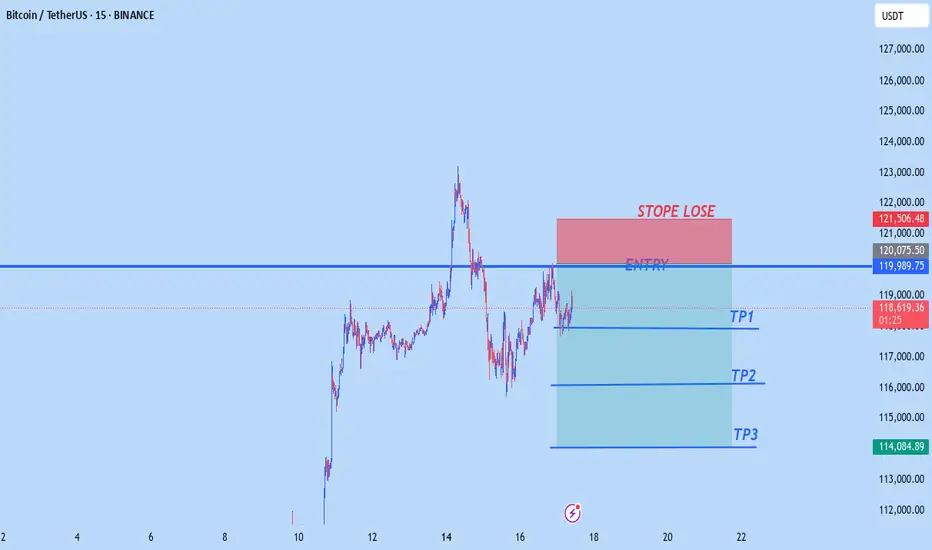
BTCUSD NEW OUTLOOK Btcusd sell from 120,000
tp1 118,000
tp2 116,000
tp3 114,000
Stopelose 121,500
Trade at your own risk
BTC - local situation (1h) SHORT🔻 Breaking down from a bearish pattern.
I expect a local decline to $114,000 - $112,000 on the 1h timeframe.
Bitcoin Prediction that will blow your mind (warning for bulls) I am showing you that BTC made new ATH only in the USD pair and not in other pairs like EUR, and why, and what you can anticipate and what to watch out for from #Bitcoin next.

Bitcoin Hits New ATH – Is It Time to Short?Bitcoin ( BINANCE:BTCUSDT ) managed to form a new All-Time High(ATH) in the previous one-hour candles .
Do you think Bitcoin can create a new ATH in the coming hours?
Bitcoin is currently trying to break the Heavy Resistance zone($110,720-$105,820) . It has also penetrated the Potential Reversal Zone(PRZ) and Cumulative Short Liquidation Leverage($114,910-$113,850) .
In terms of Elliott wave theory , it seems that the 5 impulsive waves that Bitcoin started in the last 3 days can be completed above the ascending channel and PRZ .
Also, we can see the Regular Divergence(RD-) between Consecutive Peaks.
I expect Bitcoin to drop to at least Cumulative Long Liquidation Leverage($111,563-$110,947) . At least the price zone Bitcoin is in at the time of publishing this analysis is better for short positions , even if the Stop Loss(SL) is touched .
Note: Stop Loss(SL)= $115,023
Please respect each other's ideas and express them politely if you agree or disagree.
Bitcoin Analyze (BTCUSDT), 1-hour time frame.
Be sure to follow the updated ideas.
Do not forget to put a Stop loss for your positions (For every position you want to open).
Please follow your strategy and updates; this is just my Idea, and I will gladly see your ideas in this post.
Please do not forget the ✅' like '✅ button 🙏😊 & Share it with your friends; thanks, and Trade safe.

Bitcoin Crash? No! The Bullish Wave Starts Now! $155,601 Next!Some people are still expecting for "Bitcoin to go down." Poor bastards, the advance is just starting. Bitcoin just broke out of a 210 days long consolidation phase. After this huge, long-term consolidation, expect a major advance. Next target is now set at $155,601.
This week is the first week green after the consolidation finally ends. The market was sideways for seven months, with some fluctuations, and the result is a bullish breakout. Why a breakdown? Why expect a drop? If the market just broke up—think about it—why would it go down?
If resistance is confirmed; you remember the range between $100,000 and $110,000. If resistance is confirmed then Bitcoin would start crashing down from $110,000. If the break of $110,000 does happen and Bitcoin moves to $112,000 as a bull-trap, then you would expect a major crash happening from $112,000 and no more. But, reality is saying, showing, something much different. We have a major advance. Resistance has been flipped into support.
Now, the first that is needed is the weekly close. It is still very early into this move but Bitcoin is showing maximum strength. Remember the altcoins? These confirm that the advance is just new, early, because these are recovering from all-time lows or major lows. There is still plenty of room for growth.
My people, wake up! Bitcoin is going up.
The next target is $155,601 and it can go higher, this is only the mid-term target based on the long-term. When Bitcoin consolidates for 7 months, it tends to grow some 137% on average, it can be less but it can also be much more. And it tends to grow at least for 1-2 months, but this also is just the average, Bitcoin can grow straight up for 4 months.
So, are you still bearish?
Oh please no! The bulls already won.
The 2025 bull market final phase starts now, soon you will experience a marketwide bull-run. We have not seen the euphoria phase, this is only the start. Prepare for additional growth.
I am calling out all of the bears, never bet down on Bitcoin; Bitcoin is going up.
Namaste.

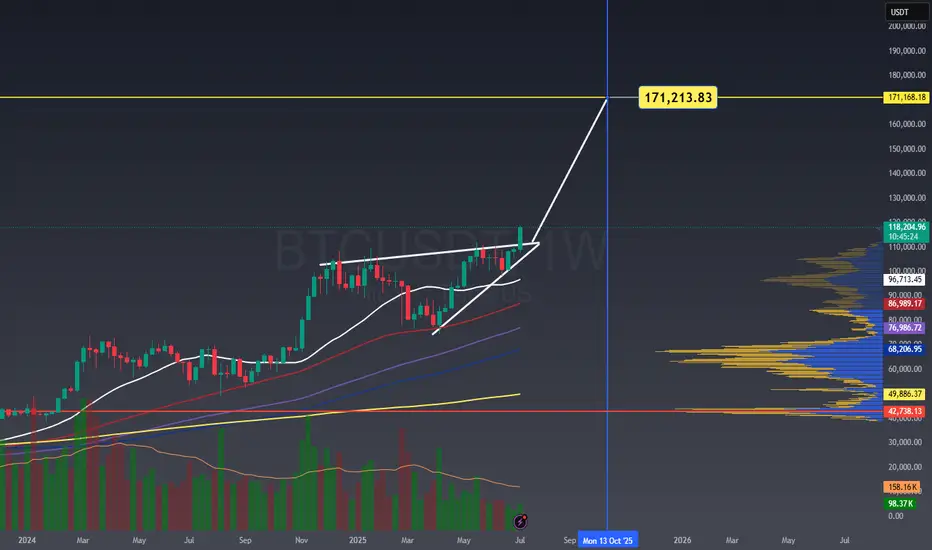
BTC TO 172K BY Oct 13, 2025BTC TO 172K BY Oct 13, 2025
rising wedge inverted head and shoulder measured move to the upside 172k
Global liquidity downtrend cometh!During this current BTC cycle, major uptrends in global liquidity have corresponded to major uptrends in the market 72ish days later. The last major uptrend in liquidity is about to run its course, pause, and then downtrend. If this relationship holds, we are at or near at least a pause in the local up trend. I have my popcorn ready to see if this plays out.
Note: The global liquidity prediction pauses until December 11th and then downtrends, so if we see floating higher prices until that point and then a pause, the relationship would still be valid.
Second Note: I will publish the BGL (Bitcoin Global Liquidity) indicator very shortly. Please test it out and DM me if you see any issues or have suggestions.
--Da_Prof

BTC/USDT – 4H Chart Technical AnalysisBTC/USDT – 4H Chart Technical Analysis
Market Structure & Trend
Overall Trend : Bearish (clearly defined by a consistent downtrend channel).
Current Structure : Price is in a corrective downtrend within a descending channel, after multiple rejections from the supply zone.
Key Technical Zones
1. Supply Zone
Strong rejection zone where the price previously reversed sharply.
Still acting as resistance, located around the upper range.
2. Demand Zone
Currently being retested for the fifth time, weakening its strength.
Recent price action shows liquidity sweep and swing low break inside this zone, potentially trapping early longs.
Fair Value Gaps (FVG) & Fibonacci Levels
1D FVG sits below the current demand, aligning with:
Golden Pocket (0.618–0.65 Fib).
Acts as a high-probability bounce zone for long entries if demand fails.
A break below this FVG could open up deeper downside toward the 0.786 Fib or beyond.
Psychological Levels
105,000 – Major resistance & potential take-profit area for long positions.
100,000 – Key support and liquidity magnet if the demand zone fails.
Volume Profile
High Volume Node: 102,000 – 106,800 — price tends to gravitate here, indicating potential consolidation or resistance.
Low Volume Area: Below 100,500 — suggests thin liquidity, which may cause sharp moves if price drops into this range.
Scenarios & Trade Ideas
Bullish Scenario
If price holds above the demand zone (after multiple retests) and confirms on LTF:
Potential Long to local resistance.
On breakout, target the 105,000 psychological level.
Confluence: High volume area offers both support and a magnet.
Bearish Scenario
If price fails to hold the demand zone:
Enter short position targeting the 1D FVG and 100,000 psychological level.
If that breaks, expect sharp continuation due to low volume below.
Conclusion
Price is at a pivotal point — currently balancing on weakened demand after multiple retests. Watch for LTF confirmation:
Above demand = bullish recovery setup.
Below demand = bearish continuation toward 100,000 and the FVG.
Manage risk tightly due to the proximity of both key zones.

BTC 141000Hello friends
I think Bitcoin has another correction to 113662 and then it will climb to 141000.

Golden Bitcoin Signal: A Great Investment Opportunity🔔 Our Bitcoin Investment Bot has issued an exclusive signal! This signal, backed by 15 years of historical data analysis, marks the perfect time to enter the market. 🎯 Take Profit Target: $120,975 (equivalent to a potential 50.5% profit)
⚖️ Professional Risk Management: This signal comes with a Stop Loss at $66,835 (16.8% risk), offering an ideal balance of profit and risk. Our bot, with its advanced and data-driven strategies, identifies the most valuable investment opportunities.
⏳ Opportunities don’t last forever! This signal could be the start of a significant move. Now is the best time to act and take advantage of this precise analysis. With our bot, you’re one step closer to sustainable profitability. 🌟

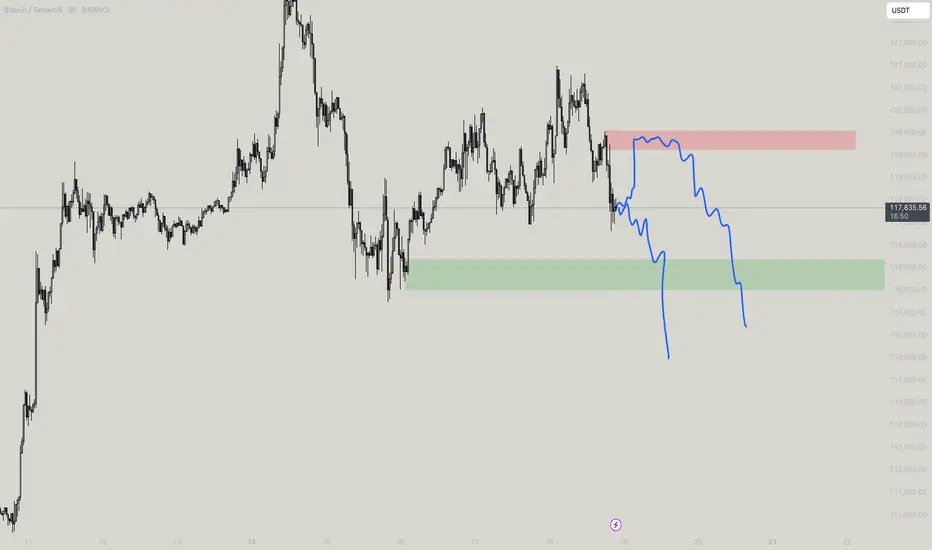
BTCUSDT: A Period of Adjustment and the Next TrendAfter a strong rally to record highs, BTCUSDT is currently entering a period of slight correction. The coin is now trading around 118,500 USD, down more than 0.57% on the day.
From a technical perspective, BTCUSD is moving within a narrowing price wedge, showing a slight downtrend. The support level at 116,500 USD is acting as a springboard for the Bulls. However, as the price approaches the tip of the wedge, a breakout may occur at any time, with two possible scenarios highlighted on the chart.
My personal outlook is that BTCUSDT will continue to decline in the short term before breaking out of the wedge in an upward direction. What do you think about BTCUSDT?
Please share your thoughts in the comments and don’t forget to like this post!
Wishing you all happy and successful trading!

BTC/USDT (1H) Market Analysis – July 19
BTC is hovering just below the 200 EMA, having recently bounced off it with a small recovery candle.
The recent downtrend from the $121K peak has flattened, and price is forming a potential short-term base above the $117K support.
There's low-volume chop, suggesting indecision or a pause before the next leg.
Key Technical Levels
Support zone: $117,200 – $117,500 (200 EMA + recent wick support)
Resistance zone: $118,500 – $119,000 (cluster of short EMAs + prior supply)
Breakout level: $119,500 (for a bullish continuation)
Breakdown level: $116,800 (for further downside)
Indicator Insights
RSI: 42.86 and curling up slightly → shows a potential recovery attempt but still below neutral.
QQE MOD: Deep in bearish territory (–8.53), but we’re seeing the first signs of easing negative momentum.
ATR: 681 and gradually falling → declining volatility, aligning with consolidation.
Bias & Scenarios
Bullish Case:
If BTC holds above the 200 EMA and breaks above $118.5K with volume, we could see a retest of the $119.5K–$120K zone.
RSI breaking 50 and QQE printing lighter red would confirm upward momentum.
Bearish Case:
Failure to reclaim EMAs and a drop below $117K could send price toward $116K or even back to the breakout base at $114.5K.
Watch for volume spikes on red candles and RSI breaking back under 40.

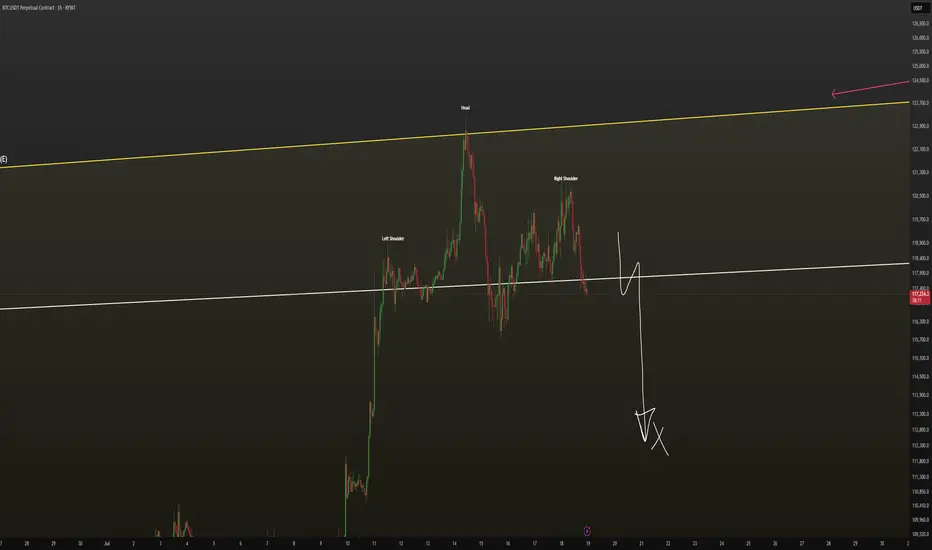
Bitcoin at a Crossroadshello guys!
In the current 1D chart of BTCUSDT, a Head & Shoulders pattern has formed, suggesting potential for significant price movement in the near term. The structure includes a defined left shoulder, head, and right shoulder, with a descending trendline acting as a critical resistance level.
🔹 Bearish Scenario:
If the price respects the descending trendline and fails to break above the neckline (around $109,480) , a bearish reversal is likely. In that case, the target based on the pattern lies near the $93,500–94,000 support zone. This level aligns with a previous consolidation area, making it a strong candidate for a reaction or bounce.
🔹 Bullish Scenario:
On the flip side, if the price breaks above the neckline and the descending trendline, invalidating the pattern, a strong bullish continuation could unfold. The potential breakout target would be around $127,000–130,000, in line with the projection from the head of the pattern.

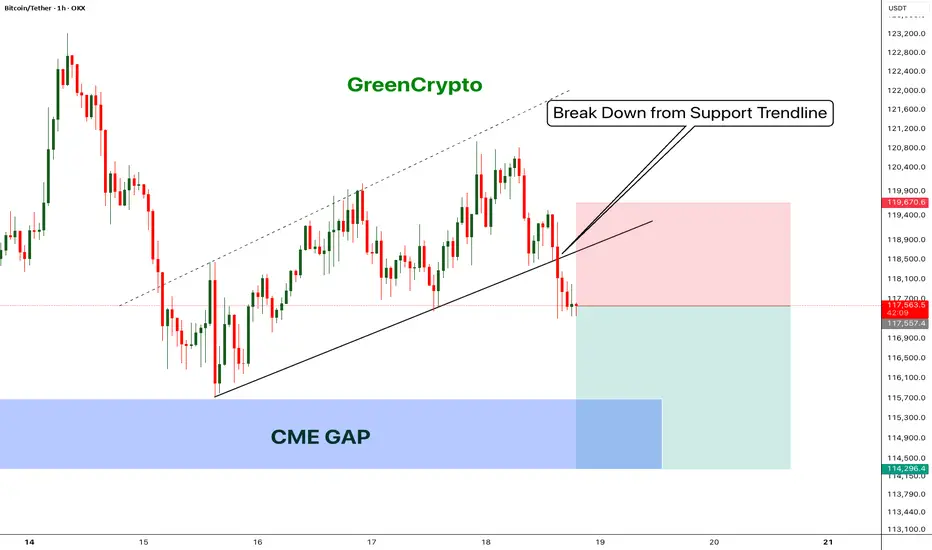
Bitcoin - Bears will push the price fill CME Gap- Bitcoin has broken down from the trending support,
- Price has been going down without any retracement on 1H candle.
- Looks like bitcoin will CME gap before going up further.
- A high risk Short Trade opportunity is here
Entry: 117,431
Stop Loss: 119,670
TP1: 116152.8
TP2: 114403.6
Move SL to Breakeven on TP1 hit
Don't forget to like and follow
Cheers
GreenCrypto
BTC - 115 - 113k when?Looks likely today or tomorrow, Just in case if it traps you know how it can and if not you know the fall!
BTC Just Broke the High - But Don't get Trapped!Bitcoin just swept the recent high, triggering breakout euphoria. But this could be a classic liquidity grab, not a true breakout. If price fails to hold above the level and shifts structure, we may see a sharp bearish reversal BINANCE:BTCUSDT BINANCE:ETHUSDT 👀
BTCUSDT. Current scenario range Current scenario range — can shift depending on how the market reacts next.
This analysis is based on the Initiative Analysis concept (IA).
Wishing you profitable trades!
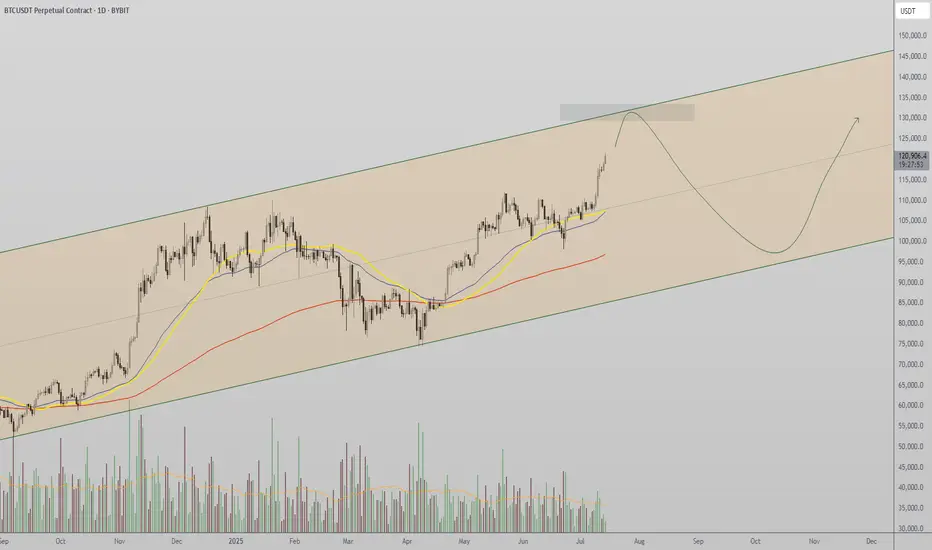
$130K Channel Resistance — Bullish Structure Intact Bitcoin continues its strong uptrend, pushing toward high time frame resistance at $130K. With no bearish structure in sight, short-term momentum favors continuation unless resistance prompts a reversal.
Bitcoin is showing continued strength in the immediate short term, with price steadily advancing toward the $130,000 high time frame channel resistance. This level marks the upper boundary of a macro trend channel and presents the next critical test for BTC. While this zone may act as a barrier, the market remains structurally bullish, and further upside remains possible before any meaningful correction takes place.
Key Technical Points:
- Channel Resistance at $130K: Major high time frame level to watch
- Bullish Market Structure: Consecutive higher highs and higher lows on lower time frames
- No Bearish Reversal Signs Yet: No structural break or shift to indicate correction
Bitcoin’s price action has been defined by clear bullish structure, especially on the lower time frames, where the market continues to print higher highs and higher lows. This confirms that bulls are still in control and dips are being bought aggressively, maintaining the strength of the trend.
The next major technical level is the $130K resistance, which aligns with the upper boundary of a long-term ascending channel. This area is likely to serve as a key decision zone. If price approaches this region without any signs of exhaustion or bearish divergence, the probability of a brief breakout or retest increases.
However, it is also important to consider this level as a potential inflection point. If price begins to stall at or near $130K — especially with declining volume or a shift in short-term structure — it could signal the beginning of a corrective move. Until such a development occurs, however, the market remains decisively bullish.
Traders should closely monitor intraday structure around the $130K zone. A clean break above on strong volume would indicate continued strength and could open the path toward further price discovery. Conversely, the first sign of weakness would be a break of short-term support levels and failure to form new highs — neither of which has occurred yet.
Bitcoin remains bullish in the short term as it approaches $130K resistance. Unless a structural break occurs or bearish signals appear, further upside remains likely before any correction sets in.