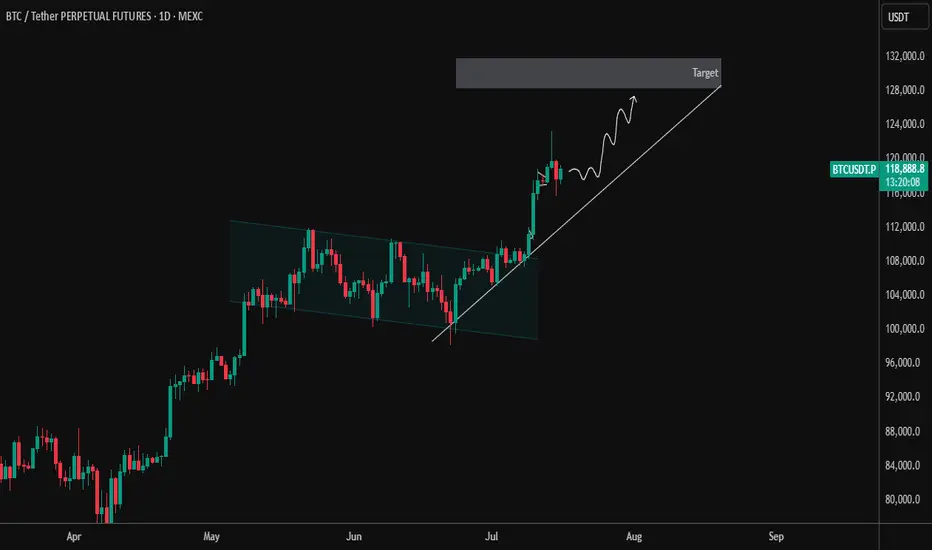
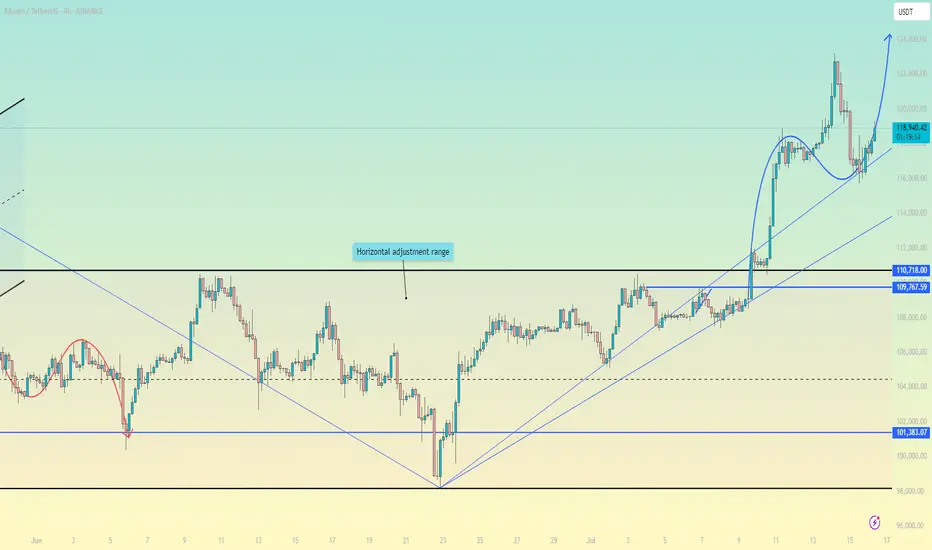
BTCUSDT 1 Day – Breakout and Retest Completed | Next TargetBTC has officially broken out of the descending parallel channel that dominated price action from mid-May to early July. After a successful breakout, price pulled back for a clean retest of the channel resistance, which has now flipped to support — a classic bullish continuation signal.
🔹 Key Technical Highlights:
✅ Breakout from descending channel structure
✅ Retest of breakout zone confirmed with strong bullish candles
🔼 Current Price: ~$118,971 (as of chart time)
📈 Short-Term Structure: Following a clean higher-low formation with ascending trendline support
🎯 Target Zone: $128,000–$130,000 (next key resistance area)
As long as BTC maintains this ascending support line, the momentum remains with the bulls. Any dips toward the trendline may offer good long opportunities with proper risk management.
📌 Watch for:
Rejection near the target zone
Bullish continuation patterns like flag/pennant on lower timeframes
Volume confirmation during breakout attempts
Let the trend be your friend. Trade safe! ⚡
BTCUSDT.3L trade ideas
HolderStat┆BTCUSD above $120BINANCE:BTCUSDT has surged past $129,000 following a breakout from long-term consolidation. The chart shows a clean continuation structure with the next resistance between $135,000–$137,000. Momentum remains on the side of bulls.

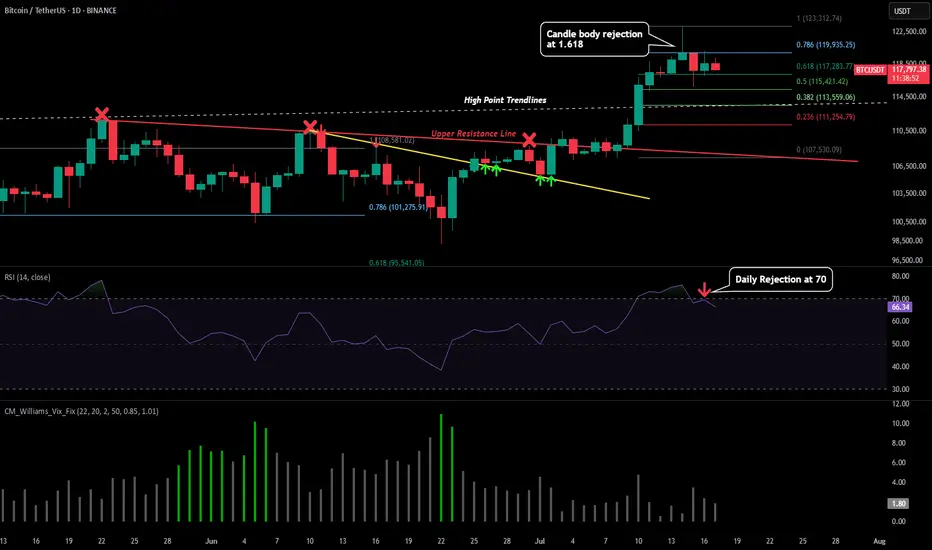
BTC - Signals of Cooloff IncomingPlease refer to our previous post:
To give additional detailed context of what to look for please look at our last post that is linked above. So far with recent price developments this idea is still intact.
What I have also outlined in todays post are some of the reason this short term retracement is still in place.
-Market has moved up very fast
-Lots of leverage from the highs need to be flushed
-Daily candle close below our first 1.618 extension target
-Daily RSI just got rejected from the 70
If we do see a retracement then all those price levels mentioned in our last post are valid. I have also add a predictive fib model that could outline important future price levels on the LTF.
Given this model does not have much price data to go off of the accuracy cannot be for certain but pay attention the the 0.382 around $113.6k and the predicted bottom around $107.5k if price drops that low.
The way price could avoid a LTF retracement is by the daily RSI reclaiming strength above the 70 level and negating the rejection. Will make an updated post if this is to occur.
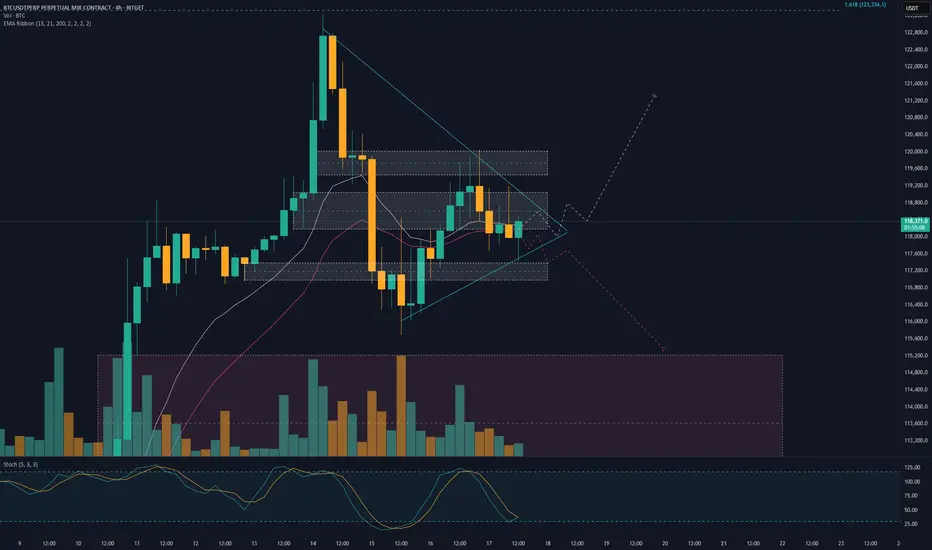
BTC AI Prediction Dashboard - 6h Price Path (17.07.25)
Prediction made using Crypticorn AI Prediction Dashboard
Link in bio
BTCUSDT Forecast:
Crypticorn AI Prediction Dashboard Projects 6h Price Path (Forward-Only)
Forecast timestamp: ~10:30 UTC
Timeframe: 15m
Prediction horizon: 6 hours
Model output:
Central estimate (blue line): -119,394
Represents the AI’s best estimate of BTC’s near-term price direction.
80% confidence band (light blue): 118,475 – 119,566
The light blue zone marks the 80% confidence range — the most likely area for price to close
40% confidence band (dark blue): 117,621 – 120,336
The dark blue zone shows the narrower 40% confidence range, where price is expected to stay with higher concentration
Volume on signal bar: 121.96
This chart shows a short-term Bitcoin price forecast using AI-generated confidence zones.
Candlesticks reflect actual BTC/USDT price action in 15-minute intervals.
This helps visualize expected volatility and potential price zones in the short term.

Support and resistance zones: 115854.56-116868.0
Hello, traders.
Please "Follow" to get the latest information quickly.
Have a nice day today.
-------------------------------------
(BTCUSDT 1D chart)
This decline created a new trend line.
This added a period of volatility around July 31st.
If the HA-High indicator is generated at the 115854.56 point, the key is whether it can be supported and rise around that point.
If it falls below the HA-High indicator, there is a possibility of a downward trend.
Therefore, it is necessary to look at which support and resistance points the price is maintained at as it passes the volatility period around July 18 (July 17-19).
-
Since the StochRSI 80 indicator is formed at the 116868.0 point, it is important to be able to maintain the price above 116868.0 if possible.
Therefore, assuming that the HA-High indicator will be generated at the 115854.56 point, the key is whether there is support around 115854.56-116868.0.
Next, since the M-Signal indicator on the 1D chart is rising above 116696.20, we need to check if it is supported by the M-Signal indicator on the 1D chart or around 116696.21.
-
So far, we have talked about how to maintain an upward trend by breaking through a certain point or section.
That is,
- The K of the StochRSI indicator should be below the overbought section and should show an upward trend with K > D.
- The PVT-MACD oscillator indicator should show an upward trend. (If possible, it should be above the 0 point.)
- The OBV indicator of the Low Line ~ High Line channel should show an upward trend. (If possible, it should be maintained by rising above the High Line.)
I said that when the above conditions are met, there is a high possibility that the upward trend will continue.
On the other hand, in order to change to a downward trend,
- The DOM (60) indicator should be created and show resistance near the DOM (60) indicator.
- When the HA-High indicator is generated, it should show resistance near the HA-High indicator.
- When the K of the StochRSI indicator falls from the overbought zone, it should switch to a state where K < D and show a downward trend. (However, caution is required as volatility may occur when K reaches around the 50 point.)
- The PVT-MACD oscillator indicator should show a downward trend. (If possible, it is better if it is located below the 0 point.)
- The OBV indicator of the Low Line ~ High Line channel should show a downward trend. (However, it should show a downward trend in the state where OBV < OBV EMA is present.)
When the above conditions are satisfied, there is a high possibility of a downward trend.
Among these, the most intuitive thing to know is whether the DOM (60) indicator and the HA-High indicator are generated.
This is because, in order to first switch to a downward trend, a signal that the current price position is a high point must appear.
The DOM(60) indicator is an indicator that indicates the end of the high point.
Therefore, if the DOM(60) indicator is generated, it is likely to be a high point.
However, since it can be supported and rise near the HA-High indicator, you should check whether there is support in the HA-High ~ DOM(60) section and respond accordingly.
The HA-High indicator is an indicator created for trading on the Heikin-Ashi chart, and if it falls below the HA-High indicator, it is likely to be a point where a downtrend will begin.
-
Since the same principle applies to any time frame chart you trade, it is easier to understand the chart and determine the timing of the start and end of the transaction.
However, the basic trading method must be a split trading method.
The reason is that if it rises in the HA-High ~ DOM(60) section, it is likely to show a stepwise upward trend, and if it falls in the DOM(-60) ~ HA-Low section, it is likely to show a stepwise downward trend.
This basic trading method, that is, buying near the HA-Low indicator and selling near the HA-High indicator, will eventually make you familiar with day trading, which will have an effective influence on finding a buying point when making mid- to long-term investments.
It is wrong to say that you are good at mid- to long-term investments when you are not good at day trading.
You were just lucky.
Unfortunately, this kind of luck cannot last.
-
Thank you for reading to the end.
I hope you have a successful transaction.
--------------------------------------------------
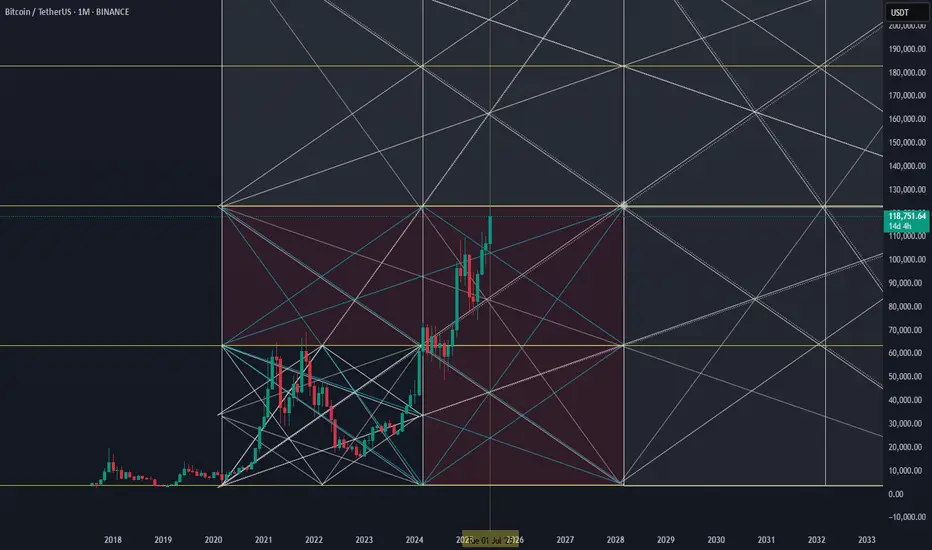
- This is an explanation of the big picture.
(3-year bull market, 1-year bear market pattern)
I will explain more details when the bear market starts.
------------------------------------------------------

Potential path for BTC (no free lunch)
The market gets horny as PA moves into the weekly open again.
BTC pulls an F-you move and dumps into the Daily fair value gap
THEN continuation actually happens

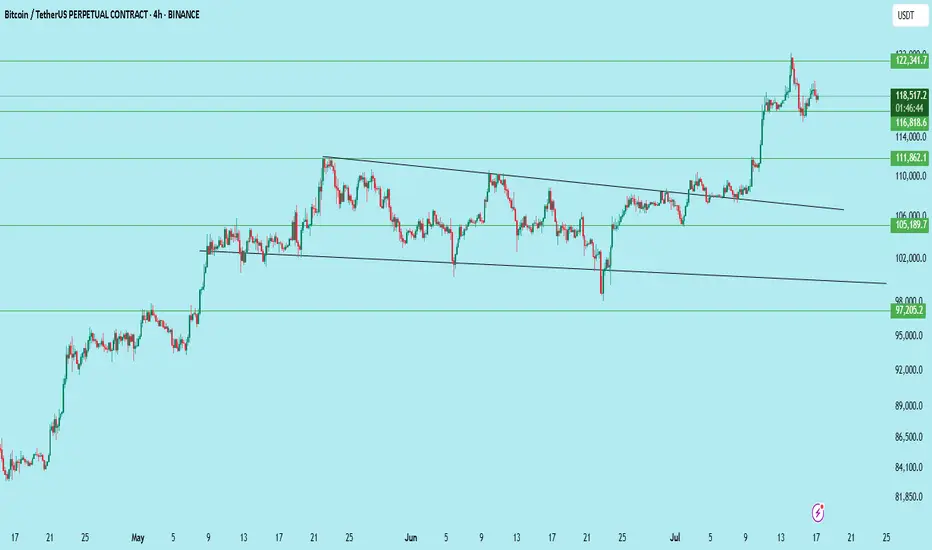
#BTCUSDT | Massive Breakout – Now What?Bitcoin has broken out of a multi-week descending wedge on the 4H chart — a classic bullish reversal pattern. Price is now consolidating just above $116,818 support, forming a base for the next leg up.
What Just Happened:
Clean breakout above the wedge resistance
Strong momentum candle above $111,862
Immediate rejection near $122,341
Currently retesting the previous breakout zone
Key Levels:
Resistance: $122,341
Support: $116,818 → key short-term level
Breakout Support: $111,862
Deeper Support: $105,189
Invalidation Level: $97,205
Bullish Outlook:
If BTC holds $116,818 and breaks above $122,341 with volume, the next leg could extend toward $128,000–$132,000.
Bearish Risk:
Losing $116,818 with volume → look for retest near $111,862 or even $105,189 for a stronger bounce.
Bias:
Bullish above $116,818 — watching for consolidation before continuation.
Trade Setup (if planning to enter):
Entry on retest of $116,818–$117,000
SL: Below $114,000
TP1: $122,341
TP2: $128,000
TP3: $132,000
DYOR | Not Financial Advice
Bitcoin short from 121kLooking for shorts at these leveks.
Target aroind cme gap.
Also npoc level is down at that region.
Patiently waiting.

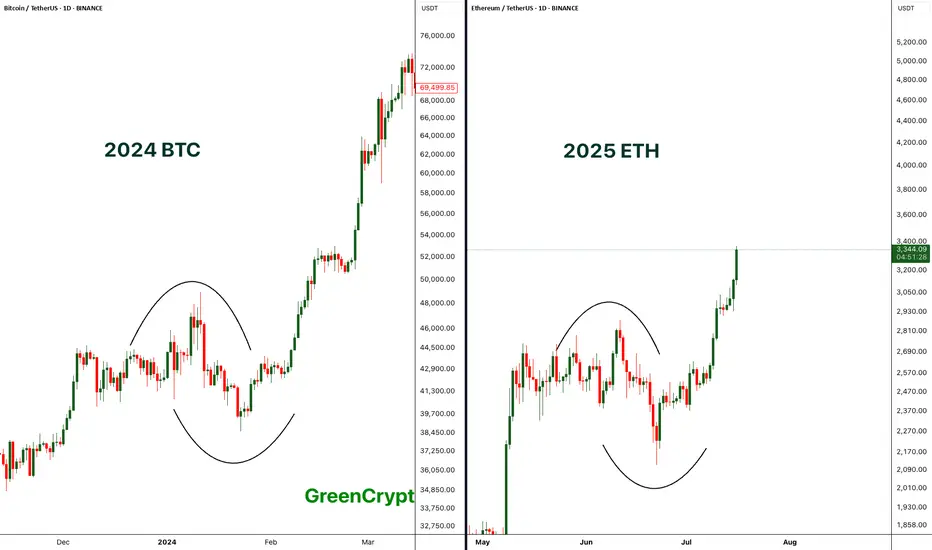
Comparing BTC 2024 with ETH 2025 - Perfect Match- If compare the chart pattern of BTC from 2024 with the current 2025 ETH pattern, wee see exactly similar chart patterns being formed here.
- Price started consolidating then it had fake breakout towards both the sides and finally the real breakout.
- BTC breakout push the price towards the new all time high above 69K, if we ETH follows similar trend then we can expect new all time high on ETH.
Let's see how it plays out.
Stay tuned for more updates.
Cheers
GreenCrypto
BTC buy signalBitcoin is ready to rally upward targeting the swing point that broke above the market structure, so we expect a pullback to the order block bellow the liquidity zone as our point of interest.
BtcUSDTafter btc create new all time high, to tell us that the uptrend continue, i will like to see a temporary pull back to around 110k to join the bull run again. trading a pull back can be risk.
but no risk no win. trade what you see

BTC/USDT Technical Analysis Market Overview
Bitcoin is currently trading at $118,788, with an intraday high of $119,311. The market has recently tested a major resistance zone and is showing signs of a potential pullback toward a key demand zone before a possible continuation to higher levels.
Projected Scenario (Bullish Bias)
Expected pullback to the support zone around $105K – $108K.
If price holds and shows a bullish reversal, a breakout above $124K is expected.
Primary upside target: $142,807 (Fibonacci projection / potential new high).
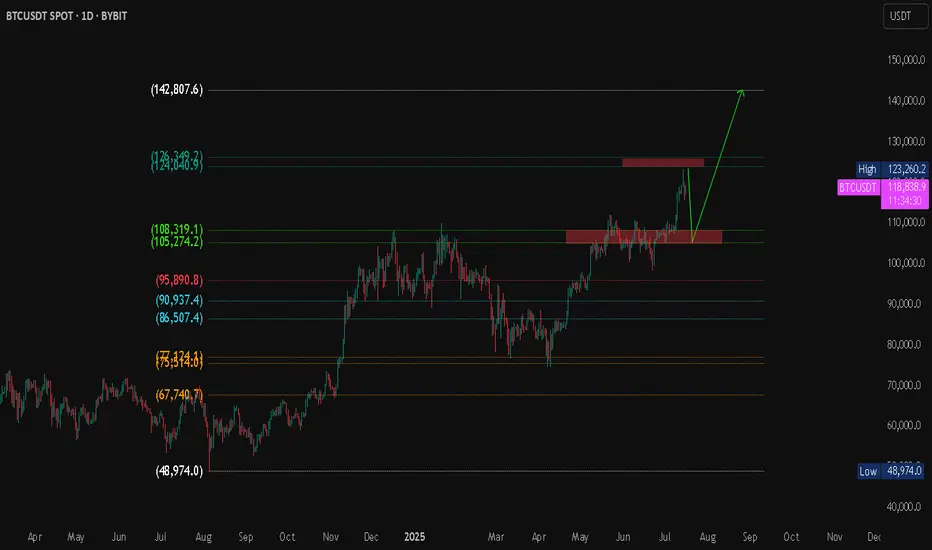
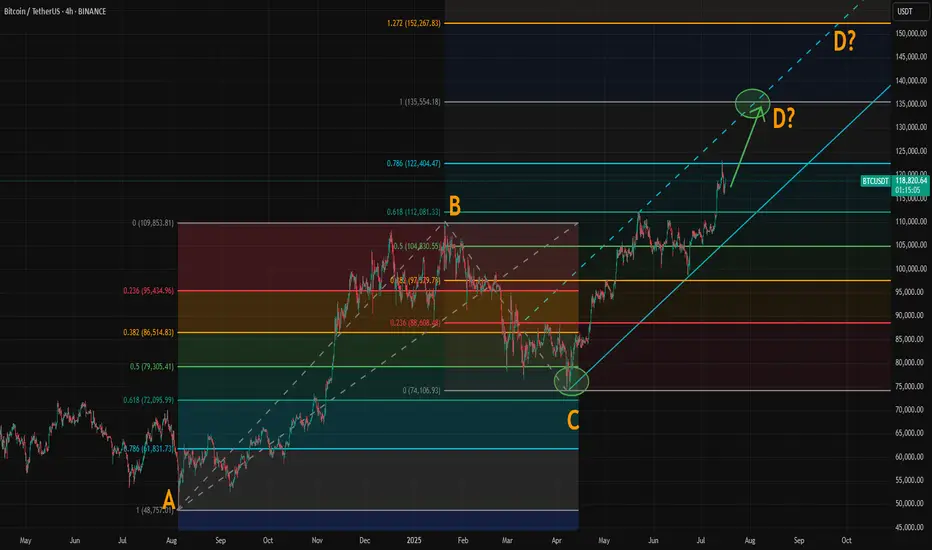
Where Could Bitcoin Make Its Cycle Top? Model and ABCD AlignedWith the breakout above resistance around 110,000, Bitcoin’s rally appears to be back on track. If you've been following our crypto analysis, either here or on our website, you’ll know our target range for this bull cycle is between 135,000 and 150,000, with the top of the range possibly extending further depending on the strength of the final wave.
Now, a possible ABCD pattern is forming, with point D potentially landing at either 135,000 or 150,000. A coincidence? Maybe, maybe not.
How Did We Arrive at the 135K–150K Target?
We based this range on historical halving cycle returns:
Halving Year - Return to Cycle Top
2012 - 9,076%
2016 - 2,122% (↓ 4.27x)
2020 - 541% (↓ 3.92x)
Two things stand out:
Each cycle has shown diminishing returns.
The rate of decline appears roughly consistent, dropping by around 4x each time—but slightly less with each cycle.
So depending on the multiplier used:
If returns fall by 4.27x again → target: 135K
If reduced by 4x → target: 140K
If reduced by 3.92x → target: 142K
If the rate of reduction itself slows (difference of 0.35 between 4.27 and 3.92) → target: 150K
While the sample size is too small, we believe the model holds reasonable logic with fundamental backing from various metrics.
The chart now shows a possible ABCD pattern:
If it becomes a classic AB = CD structure, point D could form near 135K.
If it becomes an extended ABCD (with CD = AB × 1.272), then point D could reach just above 150K.
These technical targets align closely with our halving model projections, increasing our confidence in the 135K–150K range as a likely top zone for this cycle.
Also, please check our earlier post for possible altseason start. A correlation between BTC/ETH and Gold/Silver might give some tips about possible Ether surge.
Bitcoin breaks through $120,000Bitcoin breaks through $120,000: long opportunities under the resonance of fundamentals and technical aspects
I. Fundamentals: Multiple positive factors drive the bull market
Institutional funds continue to pour in
The net inflow of US spot Bitcoin ETFs reached US$2.7 billion in a single week (a single-week record in 2025), and BlackRock IBIT's management scale is close to US$100 billion410.
Listed companies (such as MicroStrategy) continue to increase their holdings, with a total holding of more than 850,000 BTC, worth nearly US$100 billion6.
Policy easing expectations strengthen
The US "Cryptocurrency Week" deliberates on three key bills (the "GENIUS Act" and the "Clarity Act", etc.). If passed, it will clarify the regulatory framework and eliminate market uncertainty210.
The Trump administration promotes crypto-friendly policies, including the "National Strategic Cryptocurrency Reserve" plan, to boost market confidence69.
Macroeconomic environment support
Expectations of Fed rate cuts are rising, funds are flowing into risky assets at an accelerated pace, and Bitcoin's safe-haven properties as "digital gold" are strengthened13.
2. Technical aspects: Breaking through key resistance, upward space opens
Key breakthrough confirmed
Bitcoin breaks through the $120,000 mark, completely gets rid of the $90,000-110,000 oscillation range, and forms a daily level "ascending triangle" breaking through 210.
RSI (daily) is in the healthy range of 60-70, no overbought signal appears, MACD golden cross continues, showing strong upward momentum 69.
Support and target
Short-term support: $118,000 (previous high conversion support), if it falls below, look at $112,000 (20-day moving average).
Upward target:
Short-term: $135,000-140,000 (Fibonacci extension level + institutional bullish consensus) 910.
Medium- to long-term: $200,000 (forecast by Standard Chartered Bank, Bitwise and other institutions) 48.
Derivatives signal
Short positions intensify the rise: $740 million of short orders were liquidated within 24 hours, forming a "short squeeze" positive feedback 26.
The options market is piled with bullish bets, and the open interest of $150,000 call options expiring in December has surged by 10.
Long-term ideas, entry strategies
Positions can be opened in batches at the current price (around $120,000), with a stop loss set at $115,000 (key psychological support).
If it stabilizes in the range of $118,000-115,000, you can increase your position.
Target and risk control
First target: $135,000 (technical resistance + institutional consensus).
Second target: $150,000 (trend continuation + policy catalysis).
Be wary of short-term fluctuations: If it falls below $115,000, the trend needs to be re-evaluated.
Configuration suggestions
Main position is Bitcoin, and auxiliary position is Ethereum (ETH breaks through $3,000, with great potential for catch-up) 10.
Avoid high leverage, and pay attention to the volatility that may be caused by the implementation of US regulatory details in August 18.
Conclusion: Bitcoin is driven by policy, capital, and technology, and the bull market pattern is clear. There may be short-term fluctuations, but the trend has not changed, and buying on dips remains the main strategy.
BTC updateHere is the next upside Target. But - we're overbought, so better (for longs) wait for pullback. Also, better for safety.
Good Luck!
Bitcoin Liquidity updateCRYPTOCAP:BTC
📄 Update on liquidity movement and key liquidity cluster points
◀️ Summary of the first movement: A sale occurred at 121826 and a break happened at 117612, after which liquidity was collected between 116 - 115
◀️ After collecting liquidity, we mentioned that breaking 117612 would allow testing 119723, and that is what happened
⭕️ Now, a selling range has formed between 120813 - 121826, which is clear on the price chart and the way it bounced down
🟣 The current movement is confined between 118398 - 117612
📄 Regarding trading ideas:
⭕️ The thought here is to buy between 11600 - 114813 if a break occurs at 117612 and trading starts below it
⭕️ The second idea, in case this break does not happen, is to wait for confirmation of trading above 118398, and in this case, it's preferable to wait until Monday

BTCUSDT BTC/USDT (Bitcoin):
Trend: Strong uptrend.
Current Conditions: Price is near key resistance around $117,000-$121,000 after a sharp rise.
Entry Recommendation: Entry is not recommended at this time. It is better to wait for a correction to the previous support area (e.g., $109,000-$111,000 or $105,000-$108,000) and look for confirmation of a bullish reversal. Entry at current levels is high risk due to the potential for a correction.
Cryptocurrency Futures Market Disclaimer 🚨🚨🚨
Trading cryptocurrency futures involves high risks and is not suitable for all investors.
Cryptocurrency prices are highly volatile, which can lead to significant gains or losses in a short period.
Before engaging in crypto futures trading, consider your risk tolerance, experience, and financial situation.
Risk of Loss: You may lose more than your initial capital due to the leveraged nature of futures. You are fully responsible for any losses incurred.
Market Volatility: Crypto prices can fluctuate significantly due to factors such as market sentiment, regulations, or unforeseen events.
Leverage Risk: The use of leverage can amplify profits but also increases the risk of total loss.
Regulatory Uncertainty: Regulations related to cryptocurrencies vary by jurisdiction and may change, affecting the value or legality of trading.
Technical Risks: Platform disruptions, hacking, or technical issues may result in losses.
This information is not financial, investment, or trading advice. Consult a professional financial advisor before making decisions. We are not liable for any losses or damages arising from cryptocurrency futures trading.
Note: Ensure compliance with local regulations regarding cryptocurrency trading in your region.
thanks for like and follow @ydnldn to have more information outlook and free signal.
About me :
"I am a passionate swing trader focused on analyzing financial markets to capture profit opportunities from medium-term price movements. With a disciplined approach and in-depth technical analysis, I concentrate on identifying trends, support-resistance levels, and price patterns to make informed trading decisions. I prioritize strict risk management to protect capital while maximizing profit potential. Always learning and adapting to market dynamics, I enjoy the process of refining strategies to achieve consistency in trading."
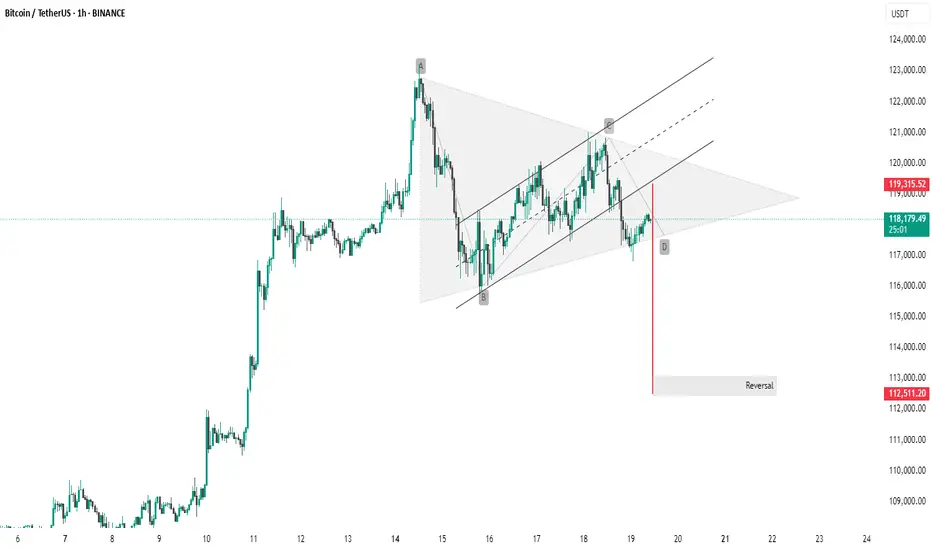
BTC #Bitcoin (BTC/USDT) 1-hour chartThis Bitcoin (BTC/USDT) 1-hour chart shows a bearish breakout from a symmetrical triangle or rising wedge pattern. The breakout is confirmed by a strong red candle below the lower trendline, suggesting downward momentum.
Pattern: Bearish wedge/triangle.
Breakout Level: ~118,000 USDT.
Target Zone: Around 112,511 USDT, marked as a potential reversal area.
Resistance: ~119,315 USDT.
This indicates bearish sentiment in the short term unless BTC quickly reclaims the upper trendline.
Thanking you
_Bitcoin Update
As you all know recently BTC just made a ATH record and aggressive move up panda fam right ? 🚀
Now bitcoin is consolidating or moving sideways in this structure panda fam same time altcoins are moving crazy upwards like altszn 🤯🚀
GOOD NEWS : Bitcoin is forming a possible good bullish structure for continuation pump panda fam, First confirmation will be break on trend resistance and reclaim above NEW ATH.
TAKE NOTE : As long as we are inside on the structure its still consider as sideways panda fam or ranging in short undecided directional bias. ✍️

BTC Pullback Near 200 EMA – Bounce or Breakdown?Bitcoin is currently undergoing a measured pullback after its recent push toward $121K. On the 1H timeframe, price has tested the 200 EMA and held so far, forming a short-term support near $117K. This aligns with a prior consolidation area and is showing some early signs of bottoming.
On the 4H chart, price is also consolidating after a healthy run-up. While momentum has cooled, BTC remains above key moving averages. RSI is approaching mid-range levels (~48), and the QQE is lightly bearish but not aggressive.
Key Zones to Watch:
Support (1H + 4H confluence):
🔹 $117,000 – $117,300 (EMA 200 + historical pivot + bounce region)
Resistance/Breakout Target:
🔹 $118,500 – $119,500 → Area where shorter EMAs are clustered
🔹 $121,000 → Previous local high
Take Profit (if bounce plays out):
🔹 TP1: $119,200
🔹 TP2: $120,800
🔹 TP3: $122,800
Scenarios:
Bullish Bias (if price reclaims $118.5K+):
Reclaiming EMAs and printing higher lows would suggest continuation.
RSI crossing 50 and increasing volume would confirm short-term bullish momentum.
Bearish Bias (if $117K breaks):
Breakdown from this base could send BTC to test $116K or even back to $114.5K range.
Look for volume spike + MACD/QQE confirmation for further downside.
Summary:
BTC remains in a constructive uptrend on higher timeframes. The current pullback is still within normal range, especially while price respects the 200 EMA on both 1H and 4H charts. This is a key decision zone—bulls want to see a reclaim of $118.5K, while bears need to break below $117K to take control.

Weekly trading plan for BitcoinBINANCE:BTCUSDT has currently set a new ATH, trading in the 121k-122k range. While no clear reversal signals are present yet, we're seeing early signs of a 4h RSI divergence. Without solid confirmation, short positions remain risky - price could liquidate shorts multiple times before any meaningful reversal. Key local level to watch is 119k
Trade safe and stay adaptive
