BTCUSDT.3L trade ideas

It is possible that Bitcoin is finishing wave 4It is possible that
Bitcoin is finishing wave 4
Will expand to wave 5
The target is more than 250,000 dollars

btc buy longterm"🌟 Welcome to Golden Candle! 🌟
We're a team of 📈 passionate traders 📉 who love sharing our 🔍 technical analysis insights 🔎 with the TradingView community. 🌎
Our goal is to provide 💡 valuable perspectives 💡 on market trends and patterns, but 🚫 please note that our analyses are not intended as buy or sell recommendations. 🚫
Instead, they reflect our own 💭 personal attitudes and thoughts. 💭
Follow along and 📚 learn 📚 from our analyses! 📊💡"

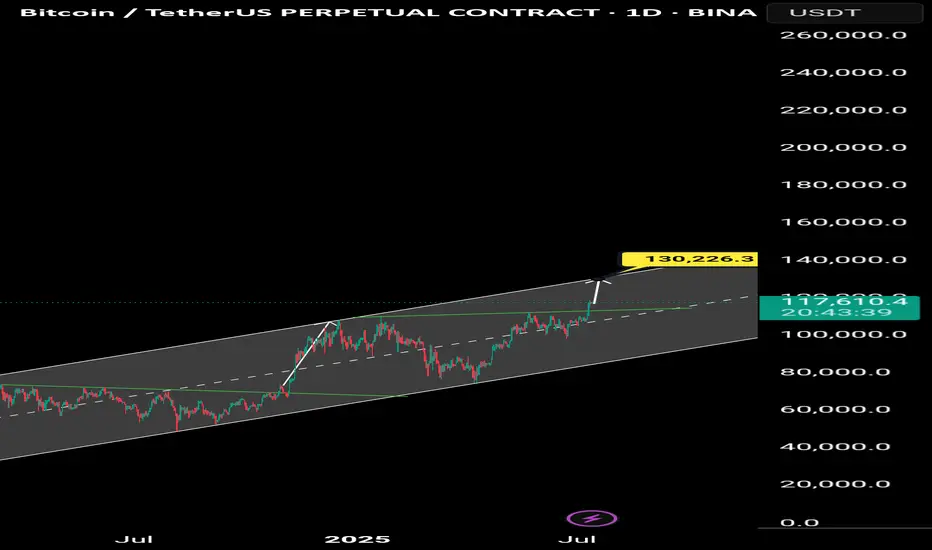
Bitcoin's Macro View: The Next Major Resistance ZoneAnalysis of the Daily Chart
This is the daily (1D) chart for Bitcoin (BTC/USDT), which shows the "big picture" trend over many months.
1. The Significance of the Breakout
You are correct to highlight the breakout. After consolidating for months and forming a solid base since April 2025, Bitcoin has now decisively broken out to new highs for the year. This is a very strong bullish signal on a macro scale, indicating that the long-term uptrend is accelerating.
2. The Immediate Resistance: The Green Zone ($128,000 - $132,000)
After such a powerful move, the next major obstacle is the area marked by the green box on your chart.
What is this zone? This area, approximately between $128,000 and $132,000, represents a major historical resistance or supply zone.
Why is it important? This is likely a price level where significant selling occurred in the past. As the price returns to this zone:
Traders who bought at the previous top may look to sell to get their money back ("break-even selling").
Bulls who have been riding the trend up from the lows may see this as a logical area to take profits.
New sellers may view it as an opportune level to open short positions.
What to Expect
When the price enters this key zone, we can expect a significant reaction. It is the next major battleground between buyers and sellers. Watch for:
A slowdown in the upward momentum.
A period of consolidation or sideways price action.
A potential rejection or a significant pullback from this area.
A clean and powerful break above this $128k - $132k zone would be an exceptionally bullish event, signaling a high probability of continuation towards new all-time highs.

Btcusdt 4hr timeframe, bullish iH&S patternComming from shorters take profit area, formed a bullish ih&s pattern. If closes above 108725 in 4hr time, may activate the pattern.
Targets are 111500, 115000 and 120000
Invalidation if closes below 105k

Bitcoin's Next Move: Planning the Counter-Trend ShortThis 30-minute BTC/USDT chart provides an excellent case study. After successfully identifying and trading the breakout from the consolidation range (highlighted in the brown box), the focus now shifts to a new, potential trade setup.
Asset: Bitcoin / TetherUS (BTC/USDT)
Timeframe: 30-Minute
Recap: The price has powerfully broken out of its previous range, a move that was anticipated and resulted in a successful long trade.
Current Situation: Following the strong, nearly vertical rally, the price is approaching the psychological $120,000 level. Runs like this are often followed by a period of profit-taking or a short-term pullback.
The New Trade Plan: A Bearish Setup
The chart now displays a new short position setup. This is a bearish, counter-trend trade designed to profit from a potential price rejection.
Strategy: To sell or "short" Bitcoin at a higher price, anticipating a pullback. This is a riskier strategy than trading with the trend, but it's based on the idea that the sharp rally is due for a correction.
The Setup is as follows:
Entry (Sell): $120,222.31
Take Profit (Target): $119,323.25
Stop-Loss (Invalidation): $120,579.09
In summary, after the breakout rally, the plan is to watch for signs of exhaustion. If the price pushes up to the $120,222 level and gets rejected, this trade aims to capture the resulting downward move towards the $119,300 area. The stop-loss is placed tightly above to manage risk in case the powerful uptrend continues without pausing

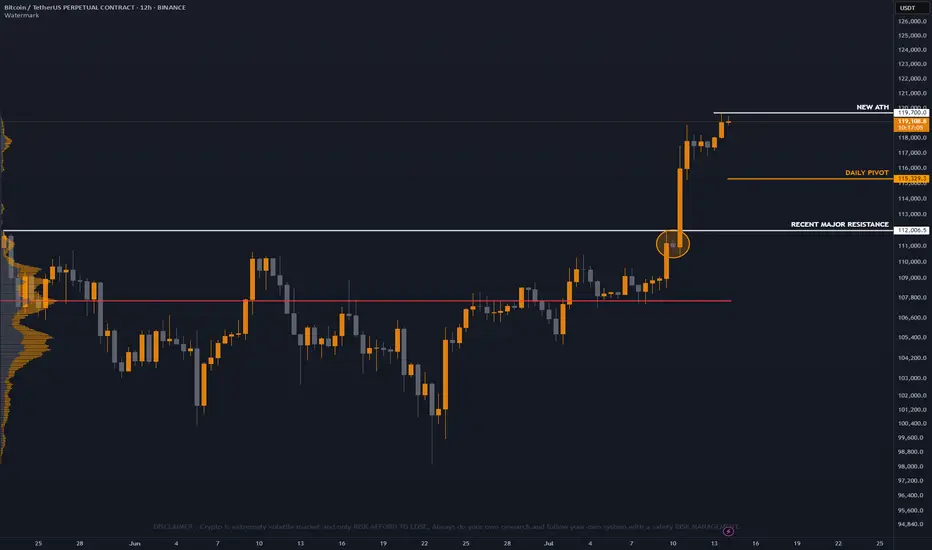
Bitcoin Update H12 Timeframe
New All time high unlocked again this time at 119700 area ! 🚀
Take note panda fam there's a unfilled gap below on bitcoin price still consider correction below is still possible, Above ATH price is discovery price panda fam.
But as of now since BTC is on fire and hype, Buyers volume are still strong this time, Trade safe always panda fam will focus on altcoins scalp trade. 🔥
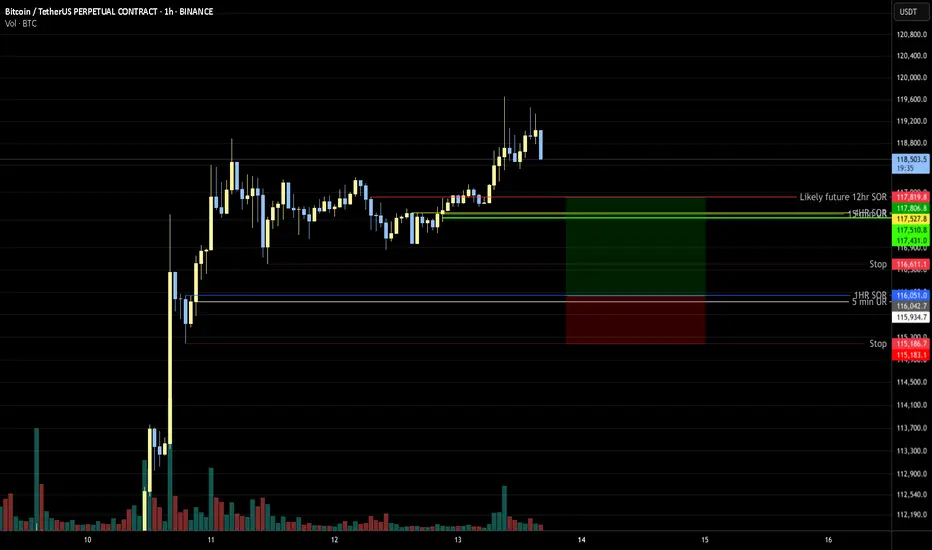
Bitcoin Overall: higherBitcoin most likely to continue higher from one of the indicated ranges. It may be best to split a trade 1/2 entry on one and 1/2 entry on other with stop below the second, or 2 trades with 1/2 normal risk.
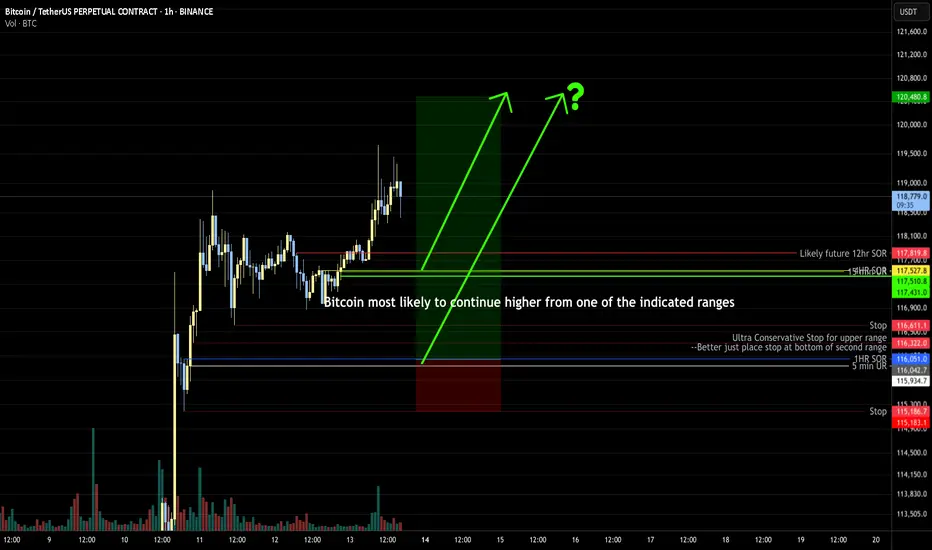
2 RRBitcoin has risen significantly, if it retraces some it will likely stop at the indicated range. Target will need to be selected after the entry based on the development of the chart.
BTC/USDT – Weekly Outlook & Reflection (15m, Ichimoku) by RiscorA new trading week begins after an exceptionally strong bullish close last week. Given the strength of that rally — and seeing how long/short ratios are now heavily skewed to the long side — I expect this week to open with a pullback.
To me, the bullish impulse feels exhausted, so I’m watching for a short-term retracement. My initial target is a move toward 117,500, but if the correction accelerates, we could even see a deeper dip, possibly down to the 113,000 area.
That said, the uptrend is still strong — any shorts here are high-risk, countertrend trades. I’ll treat all short setups as tactical reversals only, not as a full trend change. Caution is key in this environment!
Let’s see how the structure develops as the week unfolds.

Bitcoin (BTCUSDT) Potential Move from $43,600 to $120,000Description:
Based on the current weekly chart analysis for Bitcoin / Tether Standard Futures (BTCUSDT), there is a significant potential for Bitcoin to move from $43,600 to $120,000. Below are the key points observed:
Current Price: Bitcoin is currently trading at approximately $54,806.45, down by 5.75%.
Elliott Wave Analysis:
The chart indicates a potential ABC correction pattern.
Wave A has completed, and Bitcoin is currently in Wave B, which suggests an upcoming bullish Wave C.
Support and Resistance Levels:
The primary support level is at $39,987.31.
The significant resistance level and target is the area around $120,000.
Fibonacci Retracement Levels:
38.2% Retracement: $31,145.00
50.0% Retracement: $23,356.00
61.8% Retracement: $15,568.00
Indicators:
RSI shows potential bullish divergence indicating a possible upward move.
Volume profile indicates strong accumulation in the lower price ranges.
Extrem Buy Alert: The chart highlights an "EXTREM BUY ALERT," suggesting that the current levels could be a significant buying opportunity before the expected upward move.
Chart Details:
Timeframe: Weekly (1W)
Ticker: BTCUSDT.PS
Exchange: Binance
Disclaimer: This analysis is based on historical data and technical indicators. It is not financial advice. Please conduct your own research before making any trading decisions.

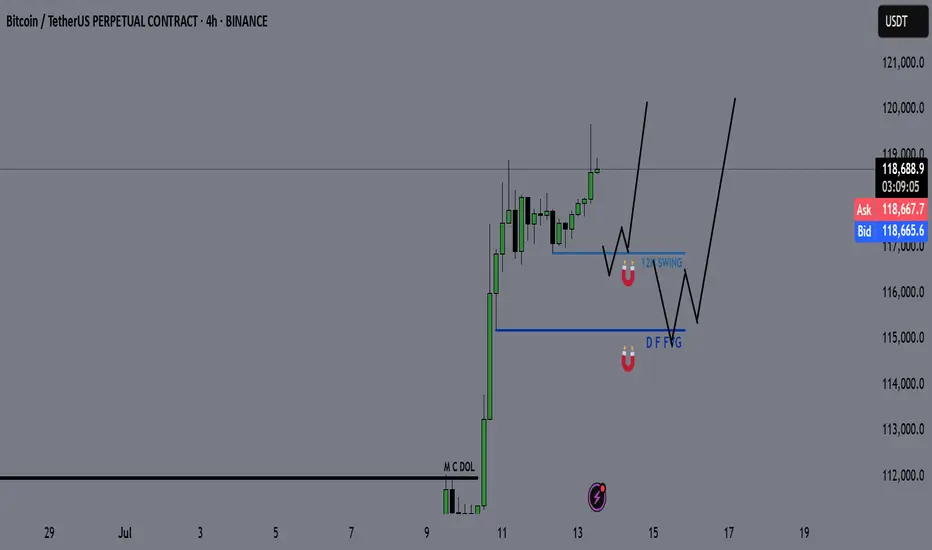
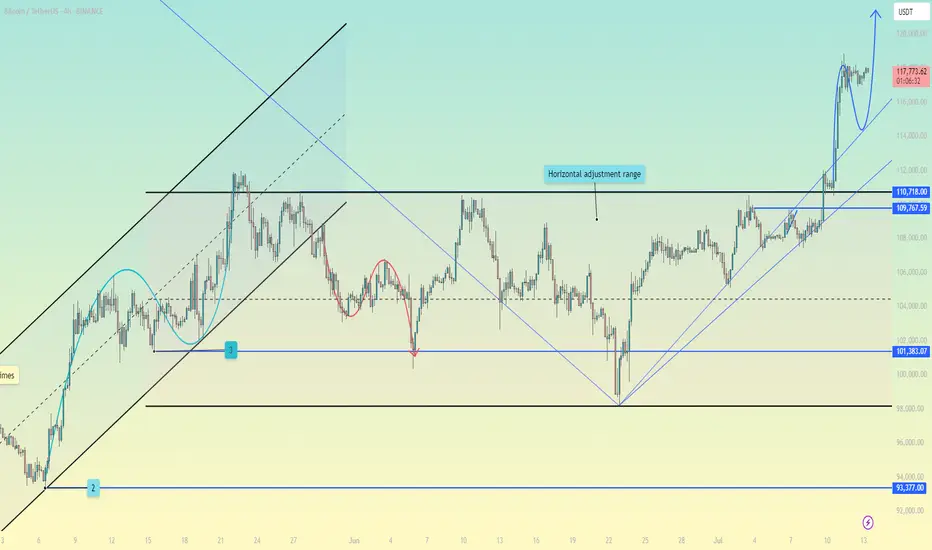
Bitcoin - BTC | Weekly Market Recap & Outlook 13.07.2025What Happened Last Week?
Bitcoin broke out of the recent downtrend structure and established a bullish leg with clear momentum.
The breakout was supported by volume and price structure, suggesting a trend reversal rather than a temporary deviation.
Weekly Bias and Strategy
The current outlook is bullish.
A retracement or sideways consolidation between the $120,000 and $114,000 zone is possible.
This zone may act as accumulation before further upside.
Key Points of Interest (POIs):
12H Swing Liquidity (turquoise line)
Daily FVG (blue line)
These levels will be monitored for long setups with confirmation on lower timeframes.
Macro Consideration – Fed Chairman Jerome Powell
Recent market speculation has increased regarding Jerome Powell potentially stepping down as Chair of the Federal Reserve.
If such a resignation is confirmed, it may act as a significant bullish catalyst for Bitcoin and other risk assets, possibly accelerating upside without allowing for any meaningful pullback.
Summary
• Bullish breakout confirmed
• Long bias maintained unless major invalidation occurs
• Watching retracement levels for entries
• Macro catalyst (Powell resignation) may trigger strong continuation without retrace
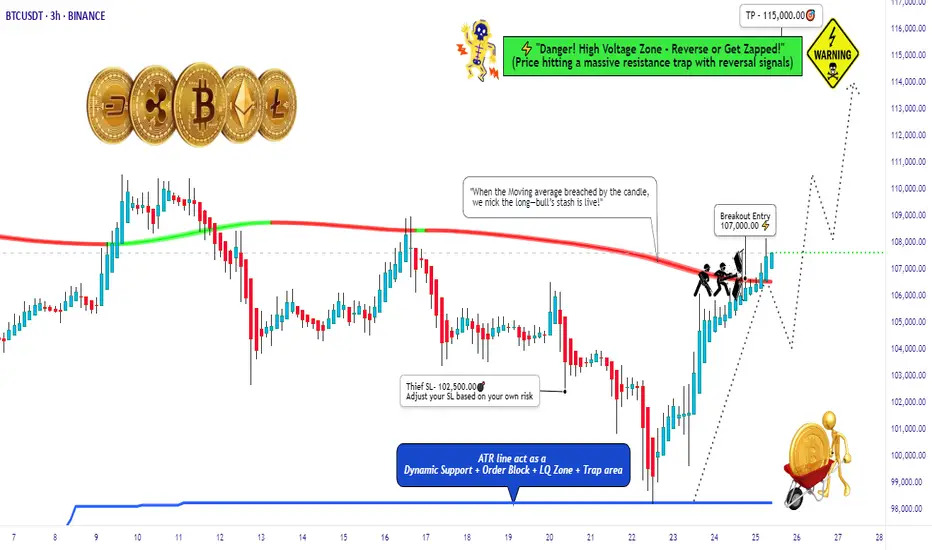
BTC/USD Thief Breakout at $107K – Eyeing $115K!🚨 Thief Entry Setup: BTC/USD Breakout Play 🚨
Overview:
Jump in after the $107 000 breakout—aiming for $115 000 with a tight “Thief SL” at $102 500. Adjust the stop‑loss to match your personal risk tolerance.
🧠 Setup Summary
Pair: BTC/USD
Entry trigger: Breakout above $107 000
Stop‑Loss: “Thief SL” at $102 500 (use your own risk‑based SL)
Target: $115 000
🎯 Why This Setup?
Clear breakout level at $107 000 = fresh momentum
Tight SL cushion (≈‑4.3%) = defined risk
Target ≈ +7.5% potential = strong reward-to-risk (~1.75:1)
📏 Risk Management Tips:
Only risk a small % of your capital—never exceed your comfort zone.
Move your SL to breakeven once mid‑target is hit to lock in profits.
Trailing your stop‑loss could secure bigger gains if BTC surges toward $115 000.
Flawless ExecutionA picture-perfect trade on CRYPTOCAP:BTC from start to finish. 🎯
The Plan: Wait for the breakout above resistance.
The Result: A powerful move straight through our target zone.
Clean analysis, clean execution, clean profits. On to the next one.
#Bitcoin #Trading #Crypto #TechnicalAnalysis #BTC

BITCOIN LONG TRADEWaiting for pullback to 105k region, Might not happen as Bitcoin seems to keep ripping from past experience.

BTCUSD IS still bullish? Yes sure
Hi dears
I think Bitcoin is continuing to rise. The first target is probably $120,000 and then $140,000.
What do you think?
If you agree with me, please like and comment.
Thank you.
Bitcoin hits a new high! Is this time really different?Bitcoin hits a new high! Is this time really different?
Bitcoin hits a new high! On July 11, BTC broke through $117,000 in one fell swoop, completely igniting market sentiment. Shorts were completely defeated, and 230,000 investors were liquidated within 24 hours, losing $541 million, of which 89% were short orders-this market is simply rubbing shorts on the ground!
But this rise is different from the past.
🔥 Why is Bitcoin so strong this time?
Institutions buy frantically: Bitcoin spot ETFs such as BlackRock and Fidelity continue to attract money, with net inflows exceeding $1.44 billion in 2025. What's even more exaggerated is that listed companies buy directly-143 companies around the world have hoarded 850,000 BTC, worth $95.3 billion! MicroStrategy alone holds 576,000 bitcoins and makes a fortune!
Expectations of Fed rate cuts: The market is betting that the Fed will cut interest rates this year, the dollar is weakening, and funds are pouring into Bitcoin for risk aversion.
Regulatory relaxation: Hong Kong, the EU and the United States are all promoting cryptocurrency compliance. The Trump administration even plans to establish a "national cryptocurrency reserve" to make institutions feel more at ease entering the market.
📈 Technical side: Can it rise again?
Breaking through key resistance: Bitcoin has stabilized at $112,000, the daily level "ascending triangle" breakthrough has been confirmed, MACD golden cross, RSI healthy (not overbought).
Next target: $120,000! But if it falls below $107,000, it may face a correction.
Be careful of high leverage: The current market is dominated by futures, and the spot/derivatives trading volume ratio is only 0.07. Once it pulls back, it may trigger a chain of liquidations!
⚠️ Risk: Don't be blinded by FOMO (fear of missing out)!
Short-term overbought: H4 level RSI has reached 72 and may pull back at any time.
Policy variables: If the Fed postpones the rate cut or the situation in the Middle East worsens, BTC may fall to $55,000!
Regulatory uncertainty: Global policies have not yet been unified, China still bans cryptocurrencies, and the problem of stablecoin reserves has not been completely resolved.
🚀 Operational suggestions: How to operate?
Radicals: Buy when it falls back to around $110,500, with a target of $120,000 and a stop loss below $107,000.
Conservatives: Wait until it stabilizes at $117,500 before chasing the rise, or wait until it falls back to the support level before entering the market.
Long-term holding (HODL): Institutions are hoarding coins, why are you panicking? But don't bet all in, keep some bullets to deal with black swans!
🎯 Conclusion: The bull market continues!
This wave of Bitcoin's rise is driven by institutions + policies + liquidity. Unlike the retail carnival in 2017 and 2021, this rise is more sustainable. But the market will not only rise but not fall, and it may fall back in the short term. Don't use high leverage!
Remember: make money in a bull market and make money in a bear market. Don’t be afraid of missing out (FOMO), and don’t be greedy. Only by surviving can you get the next wave of dividends! 🚀
(PS: If you haven’t bought it yet, don’t worry, wait for a pullback before buying it. There are always opportunities in the market, but if the principal is gone, it’s really gone!)
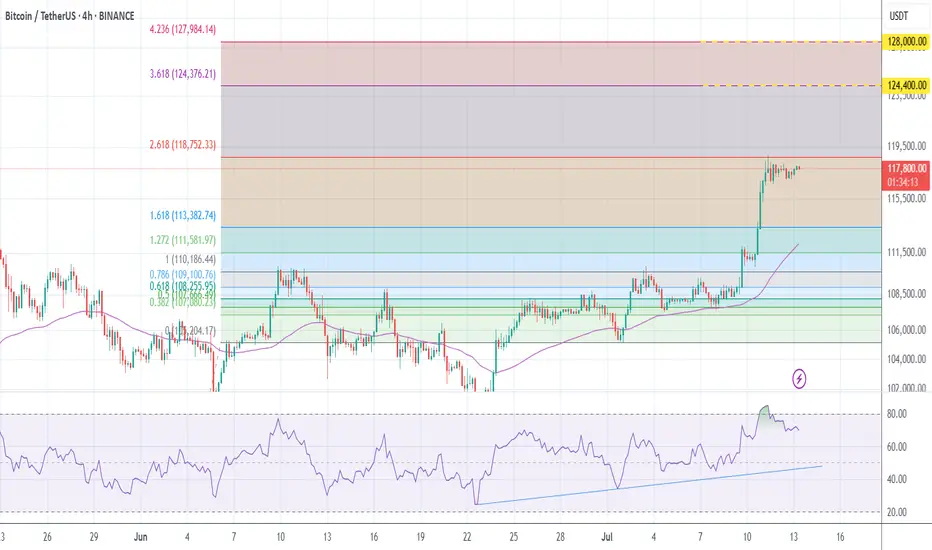
#Buy Bitcoin H4This trading system based on Divergency and fibo level
Bitcoin has reached the target level of 2.62 and in the continuation of the upward trend has the potential to reach the levels of 3.62 and 4.23 at prices of 124,400 and 128,000 and then the end of the story.
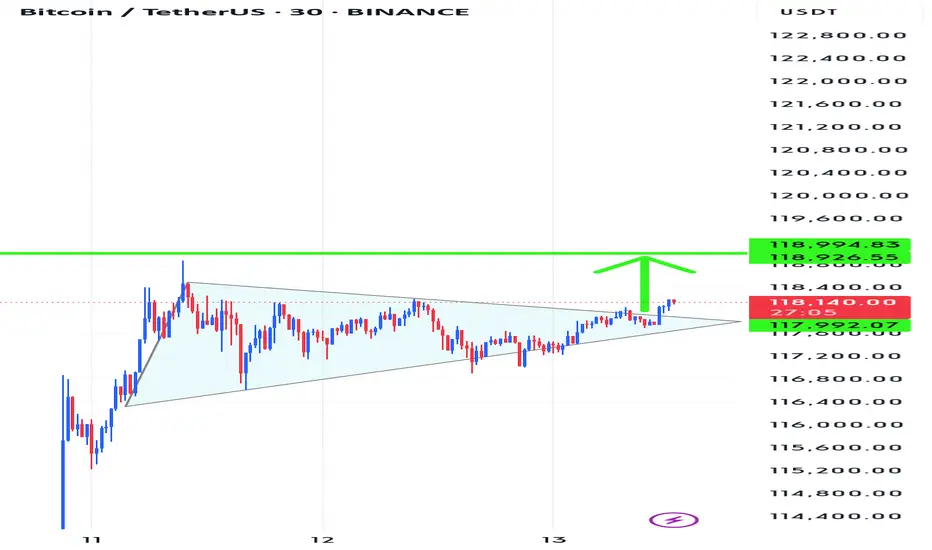
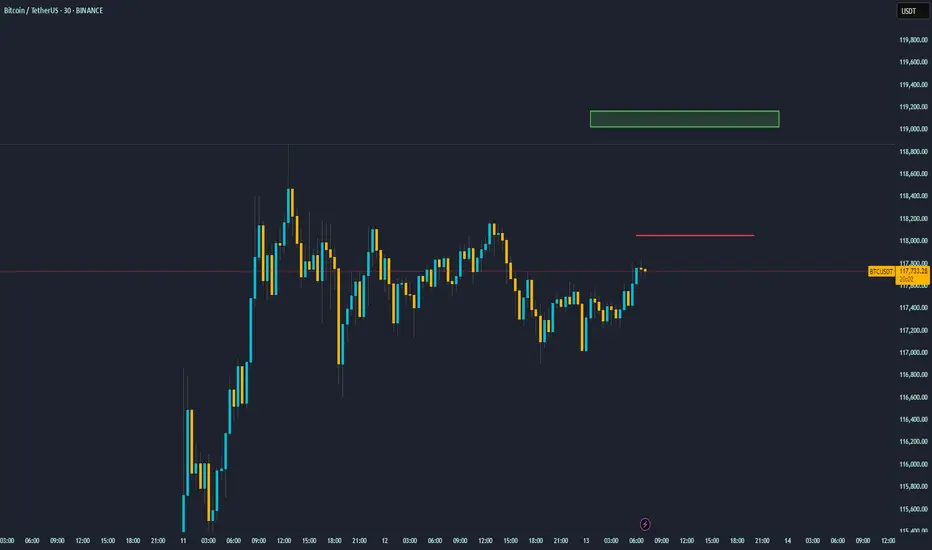
Bitcoin at a Crossroads: Key Levels to WatchThis 30-minute chart for Bitcoin (BTC/USDT) shows the price consolidating within a range after a strong upward rally. The key levels drawn on the chart outline a potential trading plan for the next short-term move.
Asset: Bitcoin / TetherUS (BTC/USDT)
Timeframe: 30-Minute (Short-term outlook)
Current Situation: After a significant price surge on July 11th, Bitcoin has entered a sideways consolidation phase. The price is currently making a move towards the top of this range, approaching a critical resistance level.
Key Levels Explained
Immediate Resistance (~$118,000): The red horizontal line marks the immediate resistance. This is a crucial level that has previously rejected the price. For the current upward momentum to continue, Bitcoin must decisively break and hold above this price ceiling.
Primary Target / Supply Zone (~$118,900 - $119,100): The green box above represents the next major resistance area or "supply zone." This is the logical target for bulls if they can successfully break through the immediate $118,000 resistance.
Potential Scenarios
Bullish Scenario: If Bitcoin breaks through the $118,000 red line with strong volume, it would signal a potential continuation of the uptrend. Traders would then look towards the green box around $119,000 as the next take-profit area.
Bearish Scenario: If Bitcoin fails to break the $118,000 resistance and gets rejected, it is likely to fall back towards the lower end of its current range. The recent lows around $117,000 - $117,200 would act as the first line of support.
Bitcoin Go 130kBitcoin is heading towards 130,000 tomorrow
The alt season has begun and the market is sharply bullish.
BTC & USDT.D => Bullish Correction Incoming?Hello TradingView Family / Fellow Traders. This is Richard, also known as theSignalyst.
Both BTC and USDT.D are sitting around key rejection zones.
💰 BTC is hovering near the $100,000 level — a major previous low and a psychological round number.
📊 Meanwhile, USDT.D is testing the 5% resistance — a supply zone and another critical round number.
As long as $100,000 holds as support on BTC and 5.1% holds as resistance on USDT.D, we could expect a bullish correction across the crypto market.
What do you think? Will these levels hold or break? 🤔
📚 Always follow your trading plan regarding entry, risk management, and trade management.
Good luck!
All Strategies Are Good; If Managed Properly!
~Rich

Bitcoin goes higher! Hello lads. I’m expecting BTC to go much higher than people say. The price is respecting the extensions range
BTCUSDT | Bullish | Going to make new highs.BTCUSDT is in bullish trend and its parabolic move paves way for new highs.It will print new higher low and make the second leg of the trend.Thus it will continue its bullish trend until unless it breaks its higher low.
