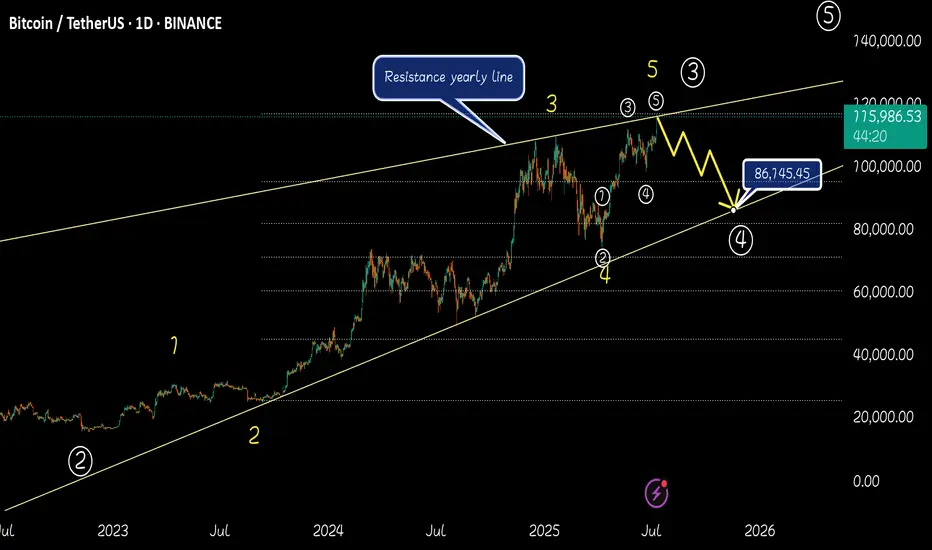
Crash incoming 117k - 86k Today btc record a new ATH . according to the Elliotts theory 117K was the end of main wave 3 . i think btc will start to dump very soon to 86k (wave4 ) . its need to start main wave 5 (86k - 140k) . Good luck. I think btc will bearish in next days.
BTCUSDT.3L trade ideas
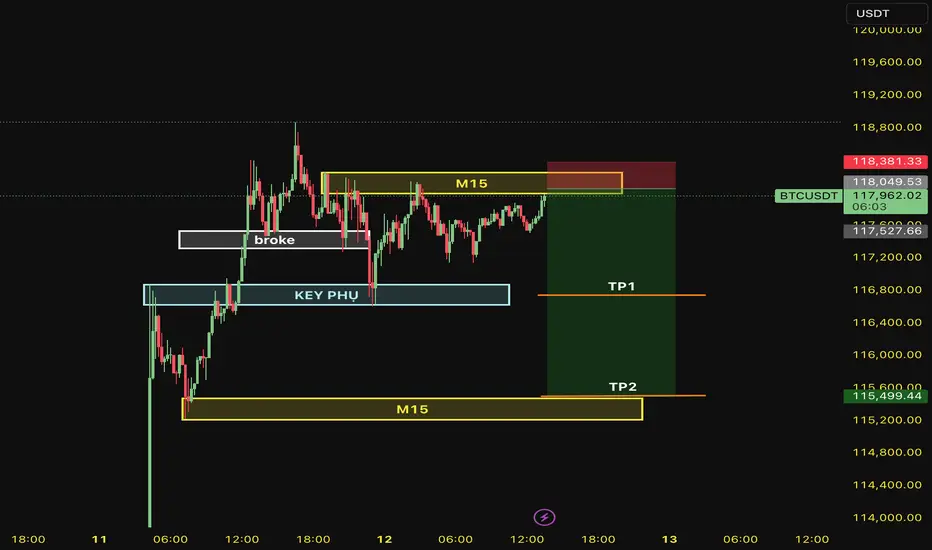
SHORT BTC 12/07/2025OUR STRATEGY TODAY.
Technical Analysis: FORECAST the price will hit M15 AT 115,500 because it broke M15 at 117,520.
- SELL at 118,000 because M15.
- TP1: SUB KEY at 116,727
- TP2: MAIN KEY at 115,504
- SL: 118,382
BTCUSDT – Market Update & RecommendationBTCUSDT – Market Update & Recommendation
In my previous analysis published on June 1, 2025 (TradingView), I mentioned the corrective pullback towards the $100k area before BTC resumed its next upward wave.
My latest evaluation (posted recently on my personal blog, linked in my TradingView signature) stated clearly that BTC would rise toward $110k, then experience a minor retracement to around $108.2k before consolidating and reaching new ATH between $118k–$125k.
At present, BTC has successfully touched the $118k mark and is undergoing a minor correction—this is a critical consolidation phase before price approaches the significant $125k distribution zone.
Recommendation:
Investors holding BTC purchased below $108k should closely monitor price action to secure profits as necessary.
Consider signals for potential Swing Short positions based on monthly (M) timeframe bottoms. This is a powerful and extended signal, potentially lasting until the end of 2025.
Caution is advised for any new BTCUSDT positions at this time.
Link:

BTC 4 HR TIME FRAME ANALYSIS 4H Technical Analysis – BTCUSDT.P (Bitcoin Perpetual on Bitget)
✅ 1. Trend Overview:
Current Market Phase: Strong uptrend.
Price has broken multiple H4 BOS (Break of Structure) levels with strong bullish momentum.
The last impulse candle shows a vertical breakout, often a sign of aggressive buyers or FOMO.
🔄 2. Key Structure Zones:
🔵 Demand Zones (Highlighted in Green):
Around 113,700–114,000 → fresh demand zone after last breakout.
Around 108,000–110,000 → mid-level zone from earlier accumulation.
Deeper zone at ~96,000–98,000 → higher timeframe demand (may hold if larger correction happens).
🔴 Supply Zones (No immediate supply shown, but...)
Watch for reaction zones around 118,000–120,000 as psychological resistance.
📍 3. Price Action & Structure:
The current move is parabolic, indicating momentum exhaustion may soon follow.
However, the last CHoCH and BOS signals are clearly bullish, and pullbacks are being aggressively bought.
Short-Term Expectation:
A correction or sideways consolidation may happen near 118,000–119,000.
Best scenario: price pulls back into the 113,700 zone, forming a bullish continuation setup.
🔍 4. Candlestick Patterns:
At the top, the last 2 candles are showing wicks, indicating possible early rejection or take-profit activity.
No confirmed reversal pattern yet (e.g., no bearish engulfing, pin bar, or evening star).
Wait for confirmation if considering a reversal trade.
📉 5. Risk Zones:
If price breaks below 113,700, then correction may deepen toward 110,000 or even 108,000.
Below 108,000 would invalidate the current short-term bullish structure and signal trend weakening.
📌 6. Key Levels to Watch:
Type Price Zone Notes
Resistance 118,500–120,000 Current high zone, psychological barrier
Demand Zone 1 113,700–114,000 Nearest fresh demand
Demand Zone 2 108,000–110,000 Mid support
HTF Demand ~96,000–98,000 Deep liquidity + structural demand
✅ Conclusion:
Market is in a strong bullish trend on the 4H chart.
Wait for a healthy pullback to demand zones before considering new longs.
Watch for bearish candlestick confirmation (like engulfing or M-structure) near highs for possible short-term reversals.
⚠️ Disclaimer:
This is not financial advice or a trading signal.
It's purely educational analysis.
Always trade based on your personal strategy and risk management. BITGET:BTCUSDT.P

BITCOIN Bitcoin and the Potential Move to $136,000 based on my price action +sma+ema advanced strategy.
Current Market Context
Bitcoin (BTC) is trading near all-time highs, recently surpassing $117,000-118000
The market is characterized by strong institutional inflows, robust ETF demand, and bullish technical momentum.
Is a Move to $136,000 Possible?
Analyst and Model Forecasts
Bitwise Asset Management and several market analysts see a 30% rally possible in July, which could push Bitcoin to the $136,000 level. This projection is based on:
Historical post-crisis rallies (average 31% gains after macro/geopolitical shocks).
Institutions buying more BTC than miners can supply.
Global rate cuts increasing liquidity and risk appetite.
Quantitative models and technical forecasters also predict a range between $136,000 and $143,000 as a potential 2025 high, with some models extending targets to $151,000 and beyond.
Other major banks and analysts (e.g., Standard Chartered, Bernstein, Fundstrat) maintain even higher year-end targets ($150,000–$200,000), but $136,000 is seen as a key intermediate technical and psychological level.
Technical Analysis
Bullish momentum is confirmed across short, medium, and long-term timeframes.
Key resistance levels to watch: $120,000 (psychological), $130,000 (round number), and $136,000 (target zone highlighted by several analysts).
Sustained trading above $112,000–$118,000 would support a move toward $130,000–$136,000, especially if ETF inflows and institutional demand remain strong.
Drivers Supporting the $136K Scenario
ETF and Institutional Inflows: Demand from US spot Bitcoin ETFs and corporate treasuries remains robust.
Macro Tailwinds: Expectations of US Federal Reserve rate cuts and a weakening dollar are fueling risk-on sentiment.
Supply Dynamics: The recent Bitcoin halving has reduced miner supply, amplifying the impact of new demand.
Technical Breakouts: Bull flag and breakout patterns suggest further upside, with $136,000 cited as a technical extension target.
Risks and Considerations
Volatility: Bitcoin remains highly volatile; sharp pullbacks are possible even in a strong uptrend.
Regulatory and Macro Risks: Changes in regulatory stance or a major shift in macro conditions could impact the trajectory.
Profit-Taking: Approaching major round numbers like $130,000 or $136,000 could trigger profit-taking and temporary corrections.
Summary Table: Bitcoin 2025 Price Targets
Source/Model 2025 Target Range $136K Move Outlook
Bitwise, Polymarket $136,000 (July 2025) High probability if current trends persist
Coinfomania AI Model Up to $143,440 $136K within model range
Investing Haven $80,840–$151,150 $136K within bullish scenario
Changelly, CoinDCX $100,000–$150,000 $136K is a key resistance
Standard Chartered $120,000–$200,000 $136K as a stepping stone
Conclusion
A move to $136,000 for Bitcoin is considered plausible in 2025 by my market structure advanced strategy , This scenario is supported by strong institutional demand, favorable macro conditions, and bullish technical patterns. However, volatility and macro/regulatory risks remain, so price action should be monitored closely as BTC approaches key resistance levels at 120k and 136k level
#bitcoin #btc

#BTC Update #6 – July 11, 2025🟠 #BTC Update #6 – July 11, 2025
Bitcoin has surged nearly 9% from the supply zone and is currently trading around the $119,000 level. However, looking at the current volume, the momentum seems to be fading.
If a correction takes place, the potential support zones are:
✨First stop: $114,000
✨Second stop: $113,000
✨Third stop: $111,500
After a pullback, the next target may be around $122,000. However, macroeconomic risks are rising. The U.S. is considering a 500% tariff on Russia imports, and in the past, even a 100% tariff triggered a sharp drop in Bitcoin.
Since BTC has already made a significant move up, I don’t think opening a Long or Short position is wise at the moment. Just observing for now.

Bitcoin: Final Push in the 60-Day Cycle?Bitcoin appears to be making its final move higher within the current 60-day cycle. We could potentially see a push into the $121K–$122K range before a sharp correction takes us down to around $110K–$112K toward the end of the month, driven by the 3-day cycle timing.
After that, we’re likely to form a new 60-day cycle low, which could set the stage for a renewed move to the upside.
Is it time to go long?
At this point, the risk/reward doesn’t look favorable for new longs. Personally, I’m watching for one final push above $120K to consider opening a short position into the expected cycle low.

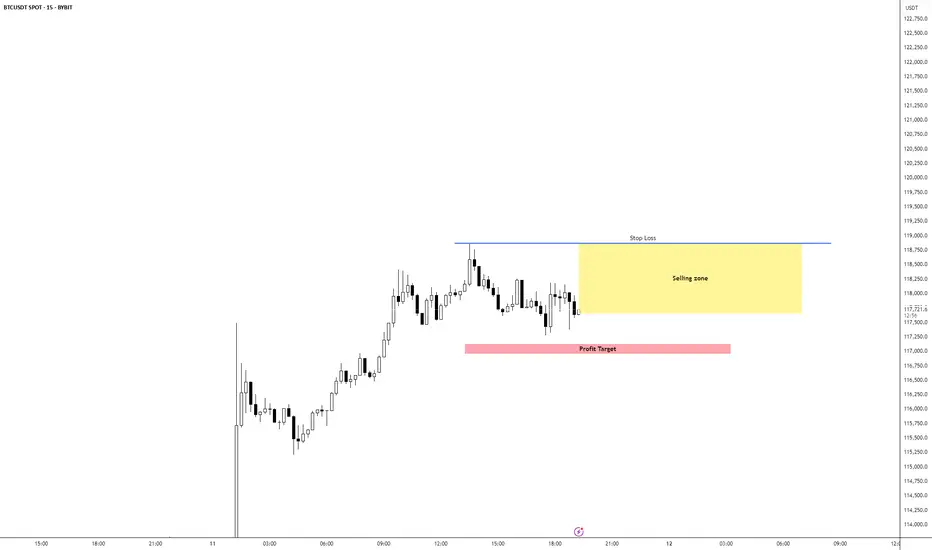
BTC/USD Short IdeaBTC/USD is currently bullish overall but seems overextended, Expecting a pullback to the 5m Equilibrium levels which would be our TP area. 1M has switched bearish adding confluence to our setup.
I would be layering short positions inside the yellow selling zone
BTCUSDT: Breakout Confirmed, Bulls in ControlThe primary technical feature here is a well-established ascending channel that has been guiding the price higher for several months. The market has respected this structure with remarkable precision, using the lower green bands as a launchpad and the median red line as a dynamic point of interest.
The Bullish Breakout:
What demands our attention now is the recent price action. After a multi-week consolidation period, where price traded within a range between roughly 100,000 (Down) and 110,000 (Up), we have witnessed a decisive breakout. This is a classic continuation pattern, signaling that the bulls have absorbed the selling pressure and are ready to push for the next leg higher.
Key Support: The breakout level, marked as the Key Support Area around 110,000, is now the most critical level to watch. What was once resistance is now the primary floor. As long as the price holds above this zone on a daily closing basis, the immediate outlook remains firmly bullish.
Next Target: With this breakout, the path is cleared for a test of the upper boundary of the ascending channel. The recent high near 117,500 is the first hurdle, but a sustained push could see price targeting the 125,000 level and beyond in the coming weeks.
The Bearish Invalidation:
For this bullish thesis to be invalidated, we would need to see a clear sign of weakness.
The first warning shot for the bulls would be a failure to hold the Key Support Area, with the price closing back inside the previous consolidation range below 110,000.
A definitive shift in the trend would only occur with a break and close below the primary support of the entire ascending channel.
Conclusion:
The technical picture for Bitcoin is strong. The recent breakout from a defined range within a larger uptrend is a high-probability bullish signal. The path of least resistance is up. The strategy is to look for continued strength as long as the price remains constructive above the 110,000 support zone.
Disclaimer:
The information provided in this chart is for educational and informational purposes only and should not be considered as investment advice. Trading and investing involve substantial risk and are not suitable for every investor. You should carefully consider your financial situation and consult with a financial advisor before making any investment decisions. The creator of this chart does not guarantee any specific outcome or profit and is not responsible for any losses incurred as a result of using this information. Past performance is not indicative of future results. Use this information at your own risk. This chart has been created for my own improvement in Trading and Investment Analysis. Please do your own analysis before any investments.

Where Can Bitcoin Go? Part 9 – Breakout and History in Motion🌋🚀 Where Can Bitcoin Go? Part 9 – Breakout and History in Motion. 🔓💥
The breakout over 114900 has happened.
After 2 rejections, years of preparation, and countless fakeouts… Bitcoin has finally cleared the $114,921 barrier.
We are now officially in price discovery mode within the upper resistance channel.
📍 As long as BTC stays above $114,900 – we are long.
This level is now our trigger line. Lose it? Flip back to short bias. Hold it? There’s only one word: 🚀
🔑 Context:
We’ve tracked this structure since 2023 using a 1-2-3 model based on macro highs. The third test is always the decider — and this time, we broke through.
✅ Test 1: Rejected (2021)
✅ Test 2: Rejected (2025)
✅ Test 3: Breakout confirmed (July 2025)
Now compare that to previous cycles:
2016 halving → ATH in 2017
2020 halving → ATH in 2021
2024 halving → ATH coming by end of 2025?
🧭 Based on this map, BTC’s next structural targets are:
→ $137K
→ $160K
→ $182K+
But there’s a catch: if we fall back below 114,900, the entire breakout thesis is at risk. This is now a binary zone.
⚠️ What to Watch:
📌 Support Retests:
Expect volatility around the 114.9–116K level. This zone will now be stress-tested.
📌 Media Frenzy vs Structure:
As hype increases, stick to levels — not noise.
📌 Ultimate FOMO vs Breakdown:
Hold structure = ATH potential
Lose structure = Down we go, potentially hard.
🎥 Missed the full structural breakdown?
👉 Watch “Where Can Bitcoin Go? Part 8” for the blueprint
👉 This is now Part 9 – The terminal move has begun
We are now playing for cycle maturity – this could be the final leg before topping out in late 2025.
Let’s trade it with clarity, not emotions.
One Love,
The FXPROFESSOR 💙
Disclosure: I am happy to be part of the Trade Nation's Influencer program and receive a monthly fee for using their TradingView charts in my analysis. Awesome broker, where the trader really comes first! 🌟🤝📈
🚨 BITCOIN HAS BROKEN OUT but keep in mind: under 114900 be OUT!

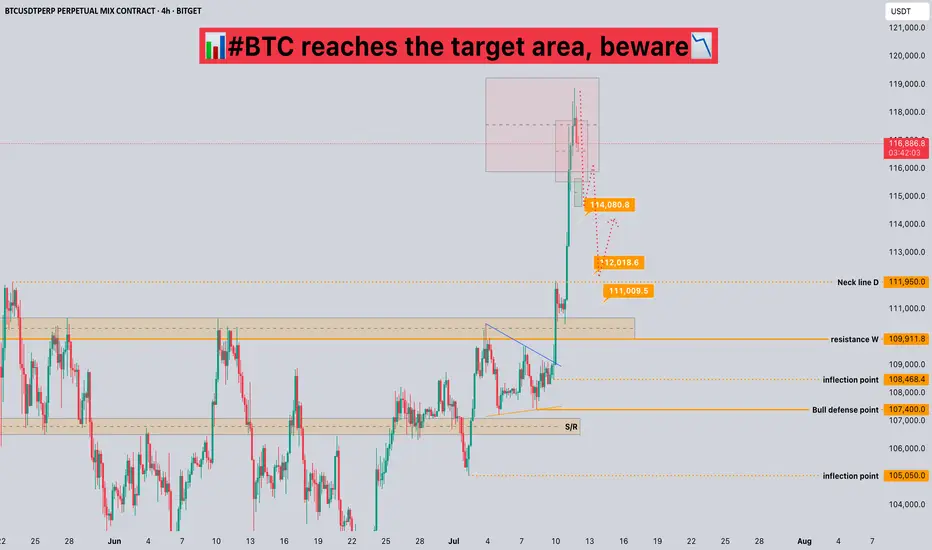
#BTC reaches the target area, beware📊#BTC reaches the target area, beware📉
🧠From a structural point of view, we have reached the target area of the bullish structure, so we need to be alert to the risk of callbacks and do not chase the rise in the target area!
➡️From a graphical point of view, the appearance of the ascending triangle means that the daily level of the upward trend is about to come to an end, so we need to be alert to the correction of the daily level. However, it is worth noting that the bullish trend at the weekly and monthly levels is still intact.
➡️Therefore, if we want to participate in long transactions, we must wait for the callback to occur. The aggressive support level is around 114000, and the stable support area is 110000-112000.
⚠️No matter how the market develops, it is reasonable, so please do a good job of risk management, keep yourself alive first, and then seek profits!
🤜If you like my analysis, please like 💖 and share 💬
BITGET:BTCUSDT.P
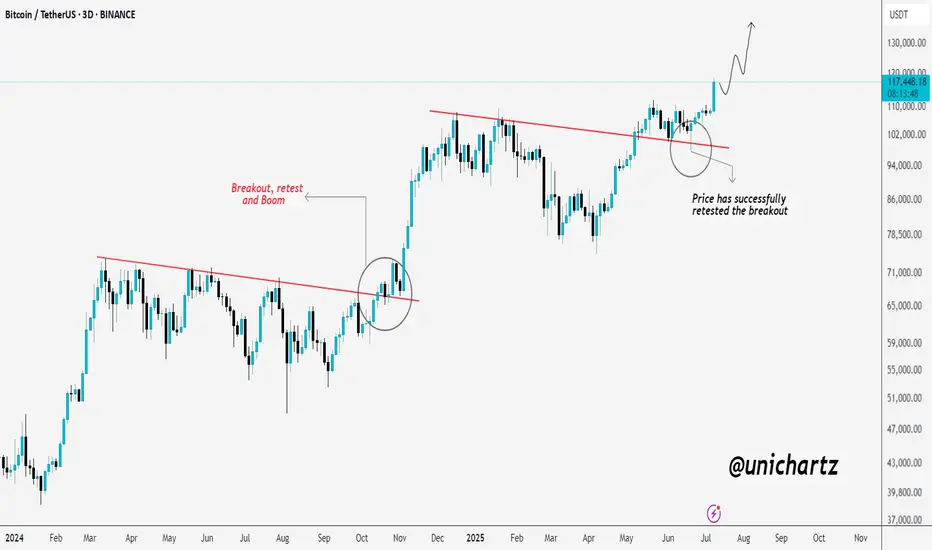
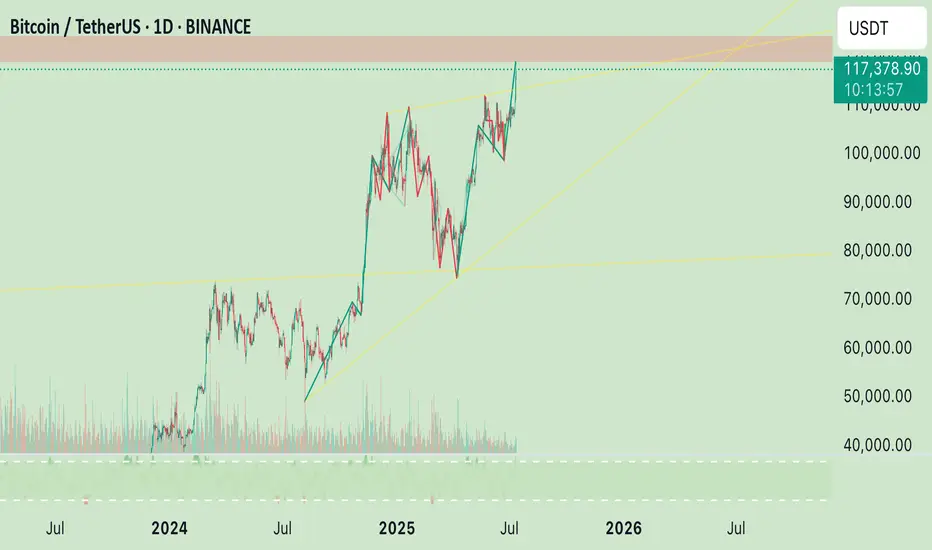
Bitcoin Looks Ready for LiftoffBitcoin is showing a textbook bullish continuation.
After breaking out of a long-term downtrend line, CRYPTOCAP:BTC came back for a clean retest — just like it did during the last breakout phase. That previous breakout led to a massive rally, and now we're seeing a very similar setup again.
The retest around $94K held perfectly, confirming strong demand and validating the breakout. Since then, price has pushed higher with momentum, now trading above $117K.
If this pattern continues to play out like before, Bitcoin could be eyeing $130K and beyond in the coming weeks.
The structure is strong, the trend is intact, and bulls are clearly in control.
Bitcoin’s Final Wave & Time Reversal Zone _ New ATH Loading?Today, I want to analyze Bitcoin ( BINANCE:BTCUSDT ) on the weekly time frame and answer these questions :
Can Bitcoin create a new All-time High(ATH) or not!?
At what price range can Bitcoin's uptrend end!?
When can we expect the uptrend to end!?
Please stay with me.
Bitcoin appears to have managed to break the Resistance lines , although we saw a fake break a few months ago , and it also appears to have a Hammer Candlestick Pattern in the previous weekly candle , which could signal the completion of Bitcoin's pullback to the Resistance lines(broken).
In terms of time , if we want to analyze the Bitcoin chart and look at Bitcoin's past, in general, the months of June(Average=-0.13%/Median=+2.20%) and especially July(Average=+7.56%/Median=+8.90%) have been among the most productive months for Bitcoin , and the months of August(Average=+1.75%/Median=-8.04%) and September(Average=-3.77%/Median=-4.35%) were the months when Bitcoin had a correction . Technical analysis tools show the end of the upward trend and the beginning of Bitcoin's correction at the Time Reversal Zone(TRZ=June 23 to August 4) .
In terms of Elliott Wave theory , Bitcoin appears to be completing the main wave 5 , as the main wave 3 was extended .
I expect Bitcoin to trend higher(+10%) in the coming weeks and create a new ATH . New ATH could be created in the Potential Reversal Zone(PRZ) and TRZ , and then we can wait for the start of the main correction .
What do you think about Bitcoin’s future movement? Can Bitcoin create a new ATH? When and at what price?
Note: If Bitcoin falls below $100,000, we should expect further declines.
Please respect each other's ideas and express them politely if you agree or disagree.
Bitcoin Analyze (BTCUSDT), weekly time frame.
Be sure to follow the updated ideas.
Do not forget to put a Stop loss for your positions (For every position you want to open).
Please follow your strategy and updates; this is just my Idea, and I will gladly see your ideas in this post.
Please do not forget the ✅' like '✅ button 🙏😊 & Share it with your friends; thanks, and Trade safe.

BTC AI Prediction Dashboard - 6h Price Path
BTCUSDT Forecast:
Crypticorn AI Prediction Dashboard Projects 6h Price Path (Forward-Only)
Forecast timestamp: ~13:45 UTC
Timeframe: 15m
Prediction horizon: 6 hours
Model output:
Central estimate (blue line): ~118,370
40% confidence band (light blue): 117,719 – 118,563
80% confidence band (dark blue): 117,040 – 119,652
Volume on signal bar: 331.4
Observations:
Price currently near central estimate, within 40% band
Continuation likely as long as price remains within 80% band
Moves outside 80% = low-probability fade or potential breakout
Model does not repaint. Forecast is fixed once published.

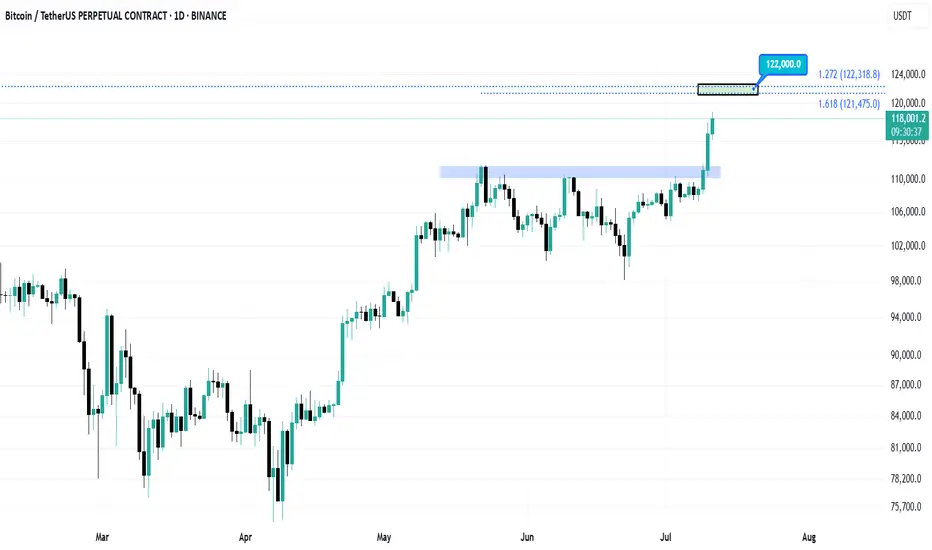
BitcoinThe next target for Bitcoin is $122,000.
I will update the chart when this target is reached.
Follow so you don't miss the next analysis.
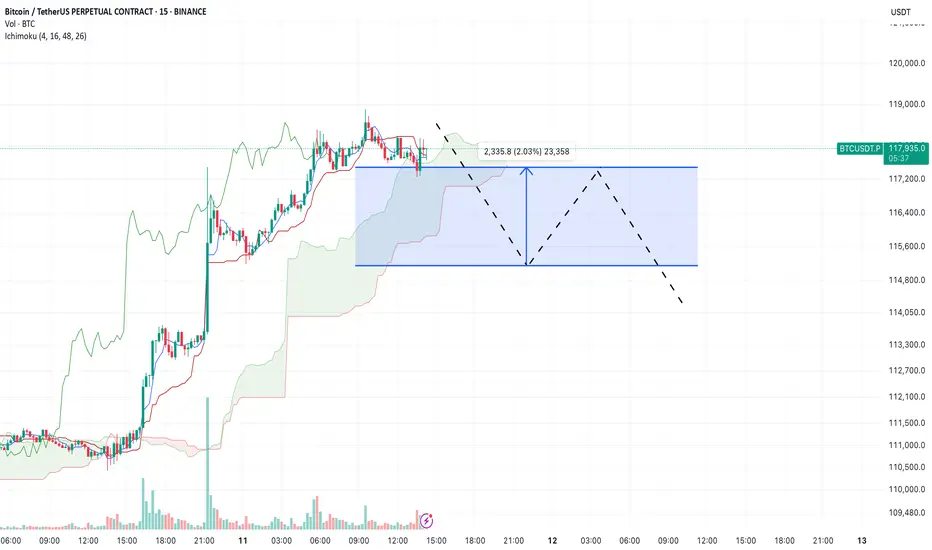
BTC/USDT – Intraday Reflection & Plan (15m, Ichimoku) by RiscoraYesterday was a fantastic bullish day, but price never reached my planned long entry block — buyers were too strong for a proper retest.
At this stage, I believe the bullish impulse has run its course and we’re likely to see a sideways phase, as marked on my chart. I don’t expect new highs from here: the market is overcrowded with longs, and this rally needs to cool off.
My base case is that BTC consolidates in this range for a while, with price chopping back and forth to unwind the excess leverage.
I’ll be watching for signs of distribution: a rising wedge or a deeper pullback can’t be ruled out, but I’ll wait for clear signals from indicators and market positioning (especially long/short ratios).
For now, I plan to range trade this zone, but shorts are very risky — that’s a strong countertrend play. If you must short, use minimal size, because the uptrend is still powerful and I could be wrong.
Let’s watch how the structure develops.
#BTC #Crypto #Trading #Ichimoku #Riscora
TradeCityPro | Bitcoin Daily Analysis #125👋 Welcome to TradeCity Pro!
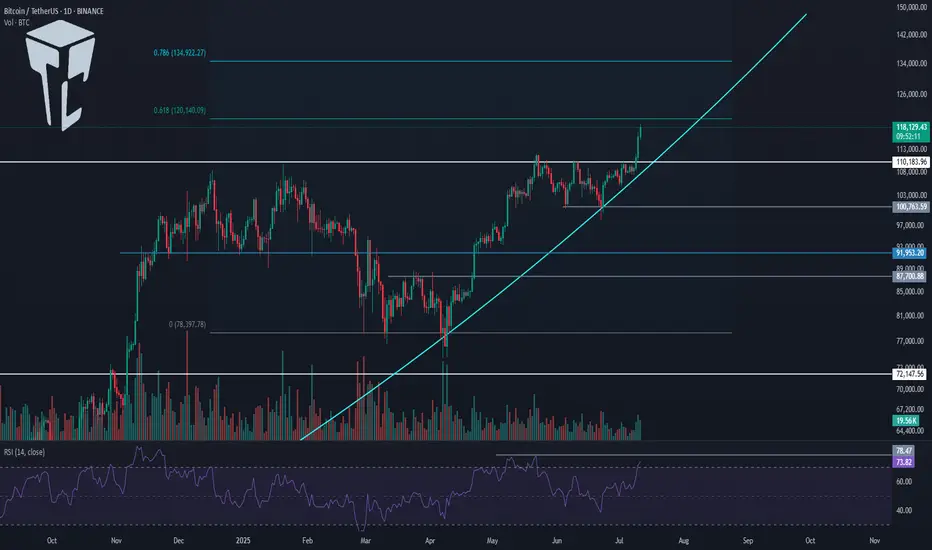
In this Bitcoin analysis, I want to switch to a higher timeframe and analyze the daily chart because a very significant resistance has been broken and it’s important to take a closer look.
📅 Daily Timeframe
On the daily chart, as you can see, a bullish trend started around the 80000 level and in the first leg moved up to 110183. After a prolonged correction, the price has now managed to break that previous high and begin a new bullish leg.
⚡️ As shown, volume was sharply decreasing during the correction phase, but in the past few candles, significant buying volume has entered the market, enabling the price to break above 110183.
💥 The RSI oscillator is entering the Overbuy zone in today’s candle, which could be a sign of continuation of this bullish move. The next RSI resistance is around 78.47.
🎲 Meanwhile, based on Fibonacci levels, 120140 and 134922 are key zones that could mark the end of this bullish leg. The price is currently very close to 120140, and we need to watch for the market's reaction to this level.
✅ If 120140 is broken, Bitcoin will likely head toward 134922. In that case, I believe this leg could be the final bullish leg of this bull run, since I’ve previously mentioned that my target range for Bitcoin in this cycle is between 130000 and 180000.
📊 The curved trendline I’ve drawn is very important in this leg. As long as the price remains above this trendline, the market momentum will stay bullish, and the likelihood of continued upward movement increases.
🔽 If this trendline is broken, we could see the first signal of a trend reversal. A close below 110183 would confirm that the breakout was fake, and a break below 100763 would open the door for a longer-term short position.
❌ Disclaimer ❌
Trading futures is highly risky and dangerous. If you're not an expert, these triggers may not be suitable for you. You should first learn risk and capital management. You can also use the educational content from this channel.
Finally, these triggers reflect my personal opinions on price action, and the market may move completely against this analysis. So, do your own research before opening any position.
BITCOIN =140-150kThe X-wave has formed in the form of a neutral triangle pattern, and eventually Bitcoin could once again touch $106,000 and move towards $140,000-150,000 with the completion of wave-e.
Good luck
NEoWave Chart

Historical Top?It wasn't triangle. Just one of the bull trap.
But how about this ath?
I think this is trap, too.
2021 April~December movement.
Do you remember at that time?
If you do, you won't open a short postion.
Finale makes incredible Alt BullRun, always.
This month is the most important for checking annual trend.
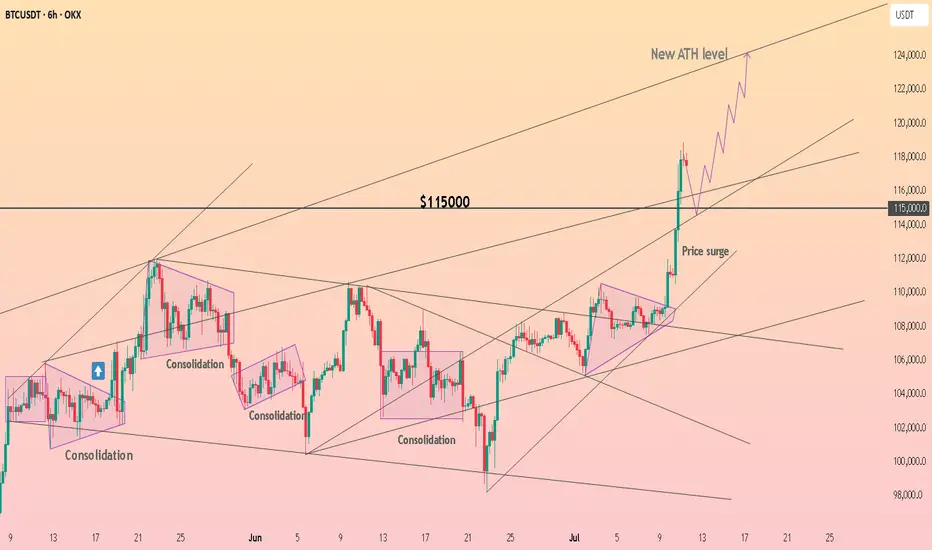
HolderStat┆BTCUSD above the $115kOKX:BTCUSDT broke out of its consolidation structure and surged past $115,000 resistance. The price is showing parabolic behavior as it targets the ATH level near $125,000. Structure remains bullish as long as the support base near $113,000 holds.
BITCOIN ABOUT TO CRASH HARD!!!!? (Be careful with your longs)I am sharing with you in this video the next CRYPTOCAP:BTC important resistances and support levels.
Together with the confirmations, it is said that if triggered, Bitcoin will start crashing hard, so be careful if you have overleveraged long positions opened right now!
Remember to always trade only with professional trading strategies and tactics, and make sure that your money management is tight!

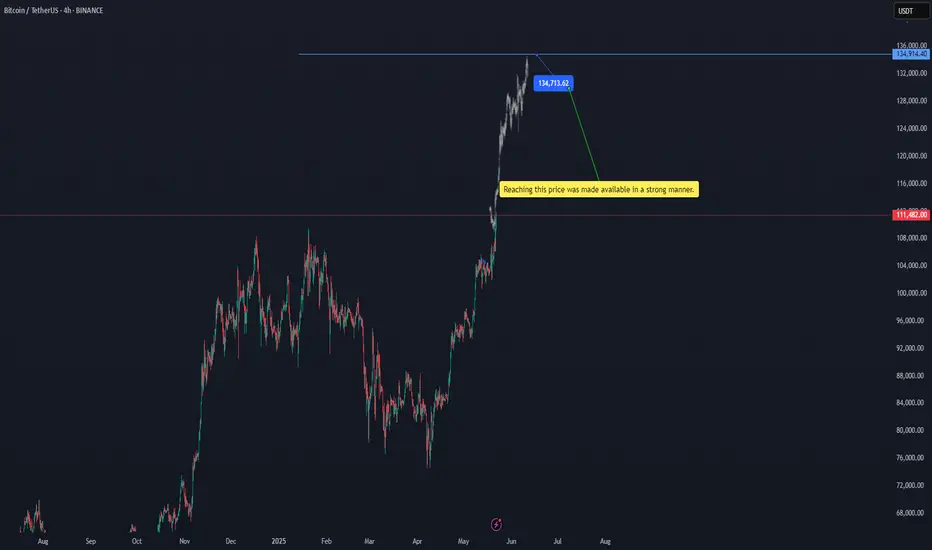
btcusdtReaching this price was made available in a strong manner. 134713.16$ BINANCE:BTCUSDT
Of course, there is a possibility of a temporary correction at the current price, but the target is $134,713.
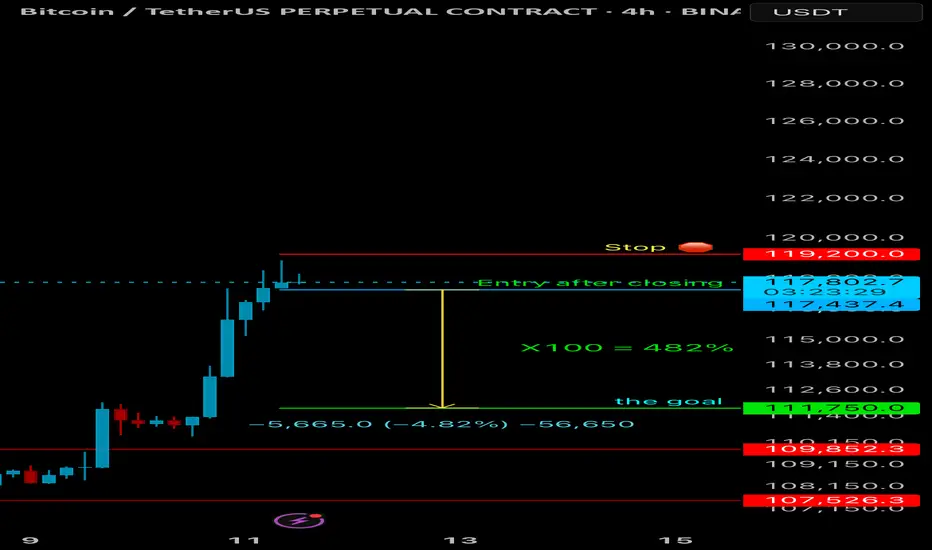
#btc
BTCQuick trade. I hope everyone manages their risk and enters after the close. 4-hour time frame. Leverage from 10 to 100.