BTC USDT ANALYSESBitcoin (BTC) is currently forming an ascending triangle, which is typically a bullish continuation pattern. If BTC breaks out of the triangle to the upside, my target would be around $130,000.
However, we also have a long-term ascending trendline that BTC has been respecting for a significant period. If BTC fails to break out of the ascending triangle, we may see a pullback toward this trendline. Notably, there is also a strong demand zone in that area, which could act as support.
On the weekly timeframe, there is a visible regular bearish divergence—a bearish signal that suggests a potential slowdown or correction. If the divergence plays out, a realistic downside target could be around $100,000 to $98,000.
BTCUSDT.3L trade ideas

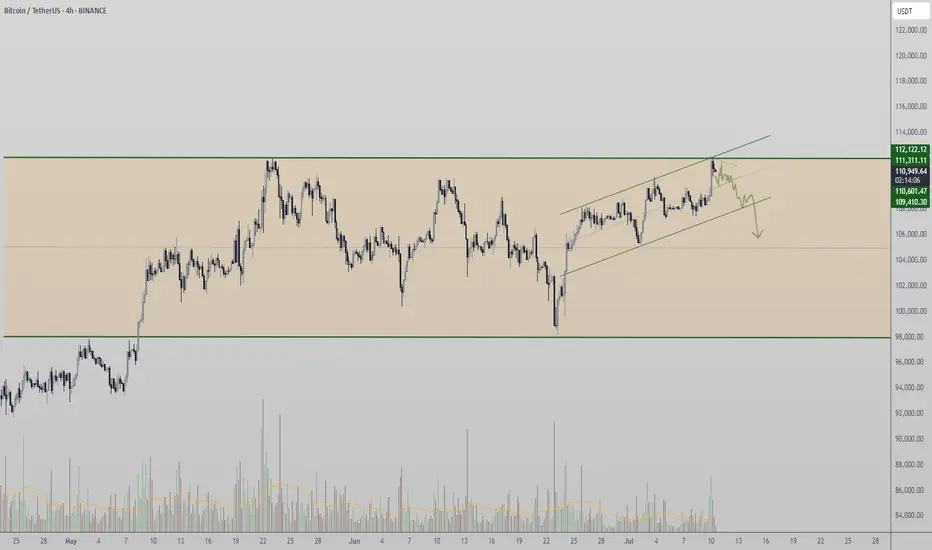
#BTC Rising Wedge📊#BTC Rising Wedge📉
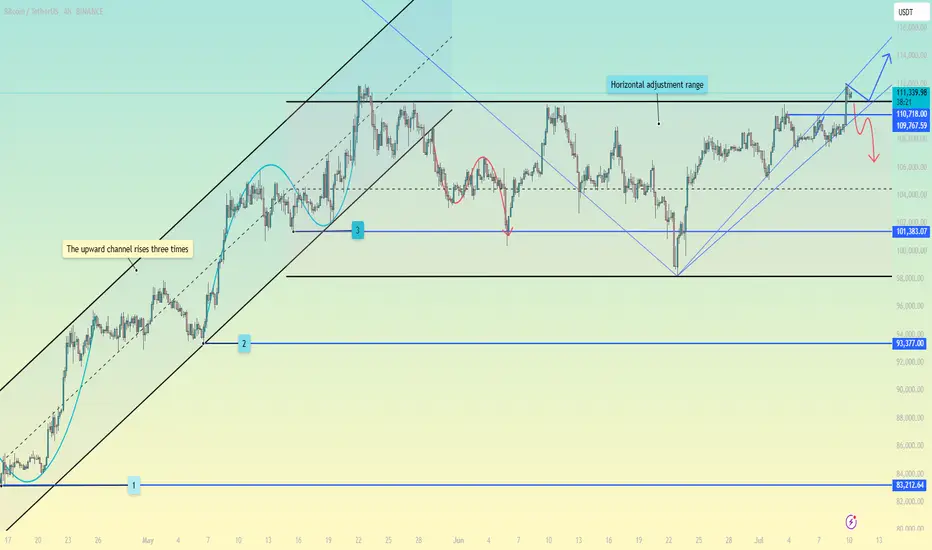
🧠From a structural point of view, we are trading sideways above the support-resistance conversion zone, and the bullish force is gradually weakening. Only if we break through the blue turning point 109669, will new bullish expectations appear, otherwise we need to be alert to the correction at the daily level.
➡️From a graphical point of view, a rising wedge is formed here, and we usually fall according to this model. At present, it has fallen below the lower edge of the wedge and rebounded to the lower edge and was blocked. I expect a further decline.
Let's see👀
🤜If you like my analysis, please like💖 and share💬 BITGET:BTCUSDT.P

HolderStat┆BTCUSD fixed above the triangleBINANCE:BTCUSDT is rebounding from a consolidation base at $106,000 with strong bullish structure. The triangle breakout and recent higher lows point toward a move to $115,000–$120,000 if momentum continues.

Bitcoin to revisit $100k | Summer price target = $120kGeopolitical tension is causing fear in the markets. Today, Bitcoin fell from $107.7k to current price $105k with no sign of buyer support whatsoever, printing 11 consecutive H1 red candles intraday. Like a hot knife through butter.
At $105k, there is very little support. Sell volume absolutely overshadowed the tiny buy volume. Bulls have yet to close a green candle. I believe in the next few hours Bitcoin will be trading at $104k, followed by the first stop $102k.
$102k can serve as an entry point, depending on how price reacts. $100k is the optimal entry point for maximum profit, after mass liquidations. Retail traders are confident that the liquidity hunt is over after the initial tap, placing stops and liquidation levels at $100k.
Invalidation level will be beyond the 200SMA. The 200SMA have historically proven itself time and time again as a safe zone during rallies after golden crosses.

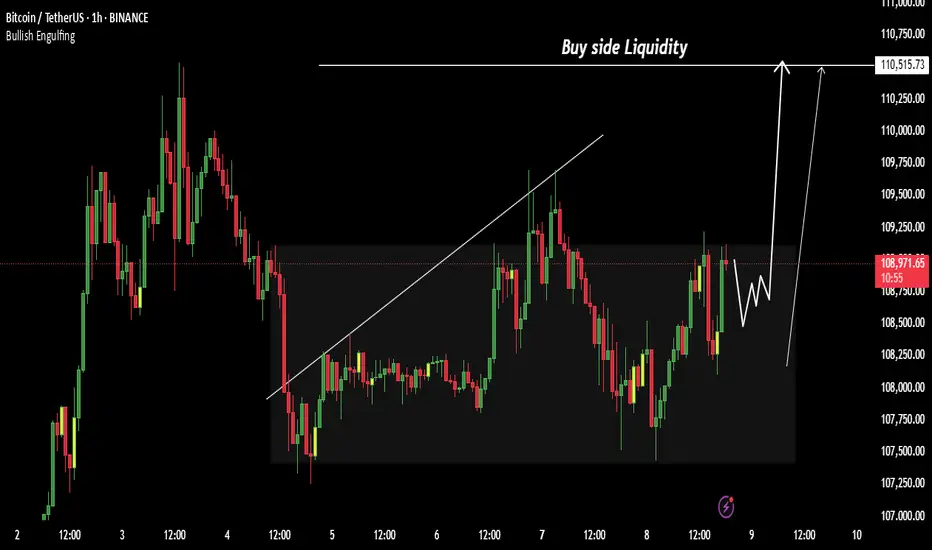
Bitcoin turns bullish again | Price target = $140k++After 2 months of consolidating within a descending channel, Bitcoin has finally broken out, confirming a major technical breakout and shifting the structure back to bullish. The breakout was followed by a clean retest of the channel resistance turned support, which is now acting as a launchpad for the next leg up.
🧠 Technical Analysis:
Descending Channel Breakout: Price has convincingly broken out of the downward sloping channel, invalidating the bearish structure and flipping it bullish.
Retest Confirmation: The price is currently retesting the upper boundary of the channel — a textbook bullish retest. This confirms buyer strength and shakes out weak hands.
Liquidity Magnet Above 111k: A significant cluster of buyside liquidity sits above 111k. Once that level is breached, expect an explosive acceleration toward 120k.
Measured Move Target: Based on the height of the prior impulse (from April to May), the projected extension points to ~140k.
🌍 Macro & Sentiment Drivers:
ETF Flows & Institutional Demand: U.S. Bitcoin Spot ETFs continue to show consistent inflows, signaling strong institutional accumulation — a major shift in long-term demand.
Fed Pivot Speculation: Expectations for a Fed rate cut later in 2025 are building. Lower interest rates could fuel risk-on sentiment, pushing capital back into crypto.
Big Beautiful Bill: This bill is expected to inject money into the economy, increasing liquidity — ultimately going into crypto. This bill will be signed into law today.
Bullish crypto developments: Settlement of the XRP SEC case, spot crypto ETFs, mainstream crypto adoptions, etc. will all contribute to the bullish sentiment.
🧩 Final Thoughts:
This setup combines strong technical structure, favorable macro tailwinds, and clear liquidity targets. The coming days are critical — if Bitcoin clears 111k cleanly, it could trigger a short squeeze and FOMO-driven rally straight into 120k.

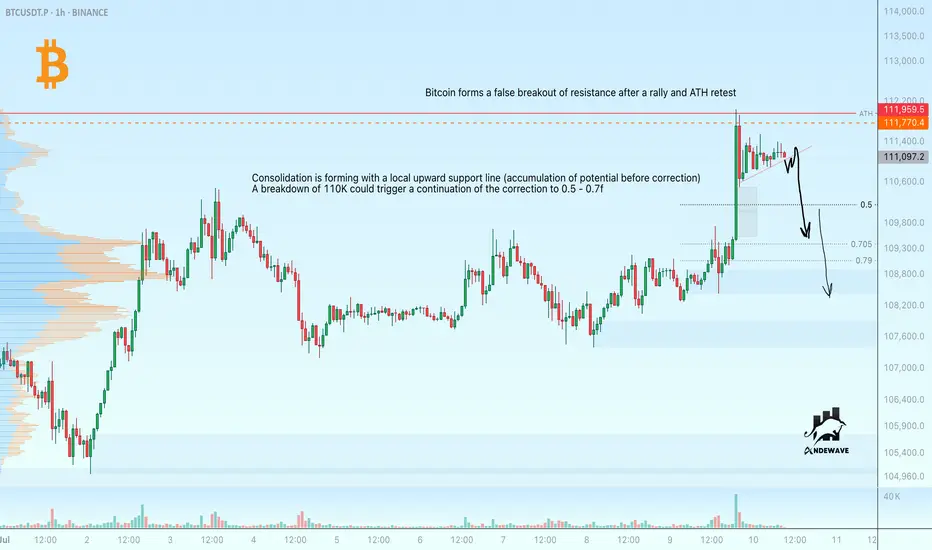
Bitcoin may correct after false ATH breakoutBitcoin is forming a false ATH breakout. There is a possibility of a correction beginning.
Consolidation is forming with a local upward support line (accumulation of potential before correction).
A breakdown of 110K could cause the correction to continue to 0.5 - 0.7f.
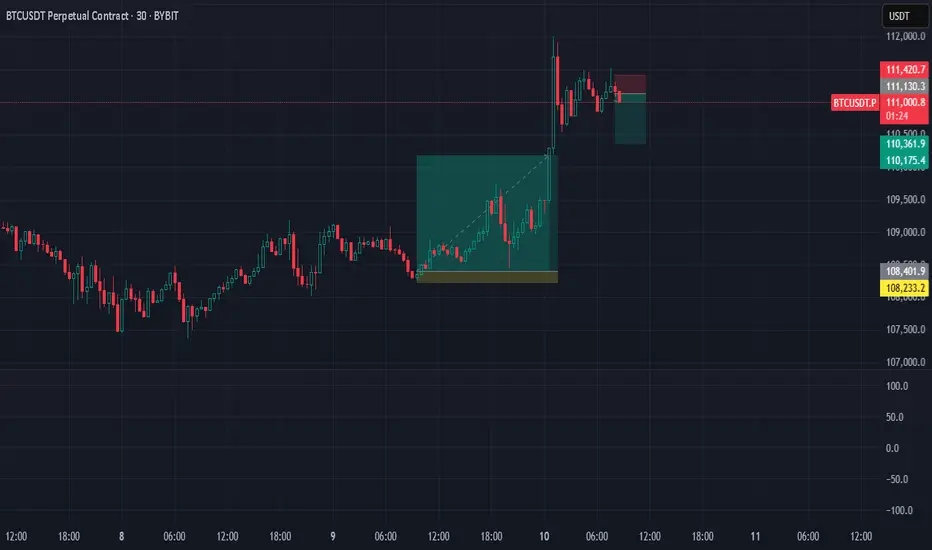
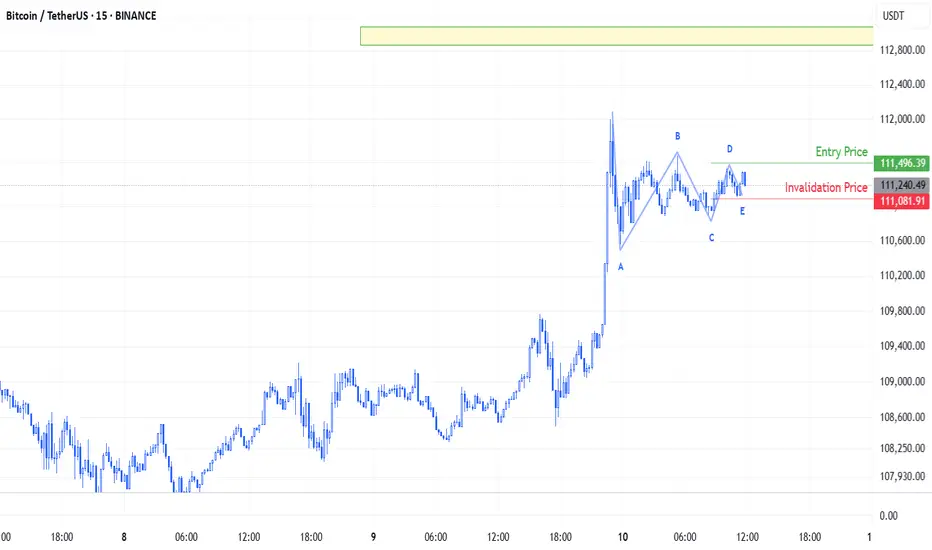
BTC/USDT Elliott Waves A symmetrical triangle has formed on BINANCE:BTCUSDT , most likely as part of Wave 4, following the previous explosive move.
Entry is triggered if the price breaks above Wave D of the triangle, and stop loss is placed just below Wave E.
Cluster analysis suggests that the price will likely reach near the 112,950 level.
BTC Correction's 📉 Significant Bitcoin Correction During Uptrend
After a strong bullish rally, Bitcoin has entered a correction phase, retracing nearly 25% of its recent gains. Interestingly, this correction aligns exactly with the 200-period moving average on the 4-hour chart, marking a potential key support level.
🔍 Is Bitcoin’s Correction Over or Just Beginning?
The overlap with the 200 MA could signal the end of the correction, but if this zone fails to hold, deeper targets between the 35% and 75% retracement levels may come into play.
🛡️ Potential Support Levels for Bitcoin if the Correction Continues:
First support: 102,200 USD – 25% correction
Second support: 93,200 USD – 35% correction
Third support: 84,100 USD – 50% correction
Fourth support: 74,600 USD – 75% correction

Bitcoin Expecting Bullish FormationBitcoin could be triggered by negative news from the U.S. regarding tariffs, which may create market uncertainty and push investors toward risk-off or alternative assets like crypto.
Currently, Bitcoin is reacting to the decline caused by fundamental negative data, but bullish sentiment remains alive as buyers attempt to hold key support zones. The focus now shifts to the psychological resistance near 110K
You may find more details in the chart.
Ps support with like and comments for more better analysis.
BTC/USDT — New Local High, Trendline BrokenBitcoin has officially broken out of a descending trendline and just made a new local ATH, flipping key resistance into support.
Structure:
Descending wedge breakout
Clean move above 111.8K zone
Confirmation pending with retest
Strategy:
Wait for the retest of the breakout zone for ideal entry.
Entry: 110.5K – 111.2K (on confirmation)
Stop Loss: 108.5K
Targets:
113.5K (minor)
116.8K
122.3K
Expected Move: ~10%–12% upside
BTC continues to show strength, and the breakout confirms bullish momentum. This is the Ideal time to watch for long entries on pullbacks.
DYOR | Not financial advice

Bullish on BTC Here is a clean, professional analysis of your BTCUSDT 1D chart:
---
1️⃣ Chart Context
Pair: BTCUSDT.P (Perpetual Futures)
Timeframe: Daily
Current Price: ~111,350
Chart Type: Breakout and projection mapping
Key Levels Marked:
Resistance zone: 134,989 – 140,087
Support trendline (yellow): Ascending from March low
Local horizontal support (yellow): ~104,000 region
---
2️⃣ Structure Analysis
🔹 Trend
BTC is in a strong uptrend with higher highs and higher lows since March 2025.
A breakout from a flag/pennant pattern has recently occurred, signaling continuation.
🔹 Support & Resistance
Current resistance zone (~111,000–113,000): Price is testing this zone.
Major resistance zone (134,989 – 140,087): Strong supply zone for future targets.
Trendline support: Acts as dynamic support, currently near 100,000, rising weekly.
---
3️⃣ Price Action
A clean breakout candle is seen above the consolidation.
Retest of breakout zone possible (~108,000 – 110,000) before continuation.
A measured move aligns with a potential target to 135,000–140,000.
---
4️⃣ Projection Plan
Based on my white projection arrow: ✅ Base scenario: Price breaks above the local consolidation cleanly and heads toward 135,000–140,000. ✅ Retest of the breakout zone may occur to grab liquidity before the push. ✅ If price closes above 113,000 on a daily, momentum confirmation for the run is strong.
5️⃣ Trade Plan (Not Financial Advice)
Entry: On breakout confirmation above 113,000 or retest near 108,000–110,000 with bullish confirmation.
Target: 134,989 and partial close, then 140,087 final target.
Stop Loss: Below local support (yellow line) near 104,000 or trendline depending on risk appetite.
Risk Management: Size positions to risk max 1–2% per trade.
6️⃣ Potential Risks
⚠️ Global macroeconomic conditions or sudden BTC volatility. ⚠️ Fake breakout wicks trapping longs above 113,000. ⚠️ Daily close below 104,000 would invalidate bullish structure in the near term.
Summary
BTCUSDT is in a bullish continuation structure aiming for 135–140K.
Price is currently at a critical breakout level; a clear close above and retest would be optimal.
Manage risks with clear invalidation below 104,000

Bitcoin: New highs are ready to break
In-depth analysis of the Bitcoin market: Breakthrough opportunities under the resonance of fundamentals and technical aspects
I. Overview of the current market situation
As of July 10, 2025, the price of Bitcoin is currently in a high consolidation stage after breaking through $112,000 to set a record high. The highest increase in 24 hours was 3%, and the cumulative increase this year was about 19%, showing a strong upward momentum2. However, market volatility is still significant. The latest data shows that the amount of liquidation in a single day is as high as $510 million, involving more than 100,000 traders2, reminding investors to maintain risk awareness in optimism.
II. Key drivers of fundamentals
1. Improved policy environment
US cryptocurrency regulation is turning to a loose direction. The regulatory roundtable promoted by the new SEC Chairman Paul Atkins is expected to implement new policies in July-August, aiming to define clear regulatory boundaries, reduce law enforcement actions, and promote the United States to become a global crypto asset center2. This policy shift has significantly boosted market confidence and removed some obstacles for institutional funds to enter the market.
2. Institutional funds continue to pour in
The net inflow of spot Bitcoin ETFs in 2025 has reached US$14.4 billion2, indicating that the traditional financial market's acceptance of Bitcoin continues to increase. 135 listed companies such as MicroStrategy have included Bitcoin in their balance sheets2, and corporate-level allocation demand has formed a stable buying support. The recent weaker-than-expected US employment data has strengthened the Fed's expectations of a rate cut in September, further prompting funds to accelerate the inflow of risky assets such as Bitcoin2.
3. Market narrative upgrade
The role of Bitcoin has shifted from "alternative currency" to "reserve asset", and CICC pointed out that its positioning as "digital gold" is widely accepted2. National-level allocation cases are also increasing, such as Pakistan's announcement of the establishment of a strategic Bitcoin reserve2. This narrative shift is reshaping the value assessment framework of Bitcoin.
4. Macroeconomic linkage
The Federal Reserve's monetary policy remains a key variable. Trump's chief adviser recently publicly accused Powell of being the "worst Federal Reserve chairman in history", saying that if interest rates are not cut on July 29, "catastrophic consequences"3 may occur3. At the same time, the US trade policy of imposing a 50% tariff on copper (to be implemented as early as August 1) has exacerbated market uncertainty3. Historical data shows that Bitcoin often performs well in liquidity easing cycles, and the current market's expectations for interest rate cuts are forming potential positives.
III. In-depth analysis of technical aspects
1. Key price structure
After breaking through the horizontal consolidation range, Bitcoin is currently in a high-level accumulation state:
Upper target: The historical high of $112,000 is the recent key psychological resistance, and a new upside space may be opened after breaking through2
Recent support: $110,700 (top and bottom conversion position) constitutes the first line of defense
Trend support: $109,700 (upward trend line) is an important line of defense for bulls
Key defense: There is significant liquidity support in the $108,500 area, and a break below may drop to the $106,000-107,200 support area26
2. Technical indicator signals
Trend indicators: Moving averages of all major time frames (5-day to 200-day) remain in a bullish arrangement, confirming that the overall upward trend remains unchanged4
Momentum indicators: RSI is in the neutral area near 53, not showing overbought; MACD remains positive despite slightly weakened momentum6
Volatility analysis: Bollinger Bands continue to narrow, and EMA on the 4-hour chart converges, which usually indicates that major fluctuations are coming5
Derivatives data: Binance CVD (cumulative volume increment) continues to be negative, indicating that selling pressure exists, but spot buyers successfully defend key support5
3. Main capital movement
The disk shows that $23 million of unfulfilled sell orders are piled up at the $110,000 mark, forming a significant resistance9. At the same time, there is a $17.27 million buy support in the $108,388-108,500 range9, indicating that the long and short sides are fiercely competing in the current area. This large order distribution pattern suggests that the market may test the upper resistance first and then fall back to consolidate.
IV. Operational strategy recommendations
1. Trend trading strategy
Long position layout: Establish long orders in batches in the support area of 110,700-109,700 US dollars, and set the stop loss below 108,500 US dollars
Breakthrough chasing long: If the price stands above 112,000 US dollars, you can add positions, and the target is 114,500 US dollars (potential area for short squeeze)2 and higher
Target setting: Short-term target is 112,000 US dollars, and the medium-term target can be seen to 116,000 US dollars2 or 137,000 US dollars4 according to the volume
2. Reversal trading strategy
Short opportunity: If it falls below $108,500 and then rebounds to $109,700 without breaking, you can try shorting with a light position, and set the stop loss above $110,700
Deep correction: If it falls below the $108,500 support, it may test the $106,000-107,200 area6, and then you can observe the stabilization signal
3. Risk management points
Position control: The risk of a single transaction should be controlled within 2% of the total funds
Leverage use: It is recommended not to exceed 3-5 times leverage in the current high volatility environment
Event sensitive period: Focus on key points such as the Federal Reserve’s interest rate decision on July 29 and the implementation of the tariff policy on August 137
V. Outlook and conclusion
1. Short-term (1-3 months) outlook
Bitcoin is currently in a favorable environment where technical and fundamental resonances occur. If ETF fund inflows continue or the Federal Reserve releases a clear signal of interest rate cuts, the price is expected to test $116,0002. However, we need to be alert that regulatory policies that fail to meet expectations or macroeconomic deterioration may lead to a pullback to the $102,000-105,000 support zone27.
2. Long-term (until 2030) value prospects
Cycle model: According to the peak rule of 550 days after halving, this round of bull market may have a 2-3 month peak window2
Technical target: Long-term rising channel points to $168,500 (Fibonacci extension level)2
Scarcity drive: After the halving in 2030, the supply will further shrink, coupled with the global inflation hedging demand, and the highest is expected to reach $660,4712
3. Summary of investment advice
Bitcoin's breakthrough of $112,000 is the comprehensive result of policy, liquidity and narrative upgrades2. The current technical structure remains bullish, and it is recommended to focus on low-multiple ideas, focusing on the $110,700-109,700 support area. Investors should pay attention to low-friction investment channels such as spot ETFs, avoid high leverage operations, and prepare for potential fluctuations. As the institutionalization process accelerates, Bitcoin is completing the transformation from a marginal asset to a mainstream configuration option. Long-term investors can seize the layout opportunities brought about by every major pullback.
Bitcoin (BTC): New ATH Incoming | Aiming For $120KBitcoin is at ATH, where there is a high chance for a breakout and our next target of $120K to be reached from here.
People have euphoria for the new ATH; the money inflow is huge where whales are and have been stacking the BTC little by little.
Now with the new ATH, we have to remember there is no accurate way to predict potential resistance, so we have to base our bets on zones like $120K and $140K (round numbers).
Those 2 zones are our current targets!
Swallow Academy

#BTC Update #5 – July 10, 2025🟠 #BTC Update #5 – July 10, 2025
Bitcoin is currently trading inside a supply zone and seems to be preparing for a corrective move after its impulsive rally — but the first clear step of that correction has yet to appear. At the same time, USDT Dominance is hovering near a support zone. If it bounces from here, Bitcoin’s pullback could accelerate.
Additionally, BTC has approached a previous resistance level, making it an uncertain area for new entries. At this stage, I don’t find it logical to open either a Long or Short position. Once the correction completes, the first major target is likely the 123,250 zone.
For now, I’m just monitoring. No trade recommendation at this time.

BITCOIN ATH? More to come!With BTC seeing a new ATH, speculations are there for whether it continues in upward projection or falls back.
My prediction is simple, CRYPTOCAP:BTC will do a temporary pullback around the 109,000$ region and goes back up to around 113,000$ within the shortest time.
This temporarily pullback will be a result of buyers who already took their profits. Of course, Institutional investors are even more poised to buying more.
News may impact this projection but investors are willing to see it fly.
Ultimately, you can never go wrong with Bitcoin buy.
#DYOR #NFA
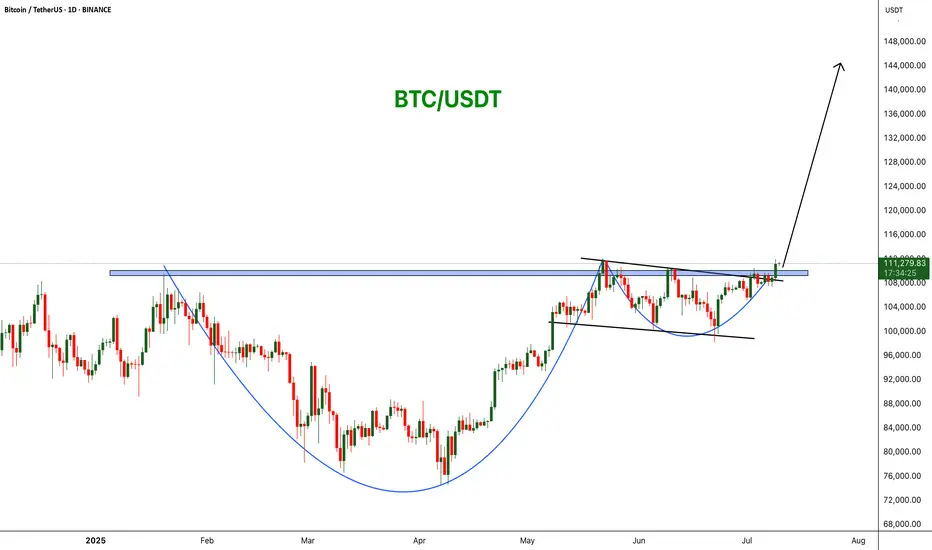
BTCUSDT: Cup and Handle Breakout! BINANCE:BTCUSDT is forming a powerful bullish breakout from a cup and handle pattern on the daily chart. Price has cleared key horizontal resistance around $110,000, signaling strength and the potential for a continuation move toward $144,444.
Stop Loss: $98K
Target : $144k
CRYPTOCAP:BTC
Bitcoin Bullish Flag Breakout Incoming?MARKETSCOM:BITCOIN is currently consolidating within a bullish flag pattern on the daily chart, following a strong impulse move from the $74,000 support zone marked in April. The price is hovering near a critical horizontal resistance zone ($ 108,000–$ 109,000), which has historically acted as a major barrier to further gains.
Technical Highlights:
Bullish Flag Pattern: Clear flag formation after a strong uptrend, suggesting continuation potential.
Strong Support Rebound: April's bounce from the ~$74K support zone marked a key higher low.
EMA: Price is currently trading above both the 50-day and 100-day EMAs — a bullish sign of momentum.
Breakout Potential: A confirmed breakout above the flag resistance (~$109K) could ignite a strong rally toward $130K+.
Breakout Move: If the flag pattern plays out, CRYPTOCAP:BTC could target the $125K–$135K zone in the coming weeks.
Buy Entry: Once the day candle closes above the flag resistance line

Bitcoin Tests Range High — Breakout or Rotation lower?Bitcoin is currently trading at a critical resistance level — the previous all-time high — which also marks the upper boundary of its multi-month high time frame range. While many are watching for a breakout, price action suggests that a continuation of range-bound behavior is still the more likely scenario. Without decisive volume or structural confirmation above this resistance, BTC may be gearing up for another rotation toward lower support.
Key Technical Points:
- Key Resistance at ATH: Bitcoin is retesting its prior all-time high, which is the current range high
- Volume Remains Weak: Lack of breakout volume signals indecision and caution
- Liquidity Now Resting Below: Upside liquidity has been cleared; downside offers more incentive for market makers
Bitcoin’s price has once again returned to the range high, aligned with its previous all-time high — a level that has consistently capped price over recent months. This area has acted as a significant inflection point where momentum has historically slowed, and price has failed to push through with conviction.
Currently, price action is showing signs of stalling, and importantly, there has been no influx of volume to suggest a true breakout is underway. When volume fails to accompany a test of resistance, it often signals weakening demand or exhaustion from buyers — increasing the risk of a false breakout or rejection.
Additionally, the upside liquidity has already been taken, meaning there’s now less incentive for large players to push price higher in the immediate short term. In contrast, resting liquidity lies beneath current levels, offering greater appeal for a downward move — particularly for market makers seeking efficiency and liquidity capture.
From a technical perspective, Bitcoin remains range-bound until a decisive breakout above the highs occurs with supporting volume and strong candle closures. As of now, this has not happened, keeping the likelihood of a rotation lower well on the table. Should price begin to trade down, watch for a move toward the mid-range or even the lower boundary of the range, depending on how momentum unfolds.
Unless Bitcoin breaks above its all-time high resistance with strong volume, expect the range structure to hold. A lack of bullish follow-through may lead to a rotation toward lower support levels.
#BTCUSDTbearish side of the btc is slow, as the volume of sell is not that high...…any strategy doesn't fit the lower low, i am seeing btc to the 132k.
anyone overthere with a new different strategy regarding btc?

BTC ALL SET FOR MAJOR HIGHS The price has tested the resistance line multiple times showing strong supply/resistance. Buyers are gradually pushing price higher (higher lows), but momentum is weakening near resistance.
This is a sign of consolidation under resistance pattern before breakout .Rising wedge typically breaks down signaling a potential drop, it confirms weakening momentum.
Area to Watch for Entry
103000-104000 (recent demand zone) for Bullish
After daily candle closes above 113000 instant bullish Entry.

DeGRAM | BTCUSD once again trading above $105k📊 Technical Analysis
● Fresh bounce off the confluence of the 8-month up-sloping purple trend-line and 102-103 k green demand box prints a higher-low inside the rising wedge, keeping bulls in control despite June’s pull-back.
● Price is reclaiming the minor down-trend line from the 12 Jun high; a daily close above 106 k confirms a bear-trap and unlocks the 111.8-112.5 k supply at the wedge cap.
💡 Fundamental Analysis
● Spot-ETF desks absorbed >5 400 BTC in the last three sessions while exchange reserves fell to a four-year low, signalling supply drain.
● Cooling US PCE expectations trimmed real yields, and Mt Gox repayment delays ease overhang fears—both supportive for risk assets.
✨ Summary
Long 102–104 k; hold above 106 k targets 111.8 k → 115 k. Bull thesis void on a 16 h close below 99 k.
-------------------
Share your opinion in the comments and support the idea with a like. Thanks for your support!