The Whale’s Blueprint: Read It Before It Happens🧠 The Real Game
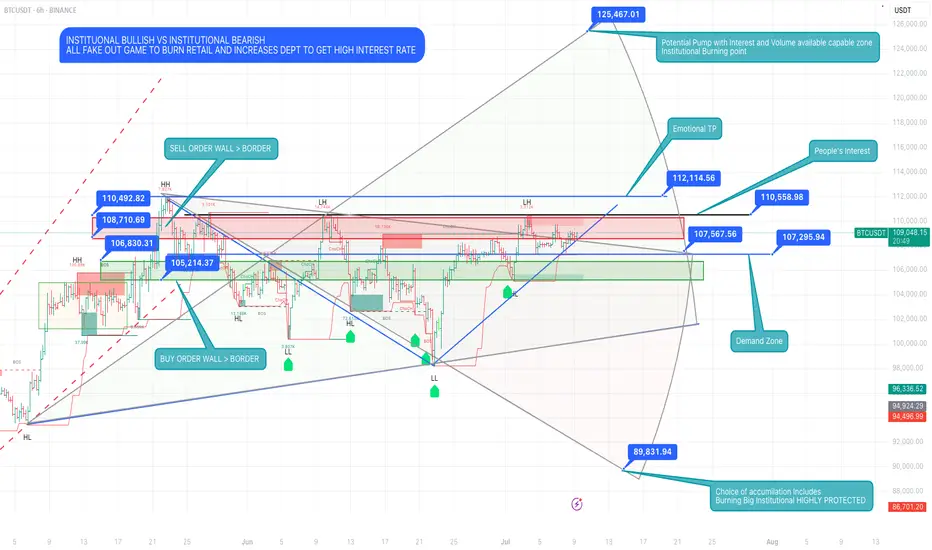
Institutional Bullish vs Institutional Bearish — It Was Never About Direction.
This chart isn’t about setups.
It’s a blueprint of manipulation, a battlefield map where:
• Retail gets trapped at emotional highs
• Liquidity gets swept in layers
• Institutions reload in silence
• And the price becomes the puppet, not the player
🔺 Top Red Zones (106K–112K):
These aren’t resistance. They’re execution zones for sell walls, fake breakouts, and late long liquidations.
🔻 Green Demand Zones (105K & Below):
Not support. They’re reaction chambers — where whales absorb panic and retail exits in fear.
💥 125K is not a fantasy. It’s a controlled explosion waiting to happen —
But only if the trap is set right and the fuel (volume + interest) loads in.
🧱 Real accumulation doesn’t happen in comfort.
It happens in the shadows, at the edges of fear.
This isn’t price action.
This is power action.
⸻
“Most trade the surface.
Snipers wait beneath it…
and strike before the story reveals itself.”
#BTCUSDT #LiquidityGame #WhaleTrap #InstitutionalZones #SniperMindset #KaizenMethod #TheRealGame
BTCUSDT.3L trade ideas
There’s a higher probability of an upward breakout.🚨 Bitcoin Technical Update – Key Levels Ahead! 🚨
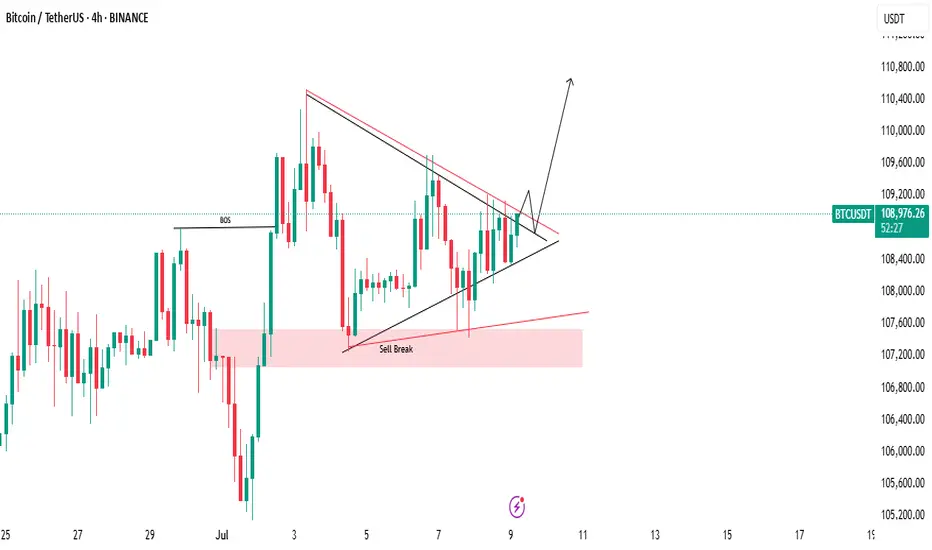
Bitcoin is currently forming a symmetrical triangle pattern, a classic setup that often signals a strong move ahead. At the moment, the market is leaning toward the upside, showing early signs of bullish momentum.
📈 If we see a breakout to the upside, it's crucial to wait for a retest of the breakout level. A successful retest could confirm the move, setting the stage for a strong upward rally. However, if the breakout fails, don’t rush in — just observe the price action closely to see how the market reacts.
⚖️ There’s a higher probability of an upward breakout, as liquidity is still building above, and there are strong support levels holding below. This combination could act as a springboard for price to move higher.
🔍 As always, Do Your Own Research (DYOR) before entering any trade. Stay alert and manage your risk wisely!
Bitcoin (BTC): Buyers Are Building Up The Volume | Be ReadyBuyers are still holding strong where price is not showing any signs of weakness. With that being said, we are seeing the volume gathering near the current zone, which might result in a breakout and a strong upwards movement.
A new ATH is coming; this has been seen already once on the BTC, so it is just a repeat of history.
Swallow Academy

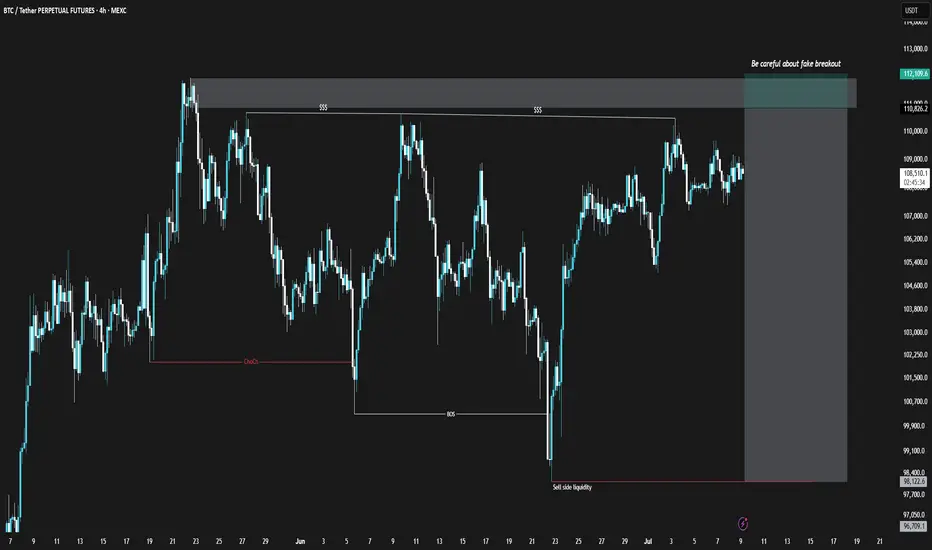
BTCUSDT Short Position (25/Jul/9)Bitcoin, similar to the TOTAL chart, is showing weakness in its bullish momentum. However, unlike TOTAL, the divergence in Bitcoin is clearly noticeable. Additionally, within the marked zone on the Bitcoin chart, there is a possibility of a fake breakout and liquidity grab. I suggest entering only with proper confirmation.
⚠️ This Analysis will be updated ...
👤 Sadegh Ahmadi: GPTradersHub
📅 2025.Jul.9
⚠️(DYOR)
❤️ If you apperciate my work , Please like and comment , It Keeps me motivated to do better
Bitcoin Formed Next level Formation #bitcoinHello trader's
Here is something special formation in Bitcoin chart...
Now. You know which side is breaking....
If don't comment


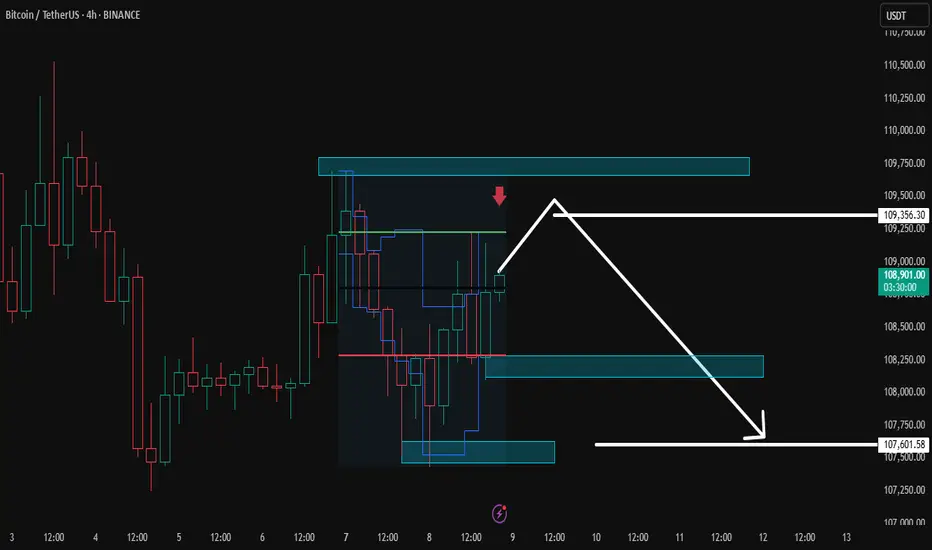
Bitcoin Market Outlook📈 Bitcoin Market Outlook
We're seeing lower highs forming on the chart, which suggests a possible short-term bearish trend.
🔹 I'm watching $109,953 for a long position — if price breaks above that level, I’ll consider entering with a stop-buy using the exchange's order book.
🔹 For a short position, the current trigger is $107,344, but keep in mind this level may change — I’ll update if needed.
🚨 If you’re shorting, use a tight stop-loss and take profits quickly.
In this kind of market, risk and money management are everything.
💬 Let me know what you think in the comments — always happy to hear your take!

BTC - Drooling for 110K!So my acc was banned for a day and Im soo back! So i feel if it stays sideways for the orange line what we want, looks really good to take 110k to 110,202! breaks below orange line goes to red, stances - GETS CHANGED!

Bullish on $BTC🧠 Wyckoff Overview
🔻 This chart follows Accumulation Schematic #1 in Wyckoff theory.
🔻 The Spring phase (Phase C) is confirmed.
🔻 BTC has broken out from the accumulation zone.
🔻 We are now in Phase D, expecting a move into Phase E (new ATH).
📊 Technical Details
🔻 Accumulation zone: Around $72,000 – $88,000.
🔻 Spring (Phase C): A fakeout happened near $68,000, matching Wyckoff structure.
🔻 Breakout is confirmed after price moved above the downtrend line and Ichimoku cloud.
🔻 Main resistance: $95,000 – currently testing the supply zone.
🔻 Target: If breakout continues, BTC could reach a new ATH above $110,000.
📈 RSI and Volume
🔻 RSI at 66.71: Not overbought yet, still has room to go up.
🔻 Volume is increasing along with the breakout → shows strong buying pressure.
🎯 Personal Prediction
🔻 If BTC holds above $92,000 – $95,000 and continues to consolidate:
→ Short-term goal: $100,000
→ Mid-term goal (Wyckoff Phase E): $110,000 – $112,000

BTC/USDT Chart Analysis (4H)Patterns and Structure:
Bitcoin remains inside a larger converging structure (symmetrical triangle/wedge) visible from the diagonal trendline.
The price has recently broken above the descending resistance trendline but is hovering near the red resistance area (~$109,000–$110,000).
Ichimoku Cloud:
The price is currently above the Ichimoku Cloud, which acts as support (~$107,000–$108,000 area).
The cloud below the price is green, indicating bullish momentum.
Key Areas:
Resistance Area: $109,000–$110,000 (red box). Multiple previous rejections from this area.
Support Zone: $106,000–$107,000 (cloud and trendline support).
Key Lower Support: The green box near $98,000–$100,000, in case of a deeper retracement.
Possible Scenario:
As your blue arrow suggests, if Bitcoin consolidates above the breakout level (~$108,000), a rally towards the next major resistance between $112,000–$114,000 is likely.
Conversely, losing the breakout zone could see BTC return to retest lower support levels around $106,000 or $100,000.
Short-term Outlook:
The trend bias remains bullish as long as BTC stays above ~$107,000.
Monitor price reaction to the red resistance zone for breakout confirmation or potential rejection.
Conclusion:
BTC is showing signs of strength, but the $109,000-$110,000 resistance zone is crucial. A confirmed breakout above this zone could accelerate the move towards the $112,000-$114,000 targets.
Stay tuned for updates and key levels to watch!
Thanks for your support!
DYOR. NFA

BTCUSDT – Ready to Launch from Accumulation Zone?BTCUSDT is consolidating around the $101,000 FVG zone – a previously strong launchpad. Price structure remains bullish, forming higher lows and showing a healthy throwback pattern.
If the $101,448 level holds, the next target could be $116,000 – a potential 14% rally in two weeks.
Fundamentals support the upside: expectations of Fed rate cuts and renewed ETF inflows are fueling fresh momentum for Bitcoin.
Still, watch for price action confirmation – and always manage your risk!


Volatility period likely to continue until July 11th
Hello, traders.
Please "Follow" to get the latest information quickly.
Have a nice day today.
-------------------------------------
This volatility period is expected to last until July 11th.
The first volatility period, July 1-7, 3 days passed, and the second volatility period began on July 6.
It is important to explain it in words, but I think it would be better if you could intuitively understand the flow by looking at the chart.
For that reason, I divided the chart into a chart with a trend line drawn and a chart with indicators.
Since the trend line is used as a tool to calculate the volatility period, it is not necessary to show it after the volatility period is displayed.
What we need to look at is the support and resistance points drawn on the 1M, 1W, and 1D charts after the calculated volatility period, or the support in the indicator to find the trading point.
-
It seems that support is being checked around 108316.90, which is the HA-High indicator point of the 1D chart.
Therefore, we need to see if it can rise after receiving support near 108316.90 during this volatility period.
If not, it will eventually show a downward trend.
As a basic trading strategy, we use buying near the HA-Low indicator and selling near the HA-High indicator.
Therefore, considering the current price position, it can be said that it is a section where we should sell to make a profit.
However, since the HA-Low and HA-High indicators are intermediate values, if it falls from the HA-Low indicator, it is possible to show a stepwise downward trend, and if it rises from the HA-High indicator, it is possible to show a stepwise upward trend.
Therefore, we need to respond with a split transaction.
Conditions for continuing the uptrend include:
1. When OBV is above the High Line and shows an upward trend,
2. When PVT-MACD oscillator is above the High Line,
3. When StochRSI is above K > D, showing an upward trend,
If the above conditions are met, there is a high possibility that the uptrend will continue.
-
If it falls below the M-Signal indicator on the 1D chart, it is highly likely that it will select the trend again when it meets the M-Signal indicator on the 1W chart.
At this time, whether there is support near 99705.62 is important.
If it rises, you should check whether it is supported near 111696.21.
If it is not supported, it means that it has not broken through the high point section, so you should prepare for a decline.
The high point boundary section is the 108316.90-111696.21 section.
Therefore, if the price is maintained within this section, there is a possibility that it will continue to attempt to break through upward.
-
Thank you for reading to the end.
I hope you have a successful trade.
--------------------------------------------------
- Here is an explanation of the big picture.
(3-year bull market, 1-year bear market pattern)
I will explain more details when the bear market starts.
------------------------------------------------------

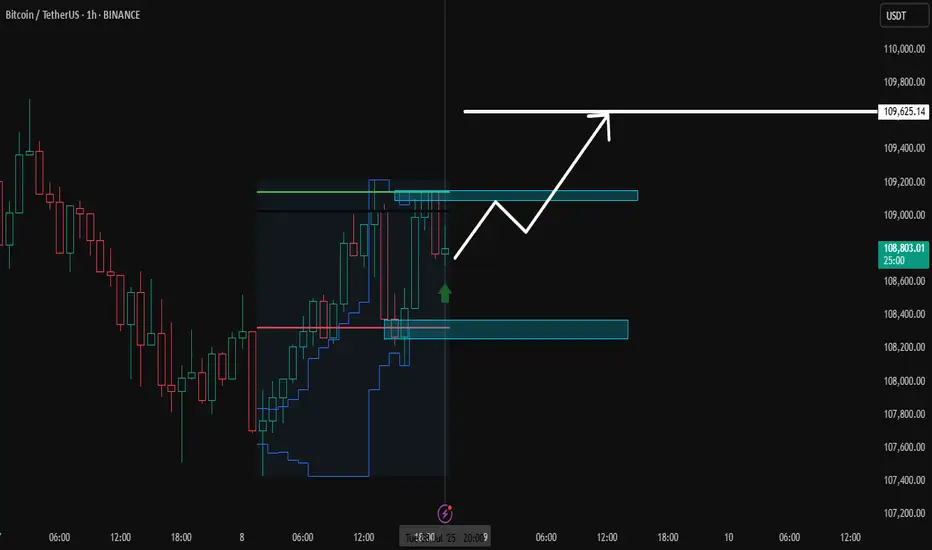
bitcoin in 1hour timeframeIn line with the previous analysis, the likely path for Bitcoin on the one-hour timeframe looks like this...follow for more...
bitcoin targets...Based on the patterns and price movements in Bitcoin, I have identified possible targets in the image.
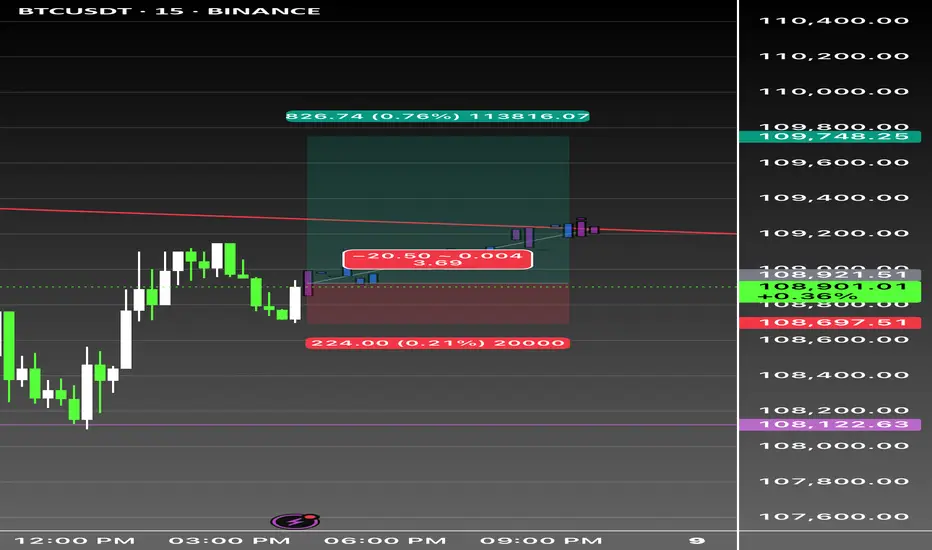
BTC Long scalp tight stop 📈 BTCUSDT 15min | Long Trigger Alert
Caught a breakout move 🔥
✅ Entry: 108,697
🎯 Target: 109,748 (+0.76%)
🛑 Stop: 108,473 (Tight 0.21% risk)
🔗 RRR: 3.69
Triggered after reclaim and retest near trendline resistance — flipped into support. Consolidation candles printed bullish structure above EMA. Watching for continuation 🚀
🎯 High confluence setup
💪 Clean structure
🔍 15m momentum shift confirmed
Leverage: 20x+ scalp friendly, manage tight.
Confidence: 8/10
#BTC #CryptoTrading #BTCUSDT #LeverageTrading #ScalpSetup
BTC accumulates momentum again in the range
Macroeconomic and policy impact
Trump tariff policy: The United States announced that it would impose 25%-40% tariffs on Japan, South Korea and other countries (effective on August 1), triggering market risk aversion, and Bitcoin once fell to the support level of $107,5004.
Federal Reserve policy: The market is concerned about the possibility of a rate cut in July. If the Fed turns dovish, it may boost the price of Bitcoin by 17.
Musk and Trump conflict: The public dispute between the two sides over the "Big and Beautiful Act" caused short-term fluctuations in the crypto market, with DOGE leading the decline and BTC once under pressure by 2.
Bitcoin is currently in the key liquidity-intensive area of 105,000-108,800 US dollars, and the long and short sides are fiercely competing here:
Above $108,800: A large number of short stop-loss orders are gathered, and a breakthrough may trigger a chain of short liquidations, pushing the price towards $113,000-130,000.
Below $107,100: There are dense long leveraged positions. A break below this level may trigger forced liquidation of long positions, causing the price to fall back to the $92,000-$95,000 support zone 1.
Technical aspects and market structure
Breakout-retracement mode: If the weekly close stabilizes at $107,720, the upward trend may be confirmed, with the target pointing to $110,000-$130,000. The historical analogy of the "step-up" structure in Q4 2024 indicates that the bull market may continue.
Short-term resistance and support:
Resistance level: $108,500 (if it breaks through, it may test $110,000).
Support level: $107,500 (if it breaks below, it may drop to $106,500)410.
Bitcoin has recently fluctuated between $106,000 and $110,000, with ETF inflows and long-term holders selling forming a seesaw 57.
Summary
Bitcoin is currently in a critical game range. The short-term trend may be determined by the liquidation trigger point (107,100-108,800 US dollars), and is also affected by macro policies (tariffs, the Federal Reserve) and institutional capital flows. The medium- and long-term bullish expectations are strong, but attention should be paid to high leverage risks and changes in market sentiment.
BTC , 4hr , BearishBTC is Forming a Pattern and it is at the top of the Another Pattern and It is facing rejection 3 Times from Above and now it is forming another pattern inside and Ready for Break Down of the Pattern , if it breaks the Pattern Down then it will be bearish almost 90% it will move to down side , if it has not given Breakdown and moving inside the small pattern then wait patiently and observe carefully .
Then it may also give Breakout for up side .
Follow Risk Management Properly
Follow for More Swing Ideas Like this .

Bitcoin is bullish in world of War or Peace Simple and easy it is like Gold but better version and limited edition one.
Both(BTC & XAU) are bullish most of the time because future is not for Paper Tokens like Dollar or Yuan or Ruble or Euro or ..
Currency of strong countries seems interesting But soon with more laws and Taxes and Rules against each other Economic which USA start it, more and more Trades and things are going to take place in Crypto where the money is still non Trackable or it is tax free.
Also in a world of War as i mentioned in previous Analysis too, more Buys and Sells are going to take place via Crypto instead of countries currency.
Some countries Now are buying and selling weapons from their enemies even and it is possible in Crypto which no one judge or find the transactions.
interesting things which can not all written here are now need Crypto more than ever.
These prices are like a joke and soon maybe with or without some stop loss hunting to the downside and kicking out buyers with leverage market of Crypto will face another Huge gain.
DISCLAIMER: ((trade based on your own decision))
<<press like👍 if you enjoy💚

Trading plan for BitcoinLast week, price action followed our bullish (green) scenario perfectly. Currently, the chart shows a clearly defined narrowing triangle. A breakout of the trendline will confirm the next directional move. We still have potential for new ATHs, though a corrective pullback might come first. More details in the video itself - enjoy watching!
As always, manage your risk wisely.

Orangeman vs The Federal Reverse: Season 1 (2018–2020)It all started in 2018... 🎬
🧱📈💼 March 21, 2018: Jerome Powell steps in as the new Fed Chair. Almost immediately, the Fed hikes rates from 1.50% to 1.75%, citing a strong U.S. economy.
💬📊🇺🇸 June 13, 2018: Another hike to 2.00%. Powell says the U.S. economy is “in great shape.” But markets? Not so thrilled.
🗣️📉🇺🇸 July 19, 2018: Enter The Orangeman—President Trump publicly attacks the Fed's policy, breaking tradition. He’s “not thrilled” with the hikes.
📉🏦 September 26, 2018: Yet another hike to 2.25%. The Fed stays firm. Trump? Getting louder.
❗😠💬 "I'm not happy with the Fed." – Trump
⚠️📉📉 December 19, 2018: Fourth hike of the year to 2.50%. Markets tank. Rumors swirl: Trump wants Powell gone.
🔥💣👔 Behind the scenes: Trump reportedly explores ways to dismiss Powell. The pressure is on.
📛🇺🇸📉 June 10, 2019: The battle heats up. Trump calls the hikes a “big mistake” and demands rate cuts.
✂️📉📉 July 31, 2019: Powell blinks. The Fed cuts rates by 0.25%—first cut since 2008. Trump tweets:
👎🐦💸 “Powell let us down.”
⬇️📉🔁 September 18, 2019: Second cut.
⚖️🔁🧩 October 30, 2019: Third consecutive cut. The Fed pivots completely. The Orangeman’s influence is undeniable.
🦠🧪📉 March 2020: COVID strikes. The Fed responds with emergency rate cuts.
🌀🧻💸 March 15 & 23, 2020: Rates slashed to near zero. QE infinity unleashed. Powell goes full printer mode. Bitcoin begins to stir...
Season 1 closes with markets melting down, a pandemic, and the Fed surrendering to zero rates.
But The Orangeman isn’t done...
And The Federal Reverse still lurks in the shadows.
Next up: tariffs, China, currency wars, and another campaign trail. 🐉💵⚔️
Season 2 is coming.
Stay tuned...
One tweets.
The other tightens.
Who controls our future?
One Love,
The FXPROFESSOR 💙

Bitcoin Monthly · New ATH vs 2021, Indicators & MoreLast month Bitcoin produced its highest close ever, $107,146. The last three months all closed green, the close was higher than the open, and this is the fourth green month so far.
Bitcoin tends to produce a period of bullish consolidation before a major move, and this is exactly what we are seeing now. Bitcoin tends to produce a correction before a major bullish move, and this is exactly what happened between January and April. Bitcoin is set to grow.
Past action · consolidation
We already looked at the consolidation period that happens between each major price advance. Since 2022, Bitcoin has been moving sideways for some 200-220 days before each advance. This happened in 2022, 2023, 2024 and also now in 2025.
Looking at it from the monthly timeframe, the consolidation period was capped each time at 7 bars, 214 days. Current consolidation has already been going for more than 215 days. Bitcoin is set to continue growing.
Indicators · MAs, RSI & MACD
Bitcoin is trading above all moving averages. The monthly RSI is very strong, beyond 70.6.
The monthly MACD is moving at all-time high levels, trending up with room available for additional growth.
Chart patterns · candlestick reading
The chart patterns now has no similarities to 2021. Many people were saying that Bitcoin produced a double-top similar to 2021 and was set to move down. I completely disagree with this analysis.
In 2021 both instances when Bitcoin peaked the month ended up closing red. In 2025 the months when Bitcoin peaked the months ended closing green.
The same month the peak was hit in 2021 was followed by bearish action, twice. And of course, the bear market. In 2025 the market has been consolidating for months and trading near its all-time high.
Finally, in 2021 each peak was 7 months apart, 214. In 2025, the last two peaks are 4 months apart, only 120 days.
This difference is good to point out because market conditions are not the same. Not the same market conditions means that Bitcoin is not likely to go into a bear market now, instead, it can produce something difference. The market has only three directions: Down, sideways and up.
Down has been eliminated based on past action.
Sideways is happening now.
Something different only leaves the upside open; Bitcoin is going up.
Namaste.

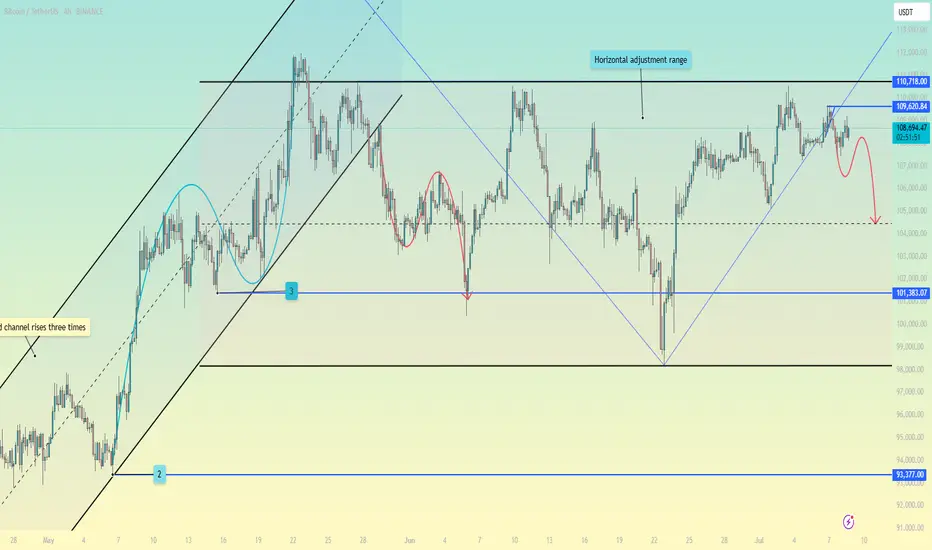
Bitcoin - Last move down, ready for ATH?Bitcoin is showing clear signs of a corrective move within a broader bullish structure. After forming a second consecutive lower high, price is now pressing downward, creating space for a potential liquidity grab and discount entry. Despite this short-term weakness, the macro narrative remains intact. The all-time high remains untapped above, holding a thick layer of liquidity that the market has yet to collect.
Liquidity and Fib Confluence
There is a visible equal low structure around the 107.8k area. This is a prime zone for a sweep, where smart money is likely to trigger sell stops before reversing. Below that lies a Fair Value Gap (FVG) extending into the 106.5k range. Within this same zone, we also have strong Fibonacci confluence, especially at the 0.786 level near 106.2k. This makes it a high-probability entry area if price delivers a clean displacement after the sweep.
Short-Term Bearish, Long-Term Bullish
The market is respecting a trendline drawn across the lower highs, giving the impression of sustained bearish control. However, this is likely a trap. Once the sell-side liquidity below the 107.8k low is taken and the imbalance around 106.5k is filled, price will be primed for a reversal. The true target lies much higher, with the all-time high around 110.5k as the main magnet.
FVG Fill and Reversal Mechanics
This entire drop is likely engineered to fill inefficiencies left behind earlier in the move up. The FVG acts not only as a magnet, but also a springboard for the next leg. Expecting price to show a reaction at the 0.786 level, where the order flow could shift and confirm a bullish reversal, is key here. Ideally, we see a clean sweep, a displacement, and a reclaim of previous structure before targeting higher levels.
Projection and Trade Setup
The anticipated sequence is a sweep of 107.8k, fill of the gap and fib zone down to 106.2k, then a potential reversal structure forming. If that structure confirms, the next major move should aim for the untouched all-time highs, where significant liquidity remains resting. Traders should remain patient and let the sweep and confirmation unfold before entering.
Conclusion
We are watching a classic setup where engineered downside movement is likely to create the conditions for a powerful reversal. As long as price respects the 106k zone and gives a strong reaction, the path toward the ATH remains wide open.
___________________________________
Thanks for your support!
If you found this idea helpful or learned something new, drop a like 👍 and leave a comment, I’d love to hear your thoughts! 🚀
