The price of Bitcoin will once again reach a new high!BTCUSDT continues to show exceptional strength and strong bullish momentum. When we look back at the charts from 2023 and 2024, a clear and reliable pattern stands out. Each time Bitcoin touched the 50 EMA on the weekly chart, it triggered a significant rally that led to new all-time highs. That same setup appears to be forming once again.
BITCOIN tested the 50-week EMA around the $75,000 level and has since bounced with conviction. The price has reclaimed the $100,000 mark and is now challenging previous all-time high resistance. Historically, a successful bounce from this key moving average has not only signaled recovery but also sparked explosive upside moves.
Following this repeating pattern, the current cycle target is positioned at $150,000. A clean breakout above the current resistance zone could act as the trigger that launches Bitcoin into uncharted territory. The technical structure remains bullish, momentum is clearly accelerating, and the overall trend continues to favor the upside.
This moment represents a textbook Buy and HODL opportunity. Technical indicators are aligning, market sentiment is turning increasingly optimistic, and all signs suggest that Bitcoin could be preparing for another historic rally. Stay ready for what could be the next big move.
BTCUSDT.3L trade ideas

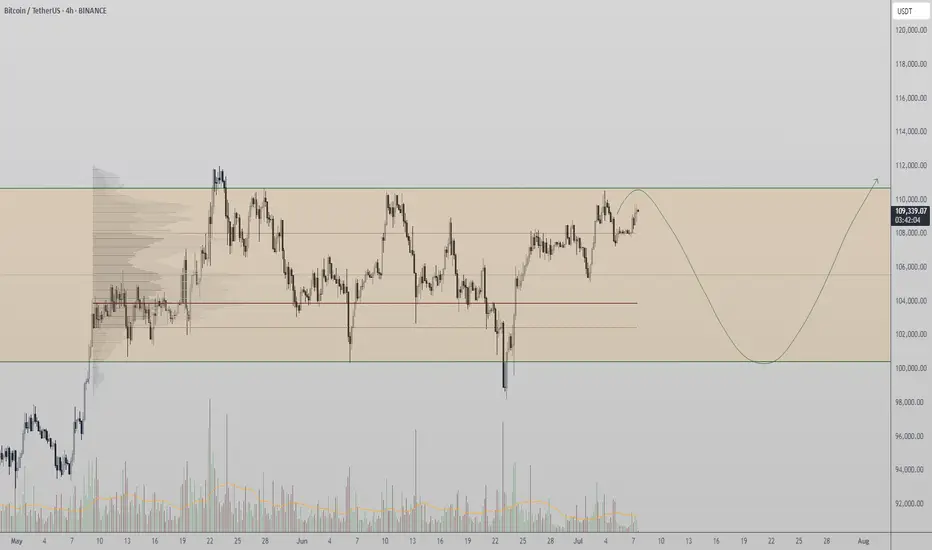
BTC - Last Chance to be Mindful of Potential Flash CrashBTC is at the top of the zone of this bearish retest.
DXY is currently retesting a major breakdown on the monthly time frame - which projects out a 2-4 year bull run for BTC.
Due to this major macro turning point, it’s possible we see an extreme liquidity grab crash on Bitcoin - recovering liquidity as shown on this chart.
Projected movements marked here.
Be prepared for anything - volatility expected

BTC/USDT.P ShortMy Trade Thesis & Rationale:
Here is my thinking on this short setup. I believe this is a high-confluence opportunity where the price action aligns perfectly with what I'm seeing in the underlying market dynamics.
1. The Big Picture (Daily/4H Context):
Price is currently operating at a major historical resistance zone ($110k+). This level has acted as a "ceiling" multiple times, making it a high-probability area for sellers to step in.
I've noticed that momentum on the 4-hour chart has clearly stalled, which to me signals buyer exhaustion after the last run-up.
2. The Tactical Setup (1H/15M Price Action):
After stalling at the highs, the price formed a clear distribution range on the 1-hour chart—a sign that sellers were likely absorbing the remaining buying pressure.
✅ THE TRIGGER: My entry is based on a decisive, high-volume breakdown below the key support of this range at $107,300. This breakdown was followed by what I see as a weak, low-volume retest, confirming buyer weakness and offering a prime entry.
3. My Logic:
🎯 TARGET: I've set my take profit at $106,800 because it's located within a dense pool of long liquidations. I believe these levels often act as a strong magnet for price.
❌ INVALIDATION: My stop loss at $107,550 is placed just above the broken structure. If the price reclaims this level, my bearish breakdown thesis would be proven wrong, and it's my signal to get out.

BTC Daily Chart Analysis
Trend: BTC is currently trading within a short-term descending channel.
Strong Resistance: Zone around $110k–112k, multiple failed retests observed.
Key Support: Around $105k (Ichimoku Cloud upper edge & recent local bottom).
RSI: Clear bearish divergence indicating weakening bullish momentum.
Elliott Wave: Completed 5-wave impulse from $75k up to $112k, now correcting (likely waves 4-5 within the descending channel).
Fibonacci: Breakout above $110k targets approximately $117k (1.414 Fib extension). Failure to break may lead price back down toward $102k.
Probability:
Bullish scenario (35%): Clear breakout above $112k, targeting $117k.
Bearish scenario (65%): Rejection at $112k, potential retest toward $105k → $102k.
⚠️ Recommendation: Closely watch the $110k zone. If BTC fails to clearly breakout, consider defensive actions (reducing position size, risk management).

#BTCUSDT(BITCOIN): Two Targets First $130,000 And Then $150,000Bitcoin is poised for significant distribution, with a potential price surge to $130,000, followed by a swing target of $150,000. The current accumulation phase is poised to transition into a substantial bullish move. We anticipate a surge in bullish volume in the coming days or weeks. Our analysis anticipates this transition to be completed by the end of the year or sooner.
It is important to note that this analysis does not guarantee a specific price movement and is provided solely for educational purposes.
We extend our best wishes for your successful trading endeavours. If our analysis has been of assistance, we would appreciate it if you could express your gratitude by liking and commenting.
For further insights, please follow our account.
Team Setupsfx_

DeGRAM | BTCUSD once again trading above $105k📊 Technical Analysis
● Fresh bounce off the confluence of the 8-month up-sloping purple trend-line and 102-103 k green demand box prints a higher-low inside the rising wedge, keeping bulls in control despite June’s pull-back.
● Price is reclaiming the minor down-trend line from the 12 Jun high; a daily close above 106 k confirms a bear-trap and unlocks the 111.8-112.5 k supply at the wedge cap.
💡 Fundamental Analysis
● Spot-ETF desks absorbed >5 400 BTC in the last three sessions while exchange reserves fell to a four-year low, signalling supply drain.
● Cooling US PCE expectations trimmed real yields, and Mt Gox repayment delays ease overhang fears—both supportive for risk assets.
✨ Summary
Long 102–104 k; hold above 106 k targets 111.8 k → 115 k. Bull thesis void on a 16 h close below 99 k.
-------------------
Share your opinion in the comments and support the idea with a like. Thanks for your support!

BTCUSDT[BITCOIN]:Price is Likely to be Heading Towards $144,000.Recently, Bitcoin has shown extreme bullish price behaviour, and there’s no sign of bearish influence in the market. After monitoring the price since May 4th, we believe there’s a high possibility of price hitting the 120k region first. This could be followed by a small correction around 105k, where a strong bullish price influence will lead the price to our final target at 140k. Both fundamental and technical factors support this view, but it doesn’t guarantee the price will follow our expectations.
Before investing or trading cryptocurrencies, do your own research as they carry significant financial risk. This chart analysis is for educational or secondary purposes only.
Good luck and trade safely.
If you want to support and encourage us, you can do the following: ❤️
-Like the idea
-Comment the idea
-Share ;)
Team Setupsfx_

SPXBank of America expects SPX to close 2025 near 6,300, with a 12‑month projection of 6,600. They note ongoing stagflation risks and do not expect rate cuts this year .

Bullish on $BTC🧠 Wyckoff Overview
🔻 This chart follows Accumulation Schematic #1 in Wyckoff theory.
🔻 The Spring phase (Phase C) is confirmed.
🔻 BTC has broken out from the accumulation zone.
🔻 We are now in Phase D, expecting a move into Phase E (new ATH).
📊 Technical Details
🔻 Accumulation zone: Around $72,000 – $88,000.
🔻 Spring (Phase C): A fakeout happened near $68,000, matching Wyckoff structure.
🔻 Breakout is confirmed after price moved above the downtrend line and Ichimoku cloud.
🔻 Main resistance: $95,000 – currently testing the supply zone.
🔻 Target: If breakout continues, BTC could reach a new ATH above $110,000.
📈 RSI and Volume
🔻 RSI at 66.71: Not overbought yet, still has room to go up.
🔻 Volume is increasing along with the breakout → shows strong buying pressure.
🎯 Personal Prediction
🔻 If BTC holds above $92,000 – $95,000 and continues to consolidate:
→ Short-term goal: $100,000
→ Mid-term goal (Wyckoff Phase E): $110,000 – $112,000

You Haven’t Missed It**⏰ Timeframe: 1H**
**🛠 Tools Used: Dow Theory, Support & Resistance, Volume, RSI**
**📈 Market Overview**
Bitcoin BINANCE:BTCUSDT is currently trading at **110,982**. After hitting a new all-time high at **12K**, the price is undergoing a mild correction. Despite the retracement, price remains supported by both volume and the 25-period moving average.
Yesterday, BTC broke through the **110,267** resistance level with a strong bullish candle, but encountered aggressive selling from market makers and is now consolidating with weak candles below the **12K** mark.
Typically, in such market phases, it’s advisable to close previous positions and consider new entries. However, given the likelihood of **interest rate cuts** and the fact that price is holding near its ATH, keeping previous **long positions** open may be wise, as a **strong upward move** is still on the table.
**⚙️ Technical Analysis**
Yesterday’s breakout above **110,267** was met with seller pressure near **12K**, leading to a shallow correction.
**BTC Dominance (BTC.D)** has broken above **65.04** and **64.69**, moving toward **64.51** resistance. However, a weakening candle structure is visible on both **4H and 1H** timeframes. This indicates that while long opportunities on bullish **BTC pairs** may still exist, we might see a lower high forming above **64.51** and below **64.69**, followed by another move back toward **64.51**.
Meanwhile, **USDT Dominance (USDT.D)** broke below the **4.75** support with a strong candle and is now ranging above **4.63**, suggesting a possible pause or rest phase here.
The **Total Market Cap** shows a similar pattern to **BTCUSDT**, reflecting consolidation with slight bullish bias.
The **Others** chart (excluding BTC & ETH) shows a healthy uptrend and is now facing resistance at **248.68**. A breakout above this level could pave the way for stronger performance among altcoins with bullish BTC pairs.
**🧭 Potential Scenarios**
📗 **Bullish Scenario:**
If BTC forms a **higher low above 110,654**, an entry could be considered above **12,000**, with a stop-loss placed below the higher low (based on the 1H timeframe). Volume confirmation is necessary to support the move.
📕 **Bearish Scenario:**
As long as the price remains **above 109,409**, **short positions are not recommended**.
**💡 Conclusion, Warnings & General Suggestion**
Bitcoin is currently in a **healthy bullish phase**.
The **key resistance at 111K** has been broken, and price is pulling back toward that level.
The structure remains bullish, supported by **sufficient volume** and **no clear bearish divergence**.
If current support holds, there’s potential for continuation toward the **113,500–114,000** range.
⚠️ **Warnings:**
* If the pullback turns into a breakdown (falling below **110,200**, then **109,000**), it would signal **buyer weakness**, and strategy must be reconsidered.
* Watch for **RSI divergences** or **declining volume** during further rallies—they may indicate caution.
* Prolonged consolidation **below broken resistance** could also indicate market weakness.

BTC USDT ANALYSESBitcoin (BTC) is currently forming an ascending triangle, which is typically a bullish continuation pattern. If BTC breaks out of the triangle to the upside, my target would be around $130,000.
However, we also have a long-term ascending trendline that BTC has been respecting for a significant period. If BTC fails to break out of the ascending triangle, we may see a pullback toward this trendline. Notably, there is also a strong demand zone in that area, which could act as support.
On the weekly timeframe, there is a visible regular bearish divergence—a bearish signal that suggests a potential slowdown or correction. If the divergence plays out, a realistic downside target could be around $100,000 to $98,000.

A Comprehensive Analysis !!!This market has shown disregard for technical patterns, and every time the price approaches historically significant levels, it reveals its true intentions and disappoints us. This cycle tends to repeat.
In my opinion, we’re likely to see one more drop in Bitcoin’s price. After that, instead of continuing the expected downtrend from the pattern, the price could break the descending formation and experience a strong upward move.
Stay Awesome , CobraVanguard.

Bitcoin's New All-Time High = Altcoins Market Bull MarketThe shy new all-time high is in and it is good to be Bitcoin today. It is good to be Bitcoin, to be in Bitcoin and profit while trading Bitcoin but the bears got rekt and that's oookkkk. We accept their loss and it is their loss they earned it by being short when the market is good, bullish and strong. Who would short Bitcoin right before a new all-time high? I don't know.
A new all-time high was hit today, the price $112,000 but this is not the end. Not even close. This is the beginning of the next bullish wave.
I know what you are thinking, or might be thinking; Wait, but what about a drop? What about the correction? Will it go lower? Can I buy Bitcoin at 90K? I told you to buy when prices were low... "You would look like a genius for buying below 80K," 100K is already gone. No, no correction! Bitcoin is going up.
When resistance breaks it means higher. When prices move higher it means higher. When a new all-time high hits it means the bulls win. Now that the bulls won, the battle for the rise or the drop, we can expect higher prices. If you have any doubts, look at the altcoins. The altcoins market says we are entering a period of long-term growth.
Bitcoin will continue to hold strong. It will continue to rise surely, slowly, or fast, but long-term. It doesn't matter the speed; Bitcoin for the whales, altcoins for retail.
A small capital will grow faster with the altcoins because they have higher room for growth. The projects being smaller, more volatile makes for a good trading experience. Higher risk but also a higher opportunity to grow in the short- and mid-term. Bitcoin is good to retire now. Bitcoin is great to hold value, to support the market as it continues to grow.
For me and for you, welcome to the altcoins market bull market.
Thanks a lot for your continued support.
Namaste.

BEst long on Btc is at $104 600CRYPTOCAP:BTC
Our plan is still bullish
But price reached VAH
That's why some pullback is possible
$104 600 is key zone for me. POC + VWAP. I`ll take a long trade in a case of local confirmation.

BTC - Zoomed Out ScenarioAs predicted DXY has broken down a major monthly bearish trendline - currently finishing a bearish retest before further free fall.
If this plays out we have 2-3 years of a weakening / correcting dollar, and a strengthening investment in assets such as Bitcoin.
This means an extended bull market spanning 2-4 years on Bitcoin and equities.
However - there is a mass amount of liquidity to the uber lows towards 10,000 on BTC.
Market is showing manipulated intention to hit these lows by keeping the price below this bearish cross section - and that’s why bitcoin hasn’t been moving up yet.
This tells me this is more likely than we all think to play out.
I’m trading the following:
Short - 108,200 to 35,000
Long - 35,000 to 80,000
Short - 80,000 to 10,000
Will update accordingly if the plan changes.
Happy trading.

BTC in a Bearish 60 min movementBTC in a 60-minute bearish move
It appears that BTC has already completed the C leg of a 60-minute harmonic pattern near 109680
BTC is forming a larger corrective pattern rather than taking a true direction, thus increasing the chances of completing this pattern before moving up again.
Currently, the price is positioned to complete the D leg of the pattern near 105700
I am looking for short-term targets near 107240; 106275 and 105715
You may find more details in the chart!
Thank you and Good Luck!
PS: Please support with a like or comment if you find this analysis useful for your trading day

Bitcoin has dropped for profitable purchasesBitcoin is within the range. Quite a bit of time has passed since the last retest, and the liquidity pool that has formed below 106345 may not allow the price to fall on the first attempt.
Global and local trends are bullish. Enter a buy position after a false breakout of support and the formation of a local reversal pattern on TF m5-m15
Scenario: if, after a false breakout, price consolidation forms above 106500, then the entry point could be a breakout of local highs (breakout of the structure - ‘bos’).

Why This Breakout Feels Like $29K and $48K – Big Moves Ahead?🤔📊 Why This Breakout Feels Like $29K and $48K – Big Moves Ahead? 🚀📈
Hey everyone! It’s Saturday, July 12th , and while the markets take a breather, it’s the perfect moment to zoom out and assess the bigger picture . Are we in for another retail weekend surge?
Let’s break it down 🔍👇
After closely analyzing the charts, one thing becomes clear — this breakout is structurally similar to the previous key breakouts at $29K and $48K. In both historical cases, price surged significantly without immediately retesting the breakout level.
➡️ Back in 2020, price exploded +144% above the yellow level before ever coming back to test it.
➡️ At $48K, a similar move of +49% occurred before signs of exhaustion and a retest emerged.
Fast forward to today: We've just broken above a massive ascending support zone — $114,921–$115K — and the market shows no intention of pulling back yet. This tells us something powerful: Momentum is in control.
💡 According to my technical roadmap, we may not see a retest of $115K anytime soon. Instead, the next target zone lies around $182K–$189K, depending on velocity and sentiment. With halving-to-ATH cycles historically lasting ~550 days, we’re well within that bullish window.
Remember the channel support/last entry right after the Iran-Israel ceasefire on June 23rd? That’s been a defining entry and it’s still playing out beautifully. So we wish for geopolitical stability and peace.
So, while it’s easy to feel left out — don’t short, don’t sulk. This may be our moment to ride the wave long. 🎯📉📈
One Love,
The FXPROFESSOR 💙
Disclosure: I am happy to be part of the Trade Nation's Influencer program and receive a monthly fee for using their TradingView charts in my analysis. Awesome broker, where the trader really comes first! 🌟🤝📈

Bitcoin Tests Range High Again — Will This Time Be the Breakout?Bitcoin is once again at the top of its multi-week range, testing resistance near previous highs. A decisive breakout remains elusive as price struggles to sustain momentum without volume confirmation.
Bitcoin is back at a familiar technical level — the top of its long-standing trading range. After a weekend rally that pushed price toward range resistance, BTC now finds itself hovering near the weekly open, raising questions about whether this move will finally lead to a breakout or simply mark another deviation. With historical price action showing repeated failures at this level, all eyes are on volume and confirmation to validate the next directional leg.
Key Technical Points:
- Range High Resistance Reached Again: BTC testing resistance zone that has capped price for weeks
- Weekend Pump, Weekday Fade: Price surged over the weekend but is now settling near the weekly open
- Volume Still Lacking: No breakout confirmation without a strong influx in volume
The recent price surge in Bitcoin occurred over the weekend — a time when liquidity is typically thinner and institutional volume is reduced. While this move did push BTC back into the upper portion of its range, it’s important to recognize that the price is once again stalling near the range high. This level has historically acted as a firm resistance, and prior attempts to break above it have resulted in deviations followed by re-entries into the range.
This time is no different — so far. The current consolidation just below the high suggests the market is undecided, awaiting further confirmation through volume or macro developments. Without a high-time-frame close above the range resistance — and without meaningful volume behind it — the likelihood of this being another deviation remains high.
It’s also worth noting that BTC is back near the weekly open, which suggests the weekend rally may lack sustainability. In similar past instances, Monday retracements have confirmed that weekend pumps were driven by thinner liquidity and lacked conviction. Until proven otherwise, this appears to be more of the same.
From a structural standpoint, Bitcoin continues to trade within a well-defined horizontal range. This means oscillations between the range low and range high are still valid expectations until a breakout or breakdown occurs. These types of consolidations often persist until a major catalyst, and while the breakout is inevitable, it hasn’t happened yet.
Expect Bitcoin to continue ranging between its established high and low unless volume confirms a true breakout. A failure to hold above the current highs may trigger another rotation back toward range support.
BTCUSDT – The Liquidity Mirage: This Pump Is a Setup!Chart Type: BTCUSDT | 1D & 8H Analysis
Status: Live Reversal Setup | FOMO Trap Triggered
⸻
🧠 Overview:
What looks like a breakout is actually a trap. This pump has violated key sniper rules:
• No reactive volume confirmation
• No structure retest
• Triggered FOMO entries at the highs
• TP booked by whales while retail enters late
Instead of continuation, BTC is setting up for a controlled distribution dump.
⸻
🔍 Sniper Observations:
Component Kaizen Verdict
Volume >> ❌ Weak → No relative confirmation
RSI >> ⚠️ Flat → Bearish Divergence Expected
Structure. >> ❌ No retest or reclaim → Just exhaustion
FOMO Activity >> ✅ High → Clear Retail Entry Trap
Liquidity Above >> ✅ Filled → Nothing left to chase
Whale Behavior >> ✅ TP Booked → Exit has begun
⸻
💣 Liquidity Cloud Mapping:
112,000–114,000 = Retail Exhaustion Zone
✅ TP Booked
✅ FOMO Entry Triggered
✅ Liquidity Grab Completed
108,000 = First Profit Zone (TP1)
Institutional cluster > Buy-back likely
105,000 = Final Target Zone (TP2)
Reversal + SL stack of FOMO longs
93,000–95,000 = Full Trap Unwind
Bonus TP for deep reversal setups
⸻
🎯 Short Plan
(Live Deployment Ready)
Component Value
Entry Zone | 🔫 112,450 – 113,000
Stop Loss | 🛡️ 114,050 (Above fake breakout wick)
Take Profit 1 | 🎯 108,092
Take Profit 2 | 🎯 105,175 (Retail Flush & Whale Reload)
Bonus TP | 🎯 93,218 (Full exhaustion if volume spike appears)
Leverage | ⚔️ 3x–5x recommended for precision swing short
Position Type | 🧠 Swing short / Trap Reversal
⸻
🔑 Trigger Confirmation Before Entry:
1. ✅ 4H Candle Rejection from 112,450+ zone
2. ✅ Divergence in Volume (Price ↑ but volume ↓)
3. ✅ Momentum Fade on RSI or OBV
4. ✅ Spoof walls appear above 112,700 (signs of artificial sell pressure)
⸻
🧠 Why This Trade Works:
• Retail just entered at highs after seeing “confirmed breakout”
• Whales already exited at 112K+
• Market requires fuel for reversal = Retail SLs + Exit Liquidity
• Volume does NOT support real continuation
• Price will trap both bulls & late shorts before true reversal triggers
⸻
🚨 Risk Warning:
If BTC closes above 114,000 with sustained volume AND retests that level, the setup invalidates.
Don’t hold a sniper entry into strength. This is a precision trap entry, not a momentum chase.
⸻
📢 Final Note:
“The most profitable trades come when the crowd is silent, and the volume is fake. This is one of those setups — you’re not late. You’re right on time.”

Yeet! You thought "Why are these market so fake and scammy" is our daily crypto mantra. We extend this tradition

Where Can Bitcoin Go? Part 9 – Breakout and History in Motion🌋🚀 Where Can Bitcoin Go? Part 9 – Breakout and History in Motion. 🔓💥
The breakout over 114900 has happened.
After 2 rejections, years of preparation, and countless fakeouts… Bitcoin has finally cleared the $114,921 barrier.
We are now officially in price discovery mode within the upper resistance channel.
📍 As long as BTC stays above $114,900 – we are long.
This level is now our trigger line. Lose it? Flip back to short bias. Hold it? There’s only one word: 🚀
🔑 Context:
We’ve tracked this structure since 2023 using a 1-2-3 model based on macro highs. The third test is always the decider — and this time, we broke through.
✅ Test 1: Rejected (2021)
✅ Test 2: Rejected (2025)
✅ Test 3: Breakout confirmed (July 2025)
Now compare that to previous cycles:
2016 halving → ATH in 2017
2020 halving → ATH in 2021
2024 halving → ATH coming by end of 2025?
🧭 Based on this map, BTC’s next structural targets are:
→ $137K
→ $160K
→ $182K+
But there’s a catch: if we fall back below 114,900, the entire breakout thesis is at risk. This is now a binary zone.
⚠️ What to Watch:
📌 Support Retests:
Expect volatility around the 114.9–116K level. This zone will now be stress-tested.
📌 Media Frenzy vs Structure:
As hype increases, stick to levels — not noise.
📌 Ultimate FOMO vs Breakdown:
Hold structure = ATH potential
Lose structure = Down we go, potentially hard.
🎥 Missed the full structural breakdown?
👉 Watch “Where Can Bitcoin Go? Part 8” for the blueprint
👉 This is now Part 9 – The terminal move has begun
We are now playing for cycle maturity – this could be the final leg before topping out in late 2025.
Let’s trade it with clarity, not emotions.
One Love,
The FXPROFESSOR 💙
Disclosure: I am happy to be part of the Trade Nation's Influencer program and receive a monthly fee for using their TradingView charts in my analysis. Awesome broker, where the trader really comes first! 🌟🤝📈
🚨 BITCOIN HAS BROKEN OUT but keep in mind: under 114900 be OUT!

BTC - LONG UPDATEI'm taking profit on the long here, nice weekend pump.
For me low 109s is the inflection point, I rather take profit here and start the week fresh.
See previous BTC post for a more zoomed out version and higher timeframe levels, nothing has changed.
