Where is the local bottom? BTC has decided to dip further, retraced to daily support and is probably going for liquidity at 100.3k.
BTCUSDT.3L trade ideas

BTC ALL SET FOR ATH Price is forming a lower high and starting to roll over , this suggests bearish pressure is creeping in, Recent candles are showing smaller bodies and long wicks, indicating indecision and a potential slowdown in bullish momentum. BTC could test support zones 92,000 and show short term pull back but major trend is bullish from 84k zone , buckle up and watch it tightly.
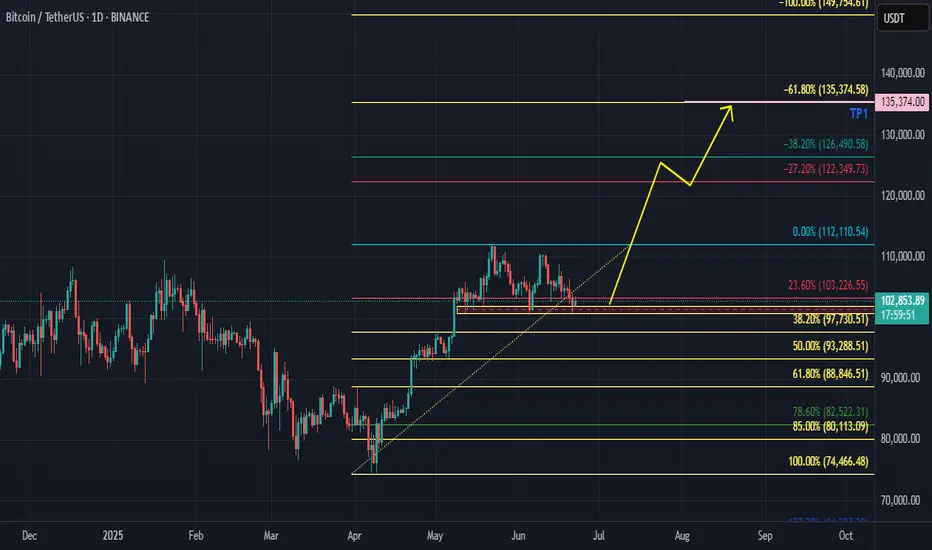
BTCUSDT Daily 22th JunI have drawn Fibonacci Retracement and specified TP 135k$. I think BTC would may bullish.
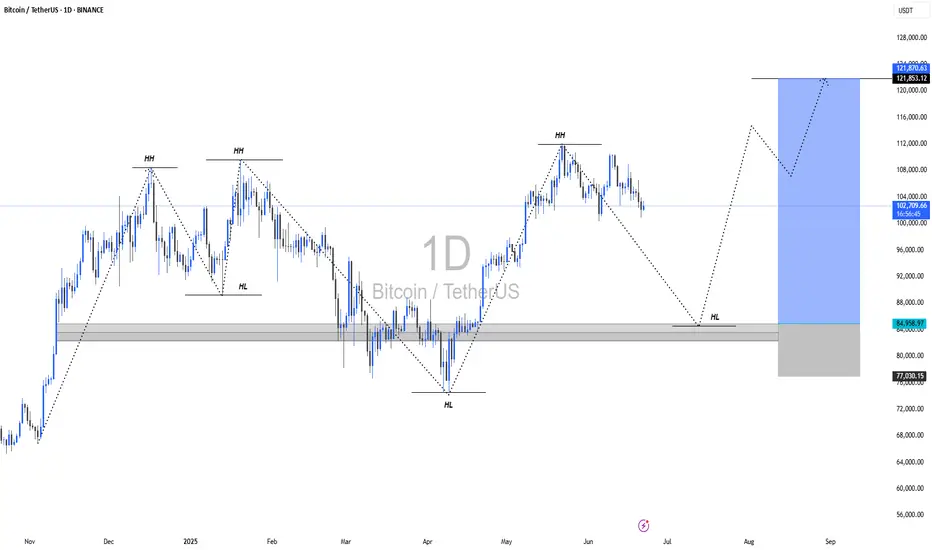
The Pattern That Could Launch BitcoinSpotted a long-term inverted head & shoulders pattern forming over a 7–8 month stretch on Bitcoin — much more reliable than short-term setups. If this bullish structure plays out, we could be looking at a breakout that pushes BTC firmly into price discovery.
I’ve included local Fibonacci levels on the chart, though I couldn’t fit the macro one (going from $4k → $69k → $15k — the 1.618 extension of that larger swing lands at $119,800. That could be a key resistance target if we clear the ATH and continue the uptrend. After that, there's the smaller timeframe, but more recent, fib ext 1.618 sitting at $131k.
I'd be very cautious of a failed pattern if $101k doesn't hold. As a last support, 95k and the red 20EMA might hold.
Let’s see how this plays out 🚀

$BTC Bounce Targeting $112K?CRYPTOCAP:BTC is trading within a descending channel and has just bounced off the lower support level near $101,400.
If this rebound holds, we could see a push toward $107,000–$ 112,000.
However, it remains in a downtrend, so any upside may face resistance unless the channel breaks with strong volume.

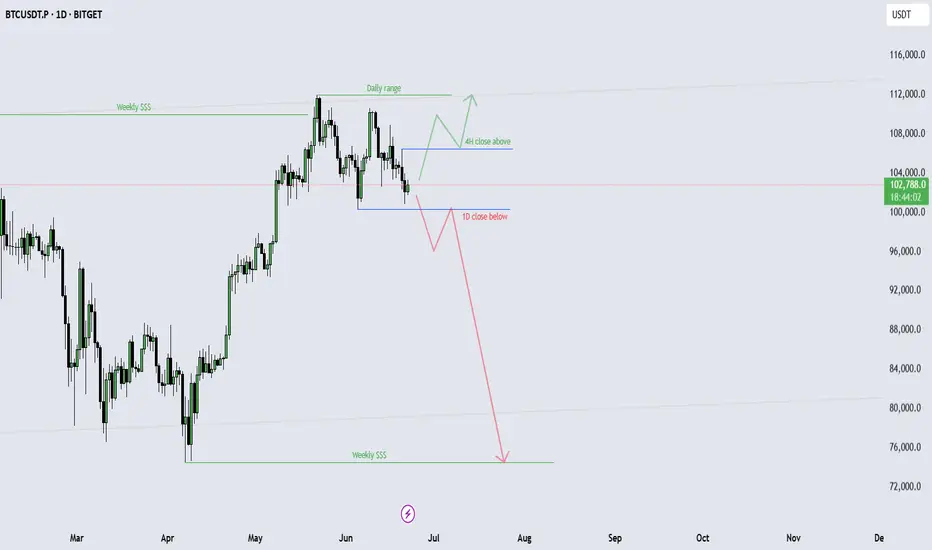
BTCUSDT: buy or sell plans for near futureBTCUSDT: buy or sell plans for near future. Very easy and clear setups are shown. Pay attention to the timeframes that I have indicated. You can either buy or sell immediately after close, or wait for pullback to gain more.
Cheers
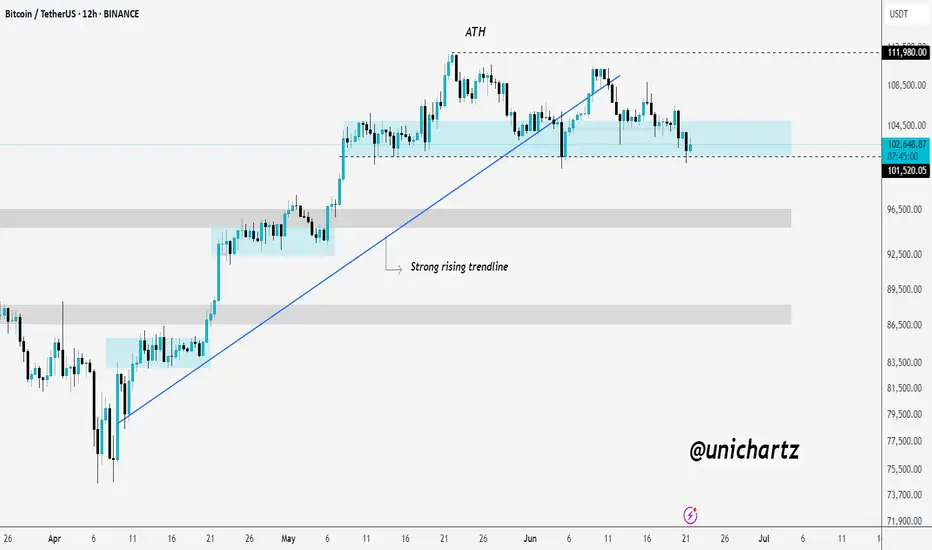
Support Tested: Can Bitcoin Withstand Global Fear?CRYPTOCAP:BTC is struggling to hold above the key support zone after losing its rising trendline.
This weakness comes as the Israel-Iran conflict intensifies, shaking global market confidence. While BTC has often acted as a hedge, rising geopolitical tension is pushing investors toward safety, causing hesitation even at critical support levels.
A breakdown here could trigger deeper downside.
DYOR, NFA
BITCOIN → Possibility of retesting 100K. Buyer weakeningBINANCE:BTCUSDT.P is in consolidation after the rally stalled due to the exhaustion of the bullish driver. The price updates local lows and starts looking at 100K
Bitcoin is under pressure after the escalation of conflict in the middle east and after the FOMC speech. There is also another observation: large companies, politicians, funds and investors have long and aggressively motivate the crowd to buy, verbally confirming that they bought dozens and hundreds of bitcoins at a time for the balance, but bitcoin is standing still and updating lows. At the same time, various services such as "cryptorank" fix bullish sentiment at the lows. The market either lacks liquidity or something more unpredictable is happening (chart drawing????)
Technically, bitcoin is following the behavior of the SP500 quite strongly, which closes Friday's session quite weak and close to key support, which could trigger a continuation of the decline. Bitcoin won't stay on the sidelines and could also follow the index....
Resistance levels: 104K, 105K, 106K
Support levels: 102K, 100.6K, 97.5K
The price is coming out of the “symmetrical triangle” consolidation breaking the support, thus confirming the bearish mood. After a small correction after a false breakdown of 102500 the price may again return to storm (retest) the level under market pressure, which will only strengthen expectations of further decline. The target is liquidity 100600 - 100K. From 100K rebound and growth is possible.
Regards R. Linda!

BTC HTF TA- Going as planned.
- Nothing changed
- Prepare for the worst liquidation event where every retail traders are net long in crypto based on their fantasies, hopes and dreams. X has been toxicating them with the ideas of US gov. or US iBank will make them rich.

BTC/USDT – Technical Outlook:
📊 BTC/USDT – Technical Outlook
🗓️ Published: June 21, 2025 | 🕰 Timeframe: H4
🔻 Market Sentiment: Bearish
The BTC/USDT pair is currently exhibiting strong bearish momentum after a failed breakout above the 106,000 resistance level. The price has sharply declined and is now trading around 103,485 USDT, confirming a breakdown from the consolidation phase.
🔍 Key Technical Highlights:
Ichimoku Cloud Analysis:
Price is trading below the Kumo, indicating a bearish trend continuation.
The future cloud is thick and red, reinforcing downside pressure.
The Chikou Span (lagging line) supports the bearish outlook.
Structure & Volume:
Market structure has shifted to lower highs and lower lows.
A visible volume gap exists between 103,000 and 101,000 – suggesting price could drop quickly into the next demand zone.
Support & Target Zone:
Strong demand zone identified between 100,000 – 101,000 USDT.
This area previously acted as a high-volume accumulation zone.
Projection Path:
Based on price action and market momentum, a continued move toward the 100K psychological support is likely.
🧠 Professional Insight:
"The breakdown below the cloud and recent support level confirms seller dominance. As BTC loses strength below 104K, we anticipate a potential drive toward the 100K demand area, where buyers may re-enter."
📌 Strategic Trade Setup (Not financial advice):
Short Entry: Below 103,200
Target: 100,000 – 101,000
Stop Loss: Above 104,900 (just above the cloud)
Risk/Reward: Optimal 1:2+

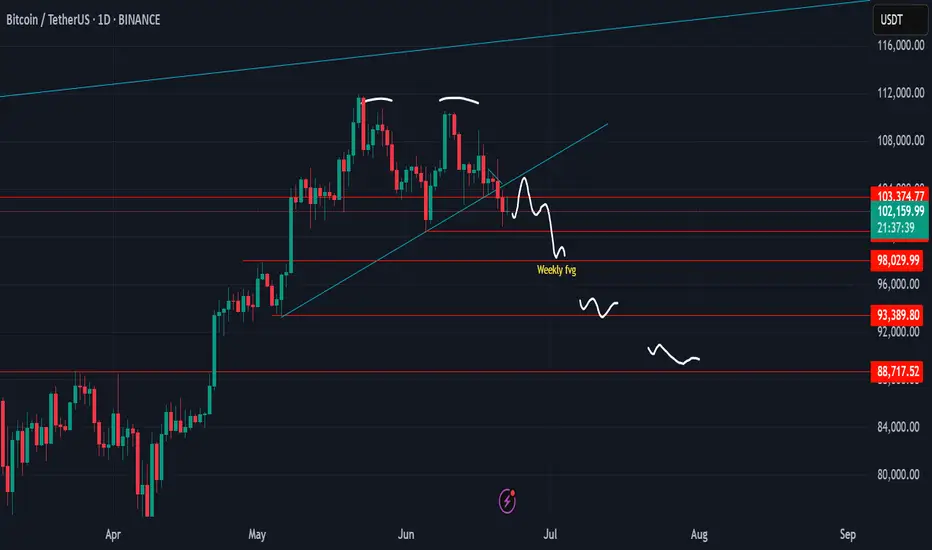
Bitcoin, everyday dump dayNow, we can see everyday is dump day till several days
After success breakout trendling and support, then can't back above the lines
Reasonable target is mini pump to retest then dump to 98k, 98k level is support and weekly open fvg
But if 98k break we will see 93k, and if 93k break we will see final of double top target around 88k and altcoin will rug hard again
But if Bitcoin can go back above 108k, maybe this scenario will be invalid
Bitcoin and the descending channel it consistently followsAccording to the UTC+3 time zone, there is a Bitcoin channel between the 23:00 and 03:00 candles on May 21, which uses the width of the channel (the yellow channel). If we copy the same channel and place it at the upper wick of the 15:00 candle on May 27, we get the green channel. Similarly, by copying the yellow channel and aligning it with the lower wick of the 03:00 candle on May 22, which is one of the first two white candles at the start of the channel, we get the orange channel. The blue channel, on the other hand, is my prediction. In addition, not only the 0 and 1 points (solid line) of the channels but also the 0.5 (short line), 0.25, and 0.75 (dotted lines) levels act as support and resistance.


bitcoin btc shortshort entry :107.300 , STOP LOSS: 108.400 , PROFIT TARGET 101.000
RR 1:5 BINANCE:BTCUSDT.P

$BTC Breaks Key Support – Bearish Signal Bitcoin has lost the CRYPTOCAP:BTC Breaks Key Support – Bearish Signal
Bitcoin has lost the critical 50 EMA on the daily chart, which has historically acted as a strong support level. This breakdown mirrors the 2021 double top structure and is now hinting at a deeper correction.
🔸 Key Support Zone at $100,000:
Losing this zone increases downside risk. If $100K fails to hold, next visible supports are at $96K and $91K, aligning with past consolidation zones.
🔸 Risk Level at $104,500:
A daily close back above $104.5K would invalidate this bearish view and indicate strength recovery.
🔸 Outlook:
Wait for further confirmation below $100K for potential short setups. Avoid long entries until clear reversal signs appear.

BTC is stuck in a tightening triangle — compression phaseVolatility building up into June 18–19.
Expect a big breakout.
Main scenario: breakout to the upside with a “God Candle” and new momentum for altcoins after prolonged BTC dominance.
Alts have been suppressed, but that’s part of the setup — don’t get tricked by the fake moves.
Stay patient, don’t lose focus, and be ready for a sharp move!
