BTCUSDT daily analysisia have shared one hour timeframe analysis and this is daily timeframe and i am following priceaction candle and volume with SMC and more my own personal and private strategies
BTCUSDT.3S trade ideas

HolderStat┆BTCUSD forming the triangleBINANCE:BTCUSDT has reclaimed the $106,000 support and broken out of a triangle structure. The path now leads toward 111K, a major resistance zone. Similar setups have triggered strong rallies before, and bulls are defending levels aggressively.

Bitcoin (BTCUSDT) Market Update – DailyBitcoin remains in a tight range between $110,221.73 (resistance) and $101,546.27 (support). These two levels are the main reference points for initiating high-probability trades.
🔸 Market Context:
The primary trend is bullish, so the priority remains on long setups.
Short positions should only be considered below $101,546.27 with confirmation.
With the prevailing bullish structure, early entries can be taken with a low-risk trigger at $108,746.08.
🔸 Moving Averages & Momentum:
The SMA 7 has caught up with the daily candles, but we haven’t seen a strong reaction yet.
If today's candle wicks above the SMA 7, we can more confidently pursue long setups starting tomorrow.
Otherwise, we may see a pullback toward the SMA 25, especially given the decreasing volume typical of ranging phases.
🔸 Lower Timeframe Setup (1H/4H):
A micro range box can be observed between $108,746 and $106,649.78.
If price approaches $108,746 with increasing volume, that can serve as a valid long trigger on intraday timeframes.
⏳ Final Note: Patience is key while BTC trades inside this range. The bullish structure remains intact, and opportunities for long trades are more favorable for now. Wait for clean breakouts or volume-based confirmations before entering new trades.
#BTCUSDT #BitcoinAnalysis #CryptoUpdate #BTCPrice #CryptoStrategy #BitcoinRange #LongSetup #TechnicalAnalysis #TradingView

Bitcoin sell short bigBitcoin is ready to fill the big gap and the biggest liquidity, the range of 25,000 and 19,000 can be a good time to buy Bitcoin.

BTCUSDT 30-Min | Microstructure Breakdown at Key ConfluencePrice Action:
BTC rejected from Fib 0.5–0.618 zone (110.2K–111.5K), aligning with rising channel resistance.
Failed breakout attempt above local highs (~109.6K) → price sharply reversed.
Clean breakdown from rising wedge/channel support (blue) and EMA cluster.
Support/Resistance:
Immediate support at 107.5K (red horizontal) now under pressure.
Next key support: 106.6K zone (channel lower bound, Fib cluster, previous demand).
Resistance remains strong at 109.8K–110.2K (gray zone + trendline).
Indicators:
Volume spike during recent breakdown = bearish confirmation
Multiple consecutive sell signals after EMA flattening = momentum shift
Minor bounce attempts got rejected at descending EMA stack
🎯 Quick Take:
Bias: Bearish below 108.2K
Scalp short active while price is under red horizontal + EMAs
Watch for bounce attempt near 106.6K–106.3K
Invalidation: Clean reclaim of 108.6K + bullish volume

BTC - will it touch ATH @ 112K ?Well the move of BTC was moved just touching the 4H or 1H ob acted as a well cushion and moved up, Looks like this is going to happen for once and then can be seen!

BTC massive sell BTC massive sell is about to begin
Wait for confirmation
Buyers are active in the supply zone
Watch out for potential turning points
To the down or upside.
Proper risk management is advised
Happy trading.

"BTC Pumps from $108,850 to $109,900 – What's Next?"Bitcoin has shown strong bullish momentum, rising from $108,850 to $109,900 in a short time. This move signals renewed buying interest in the market and suggests that Bitcoin may be preparing for a breakout above the $110,000 level.
Analysts believe this move is driven by whale accumulation, positive global sentiment around crypto regulations, and technical indicators pointing to a breakout. If BTC holds above $109,900, the next targets could be $110K and $112K.
Stay alert — the bulls might be back!

Bitcoin Technical Analysis – Key Supports in Focus🔥 Bitcoin Technical Analysis – Key Supports in Focus
Bitcoin (BTCUSDT) is currently going through a correction after its recent rally. All eyes are now on the $107,000 support level. If this zone holds, we might see a bullish bounce from here.
⚠️ However, if BTC loses this support, the next strong demand zone lies at $105,300 — a critical level to watch for any potential reversal.
📈 On the upside, if bulls take control and price rebounds, the first target would be $113,700, followed by $117,800 as the next major resistance.
🧠 Smart traders are watching these levels closely — don’t miss the next move.
🔔 Follow for more real-time insights, clean charts, and professional TA!
#BTC #Bitcoin #CryptoTrading #BTCUSDT #TechnicalAnalysis #TradingViewIdeas #SupportAndResistance

BTC price prediction As my personal analysis if BTC crossing 🚸 110655 without touching the previous high 111960 then BTC moving down 👇 directly or after sideways condition some days

CONSOLIDATIONfriends BTC will consolidate inside the channel for couple of days . if it break upside it will make all time high definitely. if it break downside there is chance of dump till 105k.

BTCUSDT - UniverseMetta - Signal#BTCUSDT - UniverseMetta - Signal
D1 - Formation of the 3rd wave + potential exit from the channel. Stop behind the minimum of the 2nd wave.
Entry: 107481.70
TP: 111110.12 - 115670.15 - 119641.79 - 126457.32
Stop: 104882.98

BTCUSDT analysis - 1H FVG and OB SetupsBitcoin has reacted cleanly to all marked zones so far.
Right now, we are waiting for price to reach the green circle area before making a decision. If we get confirmation on lower timeframes, we can look for a potential short setup on BTC.
Key zones are marked on the chart. Always wait for price to reach these levels and take your reactions on lower timeframes for precise entries.
Stay patient and let the chart come to you.
—
📊 ProfitaminFX | Gold, BTC & EUR/USD
📚 Daily setups & educational trades
📱 IG: @profitamin.fx

BTCUSDT Trade SetupBTC Still in sideways no major move, wait for the entries. While on weekly tf still expecting a final shakeout, 95-93k then a final leg up towards to 120k. For now wait for the entries to be filled first then must use sl.

Skeptic| Cycle Mastery Part 1: HWC, MWC, LWC for Smarter TradingUnderstanding Higher Wave Cycle ( HWC ), Minor Wave Cycle ( MWC ), and Low Wave Cycle ( LWC ) is the key to making informed trading decisions, simplifying when to go long , short , or stay out . This Part 1 masterclass introduces these cycles, their relative nature, and how to align them with your strategy for precise entries and effective risk management . Let’s break it down. 📊
The Three Cycles: HWC, MWC, LWC
We trade across three market cycles:
HWC (Higher Wave Cycle) : The big-picture trend, like Bitcoin’s yearly uptrend.
MWC (Minor Wave Cycle): A medium-term trend, often an uptrend or corrective phase within the HWC.
LWC (Low Wave Cycle): The short-term daily trend, which can be range-bound, uptrend, or downtrend.
Knowing these cycles helps you decide when to e nter long, short, or avoid trading altogether, ensuring you align with the market’s rhythm.
Defining Your Cycles: It’s Relative
The main question before diving in: What timeframes are HWC, MWC, and LWC? The answer is relative—it depends on your strategy. Think of it like a temperature scale: 0°C isn’t “no heat” but a reference point (water’s freezing point). Similarly, your cycles are defined by the largest timeframe you analyze:
HWC: Your highest timeframe (e.g., Weekly for long-term traders).
MWC: The next level down (e.g., Daily).
LWC: Your shortest timeframe (e.g., 4-Hour or 1-Hour).
Ask yourself: What’s the largest timeframe I check? Set your HWC there, then scale down for MWC and LWC based on your trading style. This relativity ensures your cycles fit your unique approach.
While shorter cycles (LWC, MWC) form the HWC, the HWC’s power dominates, influencing smaller cycles. Let’s explore how to trade based on these relationships.
Trading Scenarios: When to Act
Scenario 1: HWC Uptrend, MWC Range
When the HWC is in an uptrend and the MWC is range-bound:
Action: Enter a long position on the first MWC wave when the LWC breaks the ceiling of the MWC range (e.g., a box breakout).
Why? The HWC’s bullish power supports the move, likely triggering an MWC uptrend. This makes the first wave a strong, low-risk entry.
Example: If the LWC (e.g., 4-hour) breaks the MWC range ceiling with a strong candle, you can confidently go long, backed by the HWC uptrend.
Scenario 2: HWC Downtrend, MWC Range
When the HWC is in a downtrend and the MWC is range-bound:
Action: Skip the first MWC wave. If the LWC breaks the MWC range ceiling, avoid going long—the bearish HWC could reject the move, resuming its downtrend.
Wait for the Second Wave: Let the MWC return to a range after the first wave. If the LWC breaks the range ceiling again, go long with confidence—the HWC’s influence is less likely to disrupt this second wave.
Risk Management Tips (if you trade the first wave against the HWC):
Reduce Risk: Lower your position size to minimize exposure.
Take Profits Early: Close the position or secure most profits (e.g., scale out) once you hit your R/R target, as volatility is high.
Wider Stop-Loss: Set a larger stop-loss to account for potential HWC-driven reversals, as stop-loss hunts are common in this scenario.
Adjusting Stop-Loss Size Based on Cycles
Aligned Cycles (HWC, MWC, LWC in Same Direction): When all three cycles align (e.g., all uptrend), set a tighter stop-loss relative to market conditions. Gradually scale out profits instead of closing the position, as the trend’s strength supports higher R/R (e.g., 5 or 10).
HWC Against MWC/LWC: If the HWC opposes the other cycles (e.g., HWC downtrend, MWC/LWC uptrend), use a wider stop-loss. The HWC’s power could reverse the LWC, lowering your win rate if stops are too tight. Expect volatility and plan accordingly.
Final Vibe Check
This Cycle Mastery Part 1 equips you to time MWC waves with precision, aligning HWC, MWC, and LWC for smarter entries. By mastering when to trade the first or second wave, you’ll avoid traps and maximize your edge. Part 2 will dive deeper with examples—stay tuned! At Skeptic Lab, we trade with no FOMO, no hype, just reason. Protect your capital—stick to 1%–2% risk per trade. Want Part 2 or another topic? Drop it in the comments! If this guide sharpened your game, hit that boost—it fuels my mission! 😊 Stay disciplined, fam! ✌️
💬 Let’s Talk!
How will you time your MWC waves? Share your thoughts in the comments, and let’s crush it together!

BTC Price Prediction Price breaks down from inside the channel and turns bullish from a point between 106500 (very high probability) and 102500 (low probability).
Volume Weighted Average Price
Classical Technical Analysis
Rising Wedge Formation
Elliot Wave - Correction Wave
Pitchfan
Harmonic - Potential Bullish Gartley
Smart Money Concept
ICT

BTC up following H1 trend linePlan BTC today: 07 July 2025
Related Information:!!!
Bitcoin (BTC) trades slightly below $109,000 at the time of writing on Monday, following its highest weekly close on record. Institutional and corporate demand continues to serve as a key catalyst, with Metaplanet acquiring an additional 2,205 BTC on Monday, while US-listed spot Bitcoin Exchange Traded Funds (ETFs) saw over $769 million in net inflows last week.
As market participants assess the latest bullish indicators, focus now shifts to broader macroeconomic developments, including new trade-related headlines and reports suggesting that the administration of US President Donald Trump may extend the current tariff pause until August 1.
personal opinion:!!!
BTC moves sideways in the trend line, trend line support 108,300
Important price zone to consider :!!!
support zone : 108.300
Sustainable trading to beat the market

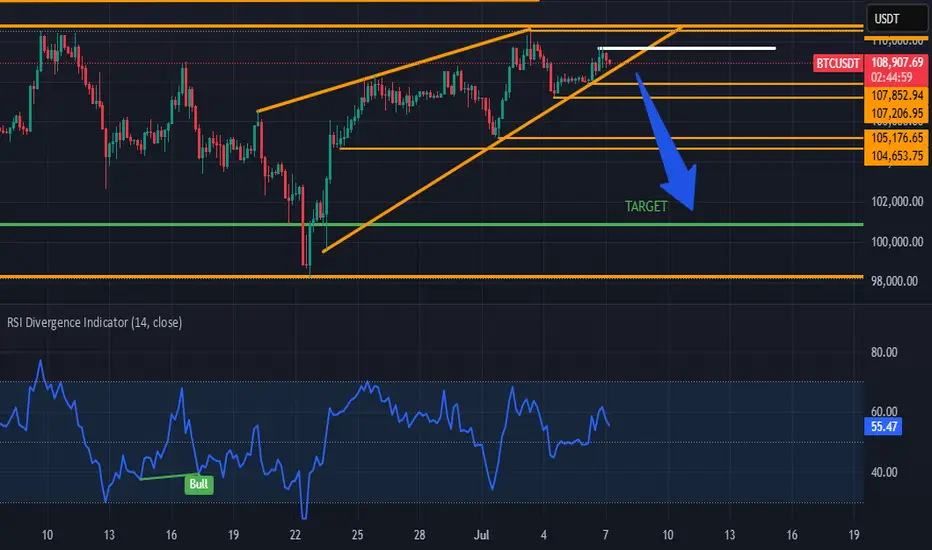
BTC IS ABOUT THE RETEST THE 100.000 RANGE AGAIN BTC is about to break out of a bearish wedge and according to the Fibonacci extension it will test the $100,000 range again! I can also analyze a bearish divergence on 1 hour chart. Good luck folks... What are your ideas on that one?
BTC - Are you the one who is long?If yes! Book, Looks like a LIQ hump trap here! Wait for 105k smooth, or let it fall to retrace up to 109,860 to initiate!

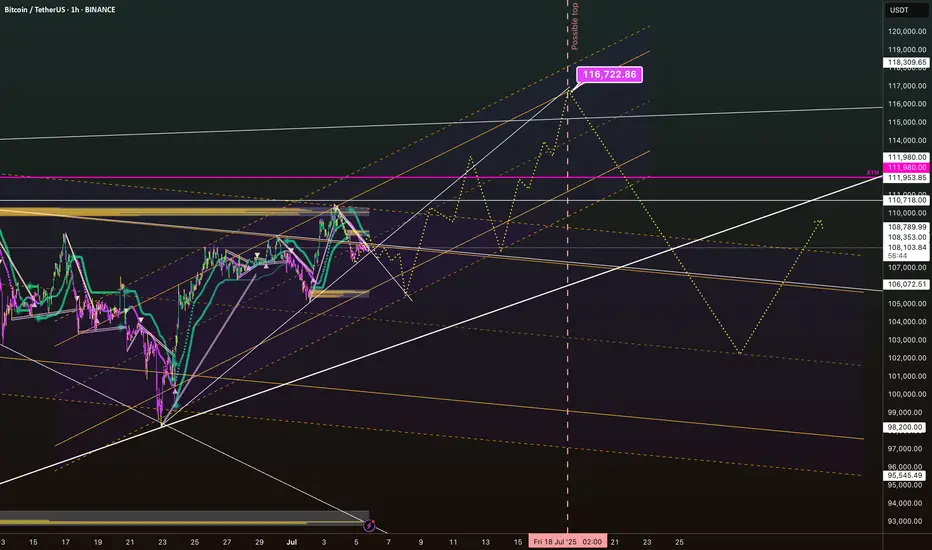
BTC/USDT July Outlook: Road to 116K or a Trap Below?The current structure shows Bitcoin consolidating after a strong bounce off the June lows. We’re now forming a potential bullish continuation pattern within a clear rising channel (dashed yellow lines), but the price is currently testing a mid-channel liquidity zone around $108,000–$110,000.
Key observations:
Local resistance zone: $111,980 (marked ATH) – a major liquidity magnet that could trigger a squeeze if broken. Support range: $106,000–$103,000 – strong confluence zone if price rejects current structure. Potential fakeout: Liquidity dip down to the $98,200–$95,500 zone is possible before a mid-July reversal (highlighted yellow path and vertical time marker on July 18).
Upside target: The upper channel boundary and projected fib confluence points to a bullish target of $116,722 by mid-to-late July.
Invalidations:
Sustained break below $95,000 could negate the bullish structure and push us into deeper correction territory.
Timing: The key date to watch is around July 18, where multiple structural lines and projection paths converge.
What’s your bias for July? Trap and rip… or stairway to 117K?
#Bitcoin #BTCUSDT #CryptoAnalysis #TradingView #LiquidityZones #BTCJulyOutlook
Final move by the bears? Bulls lining up for ATHHi traders and investors!
Buyers have reached the first target at 108,952.
On Binance spot, BTC missed the second target (110,530.17) by just 99 cents.
Is this a setup for a breakout and a run toward a new ATH?
So far, the price action looks like a level manipulation around 108,952: volume in all 3 bars interacting with this level is concentrated above it.
Just below lies a buyer zone (107,500 – 105,100).
I am watching for buyer reaction once the price reaches this area.
This analysis is based on the Initiative Analysis concept (IA).
Wishing you profitable trades!

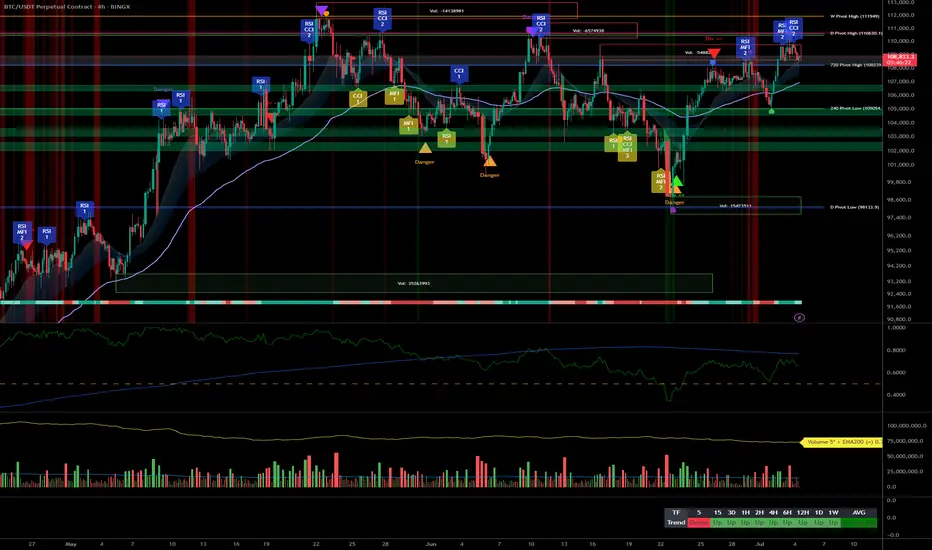
Bitcoin Analysis: Risk under 108k, aiming 111k+ in continuation__________________________________________________________________________________
Technical Overview – Summary Points
__________________________________________________________________________________
Momentum: Strong uptrend across all major timeframes (MTFTI “up”). Buyers remain in control; daily/4H/1H structure robust.
Key supports: 108,239.1 (720min Pivot, critical transversal support), 105,054.7 (240min Pivot), 99,581 (240min Pivot). Active defense seen on 108,239.1 at all timeframes.
Main resistances: 110,630.1 (1D), 110,483.1 (240min), 111,949 (W). The 110–111k area acts as the short-term ceiling.
Volume: Moderate activity, no spikes or climaxes, slight intensification noted on the 30min during key tests.
Risk On / Risk Off Indicator: “STRONG BUY” signal on all Tfs ≥30min, contributing to marked bullish momentum. Minor short-term divergence only on 15min.
Multi-TF behavior: ISPD DIV and Investor Satisfaction are neutral, no extreme behavioral stress; psychology is balanced, neither panic nor euphoria.
__________________________________________________________________________________
Strategic Summary
__________________________________________________________________________________
Overall bias: Bullish, synchronized multi-timeframes, dominant bullish liquidity.
Opportunities: Optimal long entries on validated pullback to 108,239.1, add on breakout of 110,630–111,949. Gradual partial take profit recommended in the 111k area.
Risk zones: Invalidation below 108,239.1 (confirmed H2 close), risk of further correction toward 105k then 99.5k; suggested swing stop under 108,000.
Macro catalysts: No major event, global markets stable. Geopolitical tensions monitored, low short-term impact.
Action plan: Prioritize “buy the dip” on pivots, active monitoring for any breakout/failure. Dynamic stop management, partial profit-taking on extension.
__________________________________________________________________________________
Multi-Timeframe Analysis
__________________________________________________________________________________
1D: Very strong daily structure, high momentum, intermediate supports near 98k/100.5k. Watch for major resistances at 108–111k.
12H/6H/4H: Ranging below 110–111k resistance, no fragility. Supports 108,239.1 and 105,054.7 holding, no selling pressure detected. Watch for breakout/impulse.
2H/1H: Buy zone if maintained >108,239.1, risk of sell-off below this pivot toward 105k. Price is ranging, momentum remains positive.
30min/15min: Consolidation on supports. 15min: temporary divergence on the Risk On / Risk Off Indicator but bullish structure intact unless a clean break below 108,239.1.
Risk On / Risk Off summaries: Dominant “strong buy” tone, synchronized momentum, only weak short-term divergence. No behavioral stress (ISPD DIV neutral everywhere).
__________________________________________________________________________________
Cross-analysis and recommendations
__________________________________________________________________________________
Momentum: Bullish environment sustained as long as >108,239.1. Continued upside bias if breakout above 110–111k is confirmed.
Risks: No major vulnerabilities detected. Very low probability of a local top, except in the case of exogenous macro shock.
Macro & On-chain: Stable newsflow, no distribution from HODLers or significant new inflows. Preferred strategy: swing trading in trend direction, tight stop under the main pivot.
__________________________________________________________________________________
Decision summary
__________________________________________________________________________________
Preferred scenario: Hold long >108,239.1, add on validated pullback, look for breakout with volume extension to 111k+.
Risk management: Stop under 108,000, partial profit-taking in the 110,630–111,949 area.
No immediate macro constraints: Use this calm window to ride the trend.
Monitoring: Resilience of the main support, any sudden geopolitical shocks.
BTC/USDT keeps a clear bullish bias, favoring swing or trend-following strategies as long as key pivots hold. Buy the dips remains optimal while technical structure holds; strict stop management is advised pending any “breakout fail”.