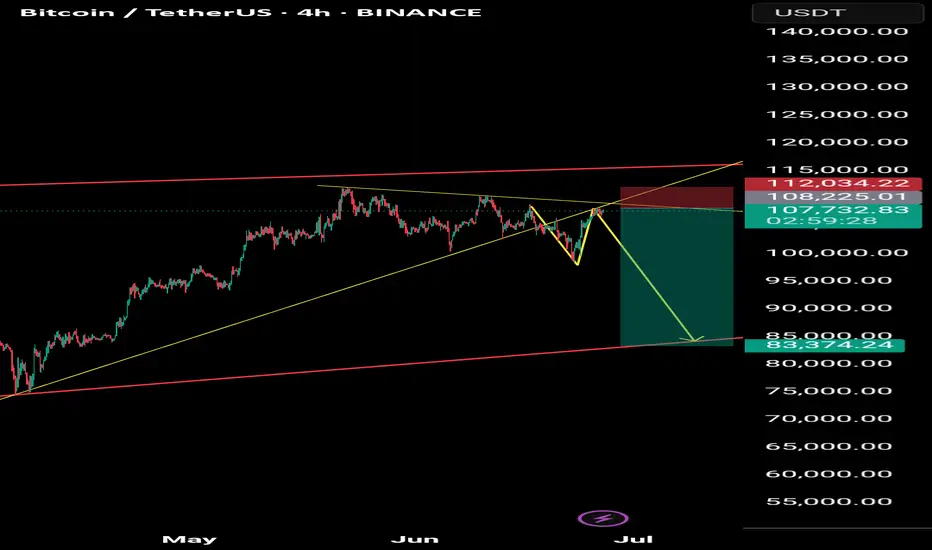
Bitcoin sell short 83000After breaking the long-term trend line and pullback, ready for a sharp move and correction to 83,000
BTCUSDT.3S trade ideas
BTCUSD I H8 CLS I Monthly OB I ATH Coming then $200KHey, Market Warriors, here is another outlook on this instrument
If you’ve been following me, you already know every setup you see is built around a CLS Footprint, a Key Level, Liquidity and a specific execution model.
If you haven't followed me yet, start now.
My trading system is completely mechanical — designed to remove emotions, opinions, and impulsive decisions. No messy diagonal lines. No random drawings. Just clarity, structure, and execution.
🧩 What is CLS?
CLS is real smart money — the combined power of major investment banks and central banks moving over 6.5 trillion dollars a day. Understanding their operations is key to markets.
✅ Understanding the behavior of CLS allows you to position yourself with the giants during the market manipulations — leading to buying lows and selling highs - cleaner entries, clearer exits, and consistent profits.
📍 +200K in play
"Adapt what is useful, reject what is useless, and add what is specifically your own."
— David Perk aka Dave FX Hunter ⚔️
👍 Hit like if you find this analysis helpful, and don't hesitate to comment with your opinions, charts or any questions.

Mastering Inverse Fair Value Gaps (IFVG) - How to use them?In this guide, I’ll explain the concept of the Inverse Fair Value Gap (IFVG), how it forms, and how you can use it to identify high-probability trading opportunities. You'll learn how to spot the IFVG on a chart, understand their significance in price action, and apply a simple strategy to trade them effectively.
What will be discussed?
- What is a FVG
- What is an IFVG
- What is a bullish IFVG
- What is a bearish IFVG
- How to trade the IFVG
-------------------------------
What is a FVG?
A FVG is a technical concept used by traders to identify inefficiencies in price movement on a chart. The idea behind a fair value gap is that during periods of strong momentum, price can move so quickly that it leaves behind a "gap" where not all buy and sell orders were able to be executed efficiently. This gap creates an imbalance in the market, which price may later revisit in an attempt to rebalance supply and demand.
A fair value gap is typically observed within a sequence of three candles (or bars). The first candle marks the beginning of a strong move. The second candle shows a significant directional push, either bullish or bearish, often with a long body indicating strong momentum. The third candle continues in the direction of the move, opening and closing beyond the range of the first candle. The fair value gap itself is defined by the price range between the high of the first candle and the low of the third candle (in the case of a bullish move), or between the low of the first candle and the high of the third (in a bearish move). This range represents the area of imbalance or inefficiency.
-------------------------------
What is an IFVG?
An Inverse Fair Value Gap (IFVG) occurs when a traditional Fair Value Gap (FVG) is not respected by price, and instead of acting as a support or resistance zone, price breaks through it with strength. Normally, a Fair Value Gap represents a price imbalance left by a strong move, and when price returns to this area, it often reacts by respecting the gap, bouncing off it or reversing, because it's seen as a high-probability level where orders may rest.
However, in the case of an IFVG, price does not respect this imbalance. Instead, it slices through the FVG in the opposite direction, showing that the initial momentum behind the imbalance has weakened or reversed. This breach is a strong indication that market sentiment is shifting. What was once a zone of strength now becomes invalid, and this failed reaction signals that the opposite side of the market (buyers or sellers) has taken control.
The IFVG highlights a key transition in momentum. It tells traders that the prior bias, bullish or bearish, is breaking down, and the new dominant force is pushing price beyond levels that would typically hold. This makes the IFVG useful not only as a sign of failed structure but also as a potential confirmation of a trend reversal or strong continuation in the opposite direction. Essentially, where an FVG usually acts as a wall, an IFVG is what’s left after that wall gets knocked down.
-------------------------------
What is a bullish IFVG?
A bullish Inverse Fair Value Gap (IFVG) occurs when price breaks through a bearish Fair Value Gap (FVG) instead of respecting it. In a typical bearish FVG, the expectation is that when price retraces into the gap, it will react to the imbalance, usually by reversing lower, as the area represents previous selling pressure or inefficiency caused by aggressive sellers.
However, when price does not react bearishly and instead breaks cleanly through the bearish FVG, it signals a shift in market sentiment and momentum. This breakout through the imbalance suggests that buyers are now in control and that the bearish pressure in that zone has been absorbed or invalidated. What was once considered a resistance area is now being overpowered, often leading to continued bullish movement.
-------------------------------
What is a bearish IFVG?
A bearish Inverse Fair Value Gap (IFVG) occurs when price breaks through a bullish Fair Value Gap (FVG) instead of respecting it. In a normal bullish FVG, the expectation is that when price returns to the gap, it will act as support and prompt a move higher, as this area represents a previous imbalance created by strong buying pressure.
However, when price fails to respect the bullish FVG and instead breaks down through it, this signals a shift in momentum to the downside. The anticipated support fails to hold, suggesting that buyers are no longer in control or that their efforts have been overwhelmed by aggressive selling. This kind of move transforms the bullish FVG into a bearish signal, as it confirms weakness in what was previously considered a demand zone.
-------------------------------
How to trade the IFVG?
Trading the Inverse Fair Value Gap (IFVG) requires patience, precision, and clear confirmation of a shift in momentum. The process involves waiting for key conditions to form before entering a trade. Here's how to approach it step-by-step:
First, you need to wait for a liquidity sweep. This means price must take out a recent high or low, typically a short-term liquidity pool, trapping traders on the wrong side of the market. This sweep sets the stage for a potential reversal and indicates that the market is ready to shift direction.
After the liquidity sweep, watch for a 1-minute Fair Value Gap (FVG) to form and then get broken in the opposite direction. This break is crucial, it’s what creates the Inverse Fair Value Gap. The invalidation of this initial FVG confirms that momentum has switched and that the market is no longer respecting the previous imbalance.
Once the IFVG has formed, your entry comes on the close of the candle that breaks and closes beyond the IFVG, above it in a bullish scenario, or below it in a bearish one. This close confirms that the gap has not held and that price is likely to continue in the new direction.
Place your stop loss below the low (for a bullish setup) or above the high (for a bearish setup) of the structure that formed the IFVG. This gives you protection just beyond the level that would invalidate the setup.
-------------------------------
Thanks for your support.
- Make sure to follow me so you don't miss out on the next analysis!
- Drop a like and leave a comment!

Bitcoin Technical Analysis | The Most Important Channel 📊 Bitcoin Technical Analysis | The Most Important Channel You’ll Ever See!
This might be the most critical BTC chart you come across. I've mapped out the key ascending channel that has defined Bitcoin’s long-term trend over the past few years. The upper boundary, lower boundary, and especially the midline have repeatedly acted as dynamic support and resistance levels.
Right now, BTC is trading near the channel top, with strong bullish momentum. While the buying pressure remains high and a breakout is possible, watch out for potential rejections or fakeouts around this area.
All major support and resistance levels are clearly marked in this chart. Make sure to draw this channel on your own chart and use it as a powerful tool in your trading decisions.
🧠 Follow for more high-probability setups, smart technical insights, and real-time updates!

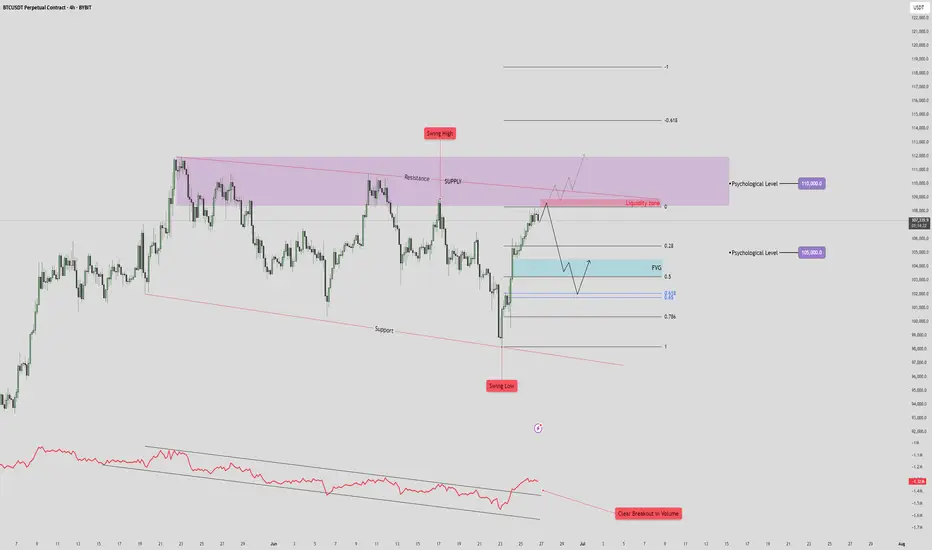
BTC/USDT Drop to 101k?🧠 High Time Frame Context
Trend: Consolidation within a broad range (support and resistance clearly defined).
Key Psychological Levels:
105,000 USDT – minor level, acting as a magnet in short-term PA.
110,000 USDT – major supply confluence and liquidity target.
🟪 Supply & Resistance Zone
Zone: Marked in purple (108.5k-112k).
Key Observation:
Swing high formed inside this zone, indicating liquidity trap.
Potential fake-out or strong rejection from this area.
Strong confluence with a descending resistance trendline, adding to the selling pressure.
🔵 Fair Value Gap (FVG) & Retracement Targets
FVG identified just below the current price (~103.5k-104.5k).
Price is projected to:
Reject from the current high.
Drop to fill the FVG zone.
Possibly bounce between FVG and Fibonacci retracement levels:
0.5
0.618
0.786
🔴 Volume & RSI Divergence
Volume breakout is noted on the last push down (bottom red annotation), followed by a retrace.
OBV shows bullish divergence with price:
🔻 Support Structure
Lower red trendline is a key long-term support.
Previous swing low aligns with this trendline – buyers showed strong interest here.
If FVG fails to hold, expect a retest of this trendline near 97,000–98,000.
📈 Likely Scenarios
Base Case (Neutral-Bearish):
Price rejects current zone (~107,000).
Pullback into FVG (101–104K).
Bounce to 105K (minor resistance), then decide next direction.
Bullish Breakout:
If price breaks and closes above 110K, it invalidates supply zone.
Opens door to 115–118K range.
Bearish Breakdown:
Fails FVG zone.
Tests previous swing low and support (~97K).
Below that, structure becomes macro bearish.
🧩 Summary
Short-Term: Retracement into FVG likely. Monitor reaction.
Medium-Term: Bearish bias while price is below 110K.
Invalidation for bears: Clean break and hold above 110K.
110k soon , best time to buy altcoins Btc still didnt complete main wave 5 , btc for last time touch 98k but this time price will attack 110k and then we will have NATH.

Bitcoin: Trading Scenarios and Multi-Time Frame Analysis Bitcoin: Trading Scenarios and Multi-Time Frame Analysis
In this video, I break down all the key scenarios currently unfolding for Bitcoin.
The price is approaching a critical zone and is likely to make a decisive move soon.
While I believe a downside move remains the more probable outcome, all possibilities are still on the table.
You may watch the analysis for further details!
Thank you and Good Luck!
❤️PS: Please support with a like or comment if you find this analysis useful for your trading day❤️

How to Tell BITCOIN is BULLISH using MOVING AVERAGES OnlyBTC is trading sideways and it sparks a lot of debate whether or not we are at the beginning of a new bearish cycle, or if there is still a push upwards waiting to happen.
Here's how you can use the Moving Averages to determine whether or not BTC is bullish.
Don't miss this update on my stance on the market and why I think ALT Season is waiting:
______________________
BINANCE:BTCUSDT

Bitcoin Roadmap: Key Levels to WatchBitcoin( BINANCE:BTCUSDT ) managed to pump as I expected yesterday , of course, the main catalyst could have been the ceasefire announcement between Iran and Israel , which had a major impact on high and medium risk assets in the financial markets .
Bitcoin is once again moving near the Heavy Resistance zone($110,720-$105,820) and the Resistance zone($107,520-$106,100) after breaking the Resistance lines .
In terms of Elliott Wave theory , it seems that given Bitcoin’s bullish momentum , Bitcoin has completed the main wave 3 and is currently completing the main wave 4 on the 1-hour time frame . The corrective wave structure of wave 4 could be a Double Three Correction(WXY) .
I expect Bitcoin to start rising again near the Support zone($104,380-$103,060) , 50_SMA(Daily) , Support lines , and Cumulative Long Liquidation Leverage($104,412-$103,812) to rise at least to the Potential Reversal Zone(PRZ) and Resistance lines .
Note: Stop Loss(SL)= $102,600 = We can expect more dumps.
Please respect each other's ideas and express them politely if you agree or disagree.
Bitcoin Analyze (BTCUSDT), 1-hour time frame.
Be sure to follow the updated ideas.
Do not forget to put a Stop loss for your positions (For every position you want to open).
Please follow your strategy and updates; this is just my Idea, and I will gladly see your ideas in this post.
Please do not forget the ✅' like '✅ button 🙏😊 & Share it with your friends; thanks, and Trade safe.

BTC: One More Leg Down?
I believe the impulse BINANCE:BTCUSDT BITSTAMP:BTCUSD BINANCE:BTCUSDT.P from April to May has been completed, and we are currently in a correction phase, which is likely to continue for some time.
In the base case, I’m considering a simple zigzag pattern:
Wave A – impulsive move down
Wave B – forming a symmetrical triangle
Wave C – expected next
🎯 Target zone: 97,500, where we have a confluence of weekly FVG, 20-week MA, and vWAP.

Wednesday, Trade of the day 📊 Wednesday Trading Update
Tuesday didn’t give us any tangible plays — price action was choppy, unconvincing, and mostly noise. But that’s behind us. Let’s see what Wednesday brings, especially with London and NY sessions ahead.
Midweek is notoriously volatile for BYC, and historically, Wednesday has often been the day that breaks the range or gives us a proper deviation setup — so eyes sharp today 👀.
My trades today will stick to standard range plays, nothing forced. We're still sitting above 4H supply, and unless we get a clean breakout with structure shift, I’ll remain cautious and reactive, not predictive.
Here’s what I’m watching today:
👉 Look for clear market structure shifts on the LTF (lower timeframes)
👉 Divergences can give early signs if you're using oscillators
If I get time, I might record a quick session later. No promises, but I’ll update if that changes.
🎥 If you're unsure what to look for, go back through the video archive — everything you need has already been broken down in detail.
📅 Weekly Schedule:
Wednesday – ❌ No class
Thursday – ❌ No class
Friday – ❌ No class
Let’s stay sharp — volatile Wednesdays tend to reward patience and precision.

BTC's Mid 2025 OutlookBitcoin is currently trading around $107,000 on the 4-hour 4H timeframe, navigating a consolidation phase following a sharp rally that culminated in a new all-time high of $111,900 in May 2025. Despite recent price corrections, BTC remains up 3% on the week, reflecting underlying bullish momentum. This sustained strength hints at continued confidence in the market, particularly among larger players.
A notable development supporting this view is the increase in the number of Bitcoin wallets holding at least 10 BTC, which has surged to a three-month high of 152,280. This metric is widely regarded as a proxy for whale activity and may indicate renewed institutional interest, especially amid accelerating inflows into spot Bitcoin ETFs.
On the 4H chart, Bitcoin appears to be consolidating within a tight range, hovering just beneath a key supply zone at $107,000, which could act as short-term resistance.
Several potential outcomes are currently in play:
Bullish scenario:
A breakout above the $107,000–$108,000 range could clear the path toward the critical resistance at $115,000. A successful move above this threshold would likely signal resumption of the broader uptrend, with some technical analysts eyeing a potential cup and handle formation that could project long-term targets up to \$180,000
Bearish scenario:
If BTC fails to hold above the current level, it may correct toward the first major support at $102,800, with further downside risk to $98,500. In a more pessimistic setup, price could extend losses toward $96,000, especially if macroeconomic or geopolitical pressures intensify
Key levels to watch:
Resistance: $107,000 - $115,000
Support: $102,800 - $98,500 - $96,000
Market Sentiment and External Drivers:
Bitcoin's price is being shaped not only by technical dynamics but also by powerful external forces
Spot Bitcoin ETFs:
The US regulatory greenlight for spot ETFs has dramatically altered market dynamics. With projections of $190 billion in assets under management AUM for these products by the end of 2025, institutional access to BTC has become more streamlined, providing strong tailwinds for long-term accumulation
Geopolitical risk and macro conditions:
Global uncertainty, particularly due to escalating tensions in the Middle East and potential US military involvement, has introduced volatility. At the same time, rising inflation and economic instability in developed markets is a double-edged sword, either undermining risk assets or conversely boosting Bitcoin’s narrative as digital gold and a hedge against fiat devaluation
Forward-Looking Outlook:
Bitcoin is at a critical juncture. The ability to sustain above $107,000 and reclaim the $115,000 resistance will be pivotal. A confirmed breakout could open the door to price discovery and possibly a surge toward $130,000 to $150,000, with $180,000 as an extended target in more bullish scenarios
However, a failure to hold key support levels could shift momentum toward the bears, prompting a deeper correction toward the $96,000 zone. Traders should monitor:
- Price reaction around $107,000 and $115,000
- ETF inflow data and AUM growth
- Macro news especially inflation reports and central bank commentary
- Developments in global conflict zones impacting risk appetite
Conclusion:
Bitcoin’s medium-term direction hinges on a delicate interplay of technical consolidation institutional flow and macro geopolitical signals. While the bullish structure remains intact for now a decisive move in either direction above $115,000 or below $98,000 could set the tone for the next major trend.

Bitcoin - Bounce Incoming or Breakdown to 97.5k?Market Context
Bitcoin recently swept the 100k lows, clearing out built-up liquidity beneath that level. This move formed a strong reaction candle, suggesting interest from buyers and confirming the presence of resting demand. The sweep aligns with the concept of smart money targeting obvious liquidity pools before shifting direction. It also marks a potential short-term low, at least temporarily.
Short-Term Structure and FVG Setup
Following the sweep, price tapped into a clean 1H fair value gap and has been respecting it so far. This is our immediate line in the sand. As long as this gap holds, we’re dealing with a scenario of temporary bullish order flow. The market structure on lower timeframes suggests the potential for a short-term rebound, possibly into the inefficiencies left above.
Upside Target and Gap Fill Potential
If price continues to hold the 1H FVG, we could see a push higher that targets unfilled gaps above, particularly the one where we saw a clean rejection previously. There’s a clear inducement just above recent highs, so a sweep of those could be used to fill that imbalance. This would align with the idea of running internal liquidity before reversing or stalling at supply.
Bearish Breakdown Scenario
On the flip side, if price breaks down from the 1H FVG without reclaiming structure, the entire bullish idea invalidates. In that case, I expect price to gravitate back toward the 97.5k zone. This would be a logical area for deeper mitigation and potential reaccumulation, especially since it sits below the current consolidation. The failure to hold the gap would signal weak demand and continuation of the broader bearish leg.
Scouting Liquidity and Price Flow
Right now, the main idea is tied to how price behaves around the short-term 1H FVG. That is the pivot. Hold it, and we should see some form of liquidity run into the unfilled gap above. Lose it, and the next wave of downside should unlock, pushing us closer to 97.5k. Either way, liquidity remains the core driver in both directions.
Conclusion
Price has swept major downside liquidity and is now reacting to a key imbalance. As long as the 1H fair value gap holds, I expect short-term upside targeting unfilled inefficiencies and internal highs. A failure to hold would shift the bias back to the downside, with the 97.5k range as the next probable draw on liquidity.
___________________________________
Thanks for your support!
If you found this idea helpful or learned something new, drop a like 👍 and leave a comment, I’d love to hear your thoughts! 🚀

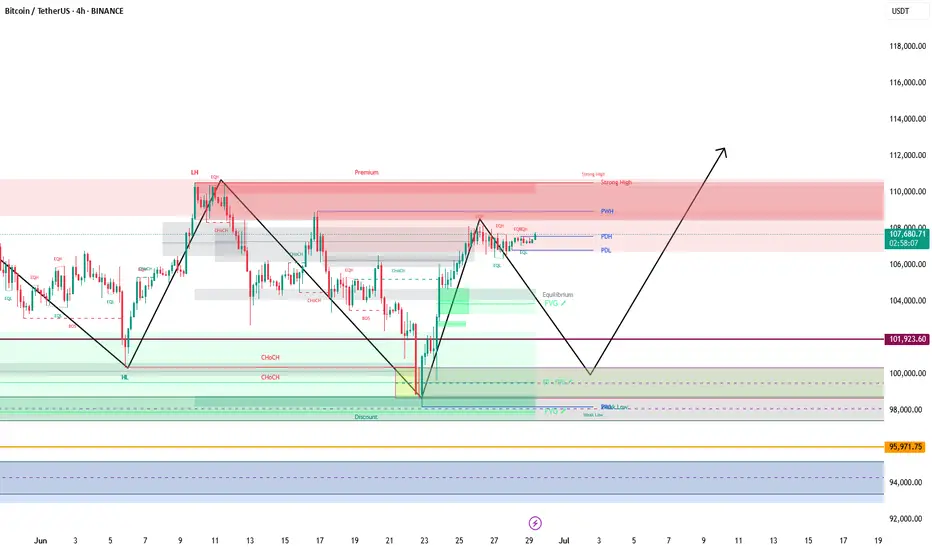
BTC/USDT Trade Setup – Lord MEDZStrategy: Goldbach Fair Value Gap + Smart Money Concepts (SMC)
Timeframe: 6H
Bias: Long
Trade Parameters
Entry: 102,577
Stop Loss: 99,527
Take Profit: 118,153
Risk to Reward: Approximately 5:1
Confluences and Justification
Price is expected to retrace into a clear Fair Value Gap (FVG) formed after displacement, aligning with the Goldbach model.
The structure confirms a completed reaccumulation phase, presenting a high-probability long setup.
This would complete the right shoulder of the classic inverse head and shoulders pattern, with the shoulder projected to dip into the POI. Head and shoulders patterns are often manifestations of Wyckoff accumulation or distribution phases, for those who may not be aware.
Liquidity left inside the gap provides inducement, increasing the likelihood of a sweep into the 102.5K zone.
The take-profit target at 118,153 aligns with the high of the Goldbach Fibonacci extension level.
Execution Plan
Wait for price to return to the FVG zone around 102,577. Look for confirmation such as a bullish displacement candle, a lower time frame BOS (break of structure), or mitigation of a lower time frame order block. Upon confirmation, execute long with a stop below 99,527. Take profit is set at 118,153.
Final Note from Lord MEDZ
"I await the return of price to imbalance. The reaccumulation is complete, and the alignment is clear. Entry shall be taken where inefficiency remains, and profit shall be claimed where liquidity awaits."

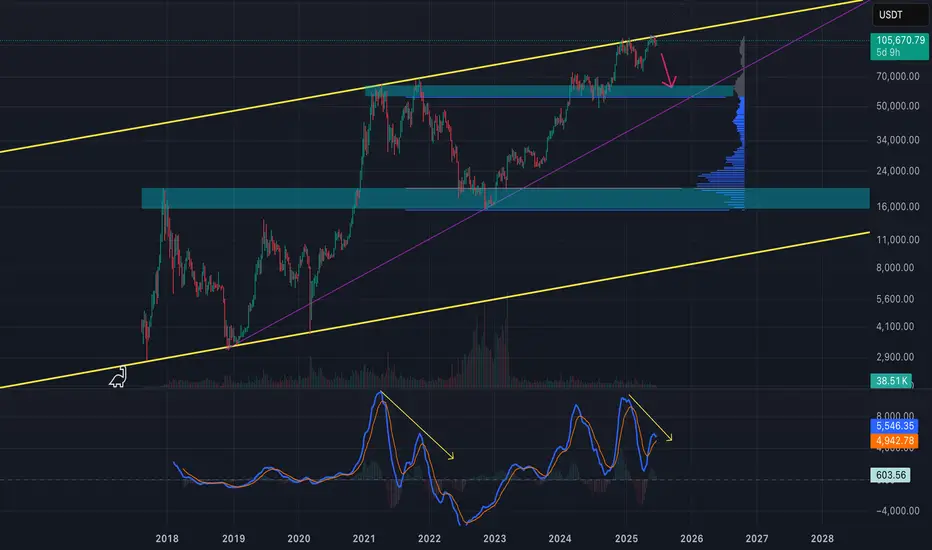
BTC - Getting 2021 Double Top/Bearish VibesLooking at the weekly chart for BTC, I'm seeing similar price action from when we double topped in 2021. We hit the top of the channel, corrected, and then had a slightly higher high before going down hard. Again we hit the top of the channel, had a strong correction, only to hit it again for a slightly higher high. But the signs of market weakness are showing in the indicators and price action. Not to mention war is looming between Israel and Iran. I'm taking a defensive posture here. I think if the bears take control, we could hit the $60k liquidity area that we missed on the last correction. We can reassess the market better at the time based on the price action and current events.
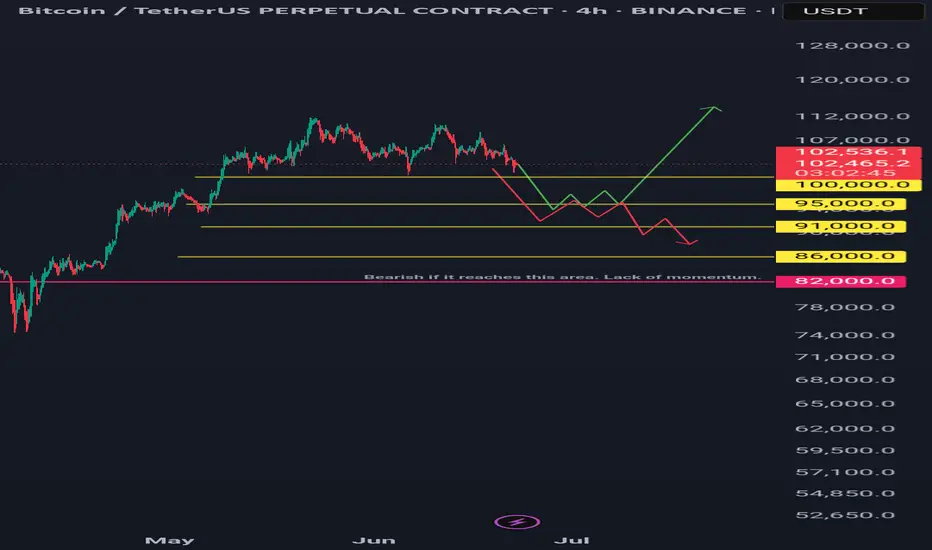
Btcusdt 4hr tf scenarios.Two scenarios: green and red lines.
Green Line: A bounce and sustained recovery above the 100-day and 200-day daily moving averages is bullish.
Red Line: A bounce followed by a lack of momentum and a break below a previous low is bearish.
Long Horizontal Red Line: If the price reaches this area, it could signal the start of a downtrend unless new bullish fundamentals emerge.
My Point of View (POV): I am bearish, primarily due to the ongoing war, similar to the conflict that began between two other countries a year ago.
However, it's important to note that every crisis and recession has historically presented a buying opportunity for institutions and 'whales.' Therefore, be prepared with funds for dollar-cost averaging (DCA), then simply hold and forget. It is recommended to conduct backtesting and research to identify optimal buying areas. DCA is key. Only invest money you can afford to lose.
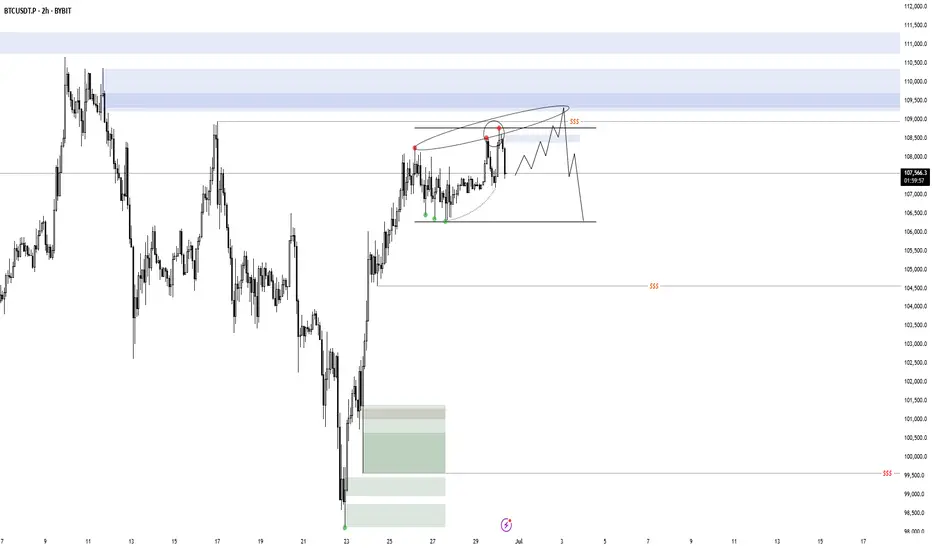
BTC 30.06.25So far BTC is behaving exactly as expected, i'm just waiting for a valid setup to appear. I would love to see a model 1, which takes out the high and mitigates supply, but i'm also not ignoring a potential model 2. These 2 deviations merge together on a higher time frame, where the range is also valid on, so they can be counted as one. There are many altcoins with similar behavior and USDT/C in potential accumulation. I'm waiting to see confirmations/ invalidations.
BTC/USDT – Intraday Plan (15m, Ichimoku) by RiscoraToday’s idea:
I’m expecting a retracement to the 107,867 level as a pullback to the recent impulse. The move we observed earlier aligns with my prediction from last Friday — liquidity was taken out above the highs, and now I anticipate a deeper correction against the overall bullish move.
My main scenario for the day is a move down into the 106,400 area at minimum, targeting the liquidity below.
Ideally, I’d like to see a push to 107,870 first, as that would provide the best entry for a short setup. I’m willing to open a short in that scenario, but it’s important to remember the higher timeframe trend remains bullish, so any short should be approached with caution.
Key levels:
Retracement target: 107,867
Main downside target: 106,400
Cautious shorting only — trend still bullish overall
Let’s see how the price develops. Will update if conditions change.
#BTC #Crypto #Trading #Ichimoku #Riscora

Bitcoin Update 25.06.2025 —Altcoins, Top Altcoins Choice & MoreGood morning my fellow Cryptocurrency trader, I hope you are having a nice week and a wonderful day.
We have good news to start today and it is all based on Bitcoin's price action. This is going a bit deep on the daily noise, price swings.
Price action analysis
Bitcoin went deep on its sideways range and tested below 100K. This is normal for a sideways market. The positive news comes from the fact that Bitcoin is once more trading above $106,000 and already hit above $107,000. This type of action reveals a bullish bias.
If the market was mainly bearish with a major drop on the deck, say going below 90K or 80K even, then Bitcoin would not be allowed to go beyond $105,000. In fact, any bounce or small recovery would be quickly sold as bear would be active, waiting and selling each time prices move up.
The fact that Bitcoin can grow day after day and consume all selling pressure while doing so, reveals a strong presence from buyers. We know this to be true because Bitcoin is now in a new phase in its evolution and growth cycle. It is truly a young technology that only now is being fully accepted with plenty of room available for growth.
We have three instances where Bitcoin moved above 110K. The selling that happened afterward is not filled with pressure, instead you can see some standard candles as prices continue to consolidate.
On the other hand, notice the last session from 21-June (21-24 June —3D candles). You can see a long lower shadow, a bullish hammer; there was definitely strong buying pressure as soon as Bitcoin reached below support.
Altcoins market action
Some altcoins continue to produce multi-months high. The highest price since January 2025. These altcoins recovered, started to rise and continue rising in clear, standard bull market fashion. Literally straight up.
Some altcoins did even better and grew as high as December or November 2021. The highest price in almost four years. This is very important when we go deep into the chart and price action because it is the main revealing signal. The altcoins simply do not go on a major bull market before a market crash. If the altcoins are recovering or rallying, it is because the market is set to "buy." The Cryptocurrency market is in bullish mode.
If the market was set to drop long-term then we would be experiencing a rise that is running out of momentum. This rise would later peak and a surprise sudden flash crash would signal the start of a major downturn. This is not what we see.
Inversely, if prices are going to rise strongly we start by seeing some form of retrace or correction, this event losing momentum and volume and then finally a strong bullish jump as soon as support is confirmed. This bullish jump would signal the start of a major market move. This is what we are experiencing today.
Bitcoin & Altcoins
Bitcoin and the altcoins move together. Bitcoin leads the altcoins, the altcoins reveal what Bitcoin will do when the action is sideways.
We can always say that Bitcoin is leading the altcoins of course because Bitcoin has been growing non-stop since November 2022. The major trend being bullish the altcoins are set to follow at some point.
Now, when Bitcoin goes sideways, by definition, anything goes. The market can break-down just as it can break-up. This is where the altcoins become useful.
If smaller Cryptocurrency projects are moving ahead, strongly and even producing 3-4 multi-year highs, it reveals what Bitcoin will do once its consolidation period ends.
Buying Bitcoin
In short, Bitcoin is going up. The next major market move is a rise and we have proof coming from the signals, the altcoins and the charts.
Never again in its history Bitcoin will trade below 80K. 90K soon to be gone... Once the action starts, you will look like a genius for buying below $110,000.
What to choose: Bitcoin or altcoins?
Now, my personal suggestion is different. If you are not a whale, the way to go are the altcoins. Why? Because there is more room for these to grow. We can say that the altcoins are riskier, but risk is almost non-existent with spot. We can simply focus on the pairs that have been filtered by the major exchanges. Reputable pairs with a long track record and plenty of room available for growth. You can't go wrong with those.
If you are ready for the 2025 bull market, leave a comment below.
Altcoins analysis by request
I think it is time for a new Your Top Altcoins Choice, session. It is always wise to do these when the market hits bottom or before a major bullish wave, that's exactly where we are now. If you agree and would like to see a new session, leave a comment saying "Yes! Top Altcoins Choice." If there is enough interest we can work together and find many hidden gems. It can be done with your support.
Namaste.

Trade of the day - Tuesday!📊 Tuesday Trading Update
As we saw yesterday, the market reacted uncharacteristically to global events — we witnessed some interesting volatility, to say the least ⚡. While there’s still plenty of opportunity to capitalise on, today is a new day, and here are the trades you should be watching like an eagle 🦅.
Most setups today are continuation plays, especially considering we SFP’d the range low and failed to close below 100.3 on the daily. Did we get a bearish close on the LTF? Yes — so we must tread with caution ⚠️.
We're currently sitting at 4H supply, which makes it a juicy spot for a range deviation play — hence my single short 📉. However, if we continue to purge this zone, a continuation long could come into play, targeting the previous demand range.
I doubt I'll be having a class later today. If I get the time, I’ll record a quick session — but if not, here’s what you should be looking for to enter this trade:
👉 A clear change in market structure on the LTF. Or a divergence if you use oscillators
Not sure what that means? Go back and scour through the older videos — it’s all there 📚.
📅 Weekly Schedule:
Wednesday – Potential class
Thursday – ❌ No class
Friday – ❌ No class

btc my weekly analysis for the btc move insha allah btc shows as big opportunity dirrection toward sell or bear position at the price of 99k
2/1/15I promised to update the idea of what will happen with the graph in the future. At 22 cm, we should now fall down.

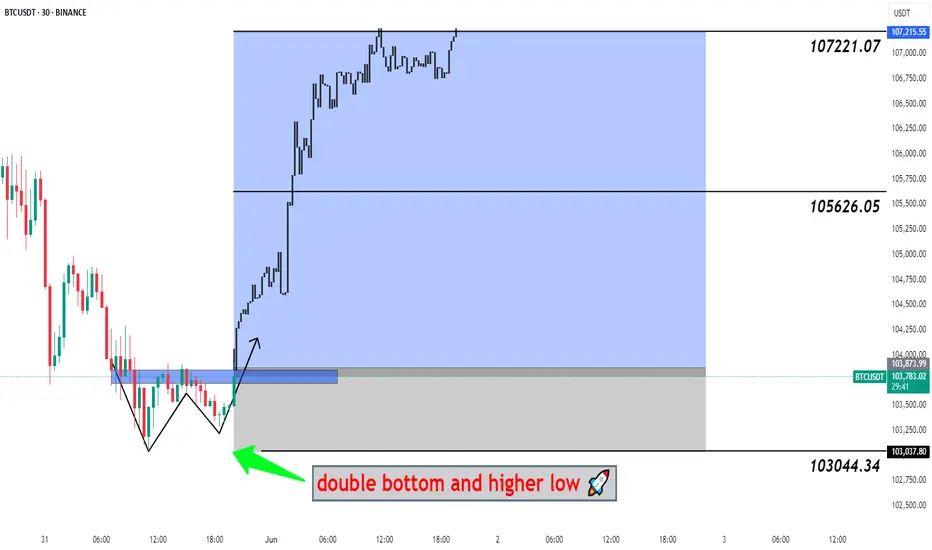
#BTCUSDT Big Pump Next Hour - Bitcoin, BTCUSD, BTCUSDT 📉 Double Bottom Pattern Forming – Potential Reversal Setup
The current price structure is showing signs of a Double Bottom – a classic bullish reversal pattern. After an extended downtrend, this pattern suggests that the market may be preparing for a trend reversal from this key demand zone.
🔹 Trade Setup
Entry, Targets, and Stop Loss (SL) are marked on the chart.
Entry: Upon breakout confirmation above the neckline.
Stop Loss: Just below the recent swing low to manage downside risk.
Targets: Calculated using the measured move method from the bottom to the neckline .
🔹 Risk & Money Management (Professional Approach)
To maintain consistent profitability and protect capital, strict risk management is essential. For this setup:
🔸 Position Sizing: Based on a fixed % of total capital (typically 1–2% of account equity per trade).
🔸 Risk-to-Reward Ratio: Minimum of 1:2, ideally higher.
🔸 Stop Loss Discipline: No arbitrary changes after entry. SL only adjusted for breakeven or trailing stops once price moves favorably.
🔸 Trade Management: Secure partial profits at key levels, trail stops as structure forms.
🔸 Capital Allocation: Avoid overexposure. Trade fits within overall portfolio strategy.
💬 Let the setup come to you. React, don’t predict.
🔁 Like, comment, or share your thoughts below!
BINANCE:BTCUSDT BITSTAMP:BTCUSD COINBASE:BTCUSD BINANCE:BTCUSDT.P INDEX:BTCUSD CRYPTOCAP:BTC.D CRYPTO:BTCUSD BYBIT:BTCUSDT.P BINANCE:BTCUSD