Bitcoin Breakout Incoming? Flash PMI & CME Gap in FocusBitcoin ( BINANCE:BTCUSDT ) started to fall ( about -4%) after the news that the US was involved in the Middle East tension , but it has risen again with good momentum .
Do you think Bitcoin will go below the previous bottom($98,200) again on the 1-hour time frame?
Bitcoin is trading in the Resistance zonezone($102,130-$100,700) and near the Resistance lines .
In terms of Elliott Wave theory , it appears that a Double Three Correction(WXY) has been completed near the Potential Reversal Zone(PRZ) . Also, the first 5 microwaves of the Impulsive have now been completed .
---------------------------------
Bitcoin traders should monitor today’s Flash Manufacturing (expected 51.1) and Services PMI (expected 52.9) . Both forecasts are already lower than last month’s figures (51.3 and 54.8) , but I see a chance they come in even weaker.
Why weaker PMI is likely?
Slowing retail sales and softer labor data point to reduced consumer demand.
High interest rates are starting to pressure both the production and services sectors.
Regional Fed surveys already showed a cooling in business activity.
If the PMI prints below expectations, the market may anticipate a more dovish Fed, pushing the dollar( TVC:DXY ) down and giving Bitcoin a potential bullish boost.
---------------------------------
I expect Bitcoin to move towards filling the CME Gap($103,730-$102,275) after breaking the Resistance lines , and if the Resistance zone($104,380-$103,060) is broken, we should expect further increases.
Cumulative Short Liquidation Leverage: $103,391-$103,934
Cumulative Long Liquidation Leverage: $100,800-$100,250
Cumulative Long Liquidation Leverage: $97,691-$97,241
Note: Increased tensions in the Middle East or new and important news surrounding this news can make the analysis invalid, so be more careful with capital management.
Note: If Bitcoin can touch $98,170 , we can expect more dumps.
Please respect each other's ideas and express them politely if you agree or disagree.
Bitcoin Analyze (BTCUSDT), 1-hour time frame.
Be sure to follow the updated ideas.
Do not forget to put a Stop loss for your positions (For every position you want to open).
Please follow your strategy and updates; this is just my Idea, and I will gladly see your ideas in this post.
Please do not forget the ✅' like '✅ button 🙏😊 & Share it with your friends; thanks, and Trade safe.
BTCUSDT.3S trade ideas

Bitcoin Bullish But... Support Zones (Incl. Altcoins)Bitcoin is bullish right now but we know things can change. As long as the action is happening within the blue and gray space, all is good, the bullish bias remains intact. If the action moves below the gray zone and enters the orange zone, this is the danger zone. This danger zone can turn into a buy opportunity or a wait and see approach.
On the other hand, if Bitcoin remains above the blue zone this is ultra-bullish short-term. This is specially bullish for the altcoins but it is bullish for Bitcoin as it reveals consolidation at high prices, but right now we have a lower high so anything goes.
The chart is mixed when looked at up-close. Bullish long-term and on all bigger timeframes. Corrections tend to develop from high prices.
One more thing to consider
When we look at the action short-term we can miss the bigger picture, we can become clouded with noise. The bigger range is $100,000 - $110,000, this is the new long-term support zone that is being established and created before additional growth. Bitcoin can remain here for weeks or even months, if this happens, the altcoins will continue to grow.
We are in a bull market. Bitcoin is obviously in a bull market as it is trading near its all-time high after years of growth. The altcoins are just getting started after years of sideways action... Some altcoins hit new all-time lows but still part of a broad, long-term consolidation phase. Many produced higher lows, some produced lower lows, it makes no difference.
The bear market ended in mid/late 2022 and the ensuing two years we had mix growth. Bullish waves and bearish waves, with the usual variations of course.
The year is now 2025 and Bitcoin is up, most of the big projects have been growing for years now and we are getting close to the final advance, the major fifth wave and the bull market bull run. When this happens, close to its end, all the smaller projects will produce the biggest growth in their history and this will be the boom that will catapult Crypto to take over the financial world.
It won't be the first time this event happens nor the last, the market will continue to fluctuate.
I know there is a lot of information out there and we can become uncertain with every drop, but look at the price; what do you see? Bitcoin is going up.
The altcoins are set to follow, the altcoins do what Bitcoin does.
Namaste.

Sharing the advanced Bollinger Bands strategyHere are the Bollinger Band trading tips: *
📌 If you break above the upper band and then drop back down through it, confirm a short signal!
📌 If you drop below the lower band and then move back up through it, confirm a long signal!
📌 If you continue to drop below the middle band, add to your short position; if you break above the middle band, add to your long position!
Pretty straightforward, right? This means you won’t be waiting for the middle band to signal before acting; you’ll be ahead of the game, capturing market turning points!
Let’s break it down with some examples:
1. When Bitcoin breaks above the upper Bollinger Band, it looks strong, but quickly drops back below:
➡️ That’s a “bull trap”—time to go short!
2. If Bitcoin crashes below the lower band and then pops back up:
➡️ Bears are running out of steam—time to go long and grab that rebound!
3. If the price keeps moving above the middle band:
➡️ Add to your long or short positions to ride the trend without being greedy or hesitant.
Why is this method powerful?
It combines “edge recognition + trend confirmation” for double protection:
1. Edge Recognition—spot the turning point and act early.
2. Trend Confirmation—wait for the middle band breakout and then confidently add positions!
You won’t be reacting after the fact; you’ll be ahead of the curve, increasing your positions in the trend’s middle and locking in profits at the end. This is the rhythm of professional traders and the core logic of systematic profits!
Who is this method for?
- You want precise entry and exit points.
- You’re tired of “chasing highs and cutting losses.”
- You want a clear, executable trading system.
- You want to go from “I see the chart but don’t act” to “I see the signal and take action.”
Follow for more. Make sure to like this if you found it useful.

BTC next boom beginning I'm going to see boom in btc
Here’s the analysis of Bitcoin’s (BTC) next expected move in English, based on current market conditions and technical indicators:
---
### **1. Short-Term Outlook (Next 24-48 Hours)**
- Bitcoin is currently trading around **$107,400**, with **$108,000-$109,000** acting as a strong resistance zone.
- If BTC breaks above **$109,870** and closes above it, the next target could be **$114,950**.
- If the price fails to break resistance, a pullback to **$105,300** or **$103,900** (support levels) is possible.
- The **30-minute RSI is at 52.22** (neutral-bullish), and the MACD histogram is in positive territory.
---
### **2. Medium-Term Outlook (1 Week to 1 Month)**
- **Coincodex predicts**:
- **$116,914** (+8.98%) by July 2025.
- **$136,858** in the next 3 months.
- **DigitalCoinPrice forecasts**:
- Average price of **$221,961** by late 2025, with a potential high of **$235,354**.
---
### **3. Key Technical Indicators**
- **4-Hour Chart**:
- BTC is testing the **upper Bollinger Band ($108,672)**. A breakout could target **$114,956**.
- **Support Levels**:
- Immediate support: **$105,358** (EMA 100).
- Strong support: **$103,996**.
---
### **4. Market Sentiment**
- The **Fear & Greed Index** is currently at **74 (Greed)**, indicating bullish sentiment but also potential overbought conditions.
- **Volume**: Stable buying volume suggests sustained interest, but a drop could signal consolidation.
---
### **5. Potential Scenarios**
- **Bullish Case**: Break above **$109,870** → Rally toward **$114,950-$116,000**.
- **Bearish Case**: Rejection at resistance → Drop to **$105,300-$103,900**.

Waiting for the Liquidity Flush – Will We Get That Drop or a StoCurrently holding a short position and have been waiting for a decent liquidity flush towards my TP zone for almost a day now. The thing that bothers me is how slow the price action is—it's grinding lower, but at the same time, building up a new liquidity shelf just above my entry.
This makes me concerned that we might see a quick liquidity sweep to the upside (taking out stops, possibly including mine) before any real move down happens. The area around my TP is loaded with liquidity, but the market seems hesitant to make that push.
What’s your opinion—are we likely to get that clean drop soon, or should we brace for a fake-out and stop hunt first?

Why BTC hasn’t moved up recentlyBTC has been bobbing above and below this bearish triple crossover the past few months. What we see as consolidation is rather price getting stuck around these resistance levels.
The only reason why this would be occurring in my view, is due to the market makers having intention to allow this drop to play out.
The resistance is located at around 107,000 to 107,400 - watch this zone closely for a hold below / rejection and fast drop.
Scenario 1 marked with solid red line.
Scenario 2 marked with dotted red line.
Little update for y’all. Happy weekend trading.

Bitcoin Recovers...What we've learned in the past few years is that Bitcoin's demand is just too strong. Retraces and corrections are no longer wild like before, these are limited and capped. Nobody wants to take the risk of selling too much and being left out or losing their Bitcoins for good, they are just too valuable. Many times more valuable than the USD Dollar or Gold. It is the most valuable asset in the whole digital world.
Other than food and toilet paper, nothing is more valuable than Bitcoin.
Technical analysis
Ok, let's focus on the chart.
The retrace has been ongoing for 31 days, since 22-May.
Total drop amounts to 12.33% (-12%).
The action moved below the 5-June low around $100,400. Bitcoin is now back above this level. Clearly showing that this is a stop-loss hunt event.
Stop-loss hunt and liquidity hunt because thousands, if not millions, of over-leveraged traders have been liquidated. They were betting on the wrong side short-term. Long-term yes, bullish is the trend, the direction and the win. Short-term, it was SHORT but not anymore.
Never trade with 20X that's crazy. Imagine going LONG 20X at the all-time high? Isn't that stupid?
I can bet you the same people didn't want to buy LONG when Bitcoin was trading at $75,000. In fact, I can bet that these people that just got liquidated were selling below $80,000 and buying LONG with 20X at $110,000. A recipe for disaster.
Anyway, I am calling it early. This is it, we are going up.
I got my signals, as you already know, from the altcoins.
If you agree boost and follow.
Thanks a lot for your continued support.
Namaste.

Another visit to $95,000 for Bitcoin?Looking at the price action of Bitcoin it appears to be moving in a descending channel formation. Usually this results in one of two outcomes. Either it breaks out, or it doesn't. And if it doesn't then it's most likely back down to the lows of the channel.

Bitcoin Reclaims Momentum: War Fears Fading, Bulls Eye $125K! MARKETSCOM:BITCOIN just delivered a powerful bounce right off the critical $100K level. A key psychological and technical support zone tested multiple times in recent sessions. This time, the bounce came with strong volume confirmation, signaling renewed buyer interest. As geopolitical tensions in the Middle East begin to ease, market confidence is returning, fueling bullish sentiment across the board.
CRYPTOCAP:BTC now looks poised to retest the $110K resistance zone, where some short-term rejection could occur. However, a decisive breakout above $110K opens the gates for a potential rally toward the next major target at $125K. Stay sharp, always manage your risk, and don’t forget to set a proper stop loss. The trend is strong, and momentum is building!
Follow Our Tradingview Account for More Technical Analysis Updates, | Like, Share and Comment Your thoughts
BITCOINBINANCE:BTCUSDT.P Team bearish are not showing any signs of slowing down breaking every barriers. on these post i shared analysis on what i think that BTC is going to do next. All the best.

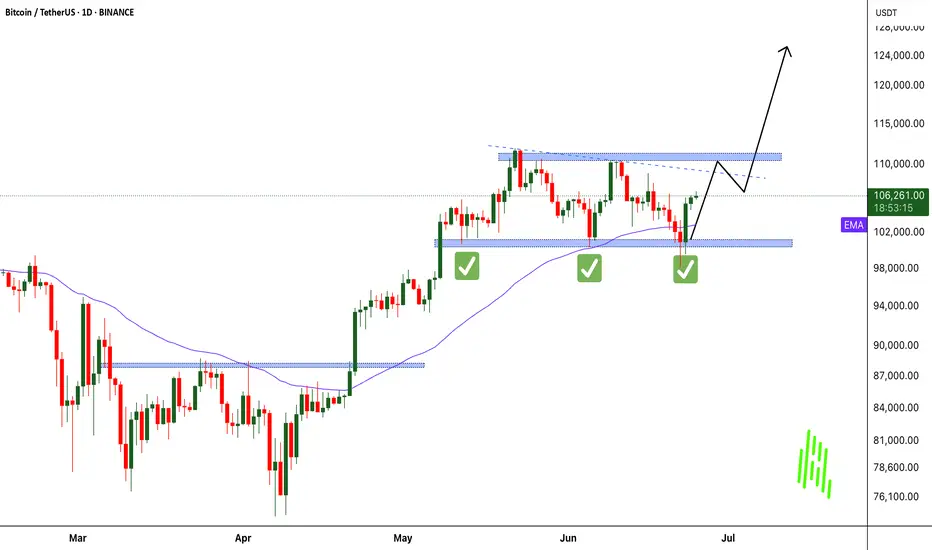
BTCUSDT – Rebound from trendline, targeting 115,300On the daily chart, BTCUSDT has bounced from a confluence support zone around 105,200, where the rising trendline meets the FVG, confirming that the bullish structure remains intact. The current price pattern suggests a continuation of the uptrend, with a short-term target at the 115,300 resistance zone — a level that has previously rejected price multiple times.
If this level is broken, momentum could extend toward the 120,000 area in the medium term. As long as the price holds above the trendline, the bullish outlook remains valid.
On the news front, market sentiment is improving as Bitcoin spot ETFs in the U.S. show signs of renewed inflows, coupled with growing expectations that the Fed might pause rate hikes due to recent signs of economic weakness.

Bitcoin Will Continue Rising —Long-Term Chart —$200,000+ New ATHIn November 2021, the week after the all-time high was a crash. The weeks that followed were a continuation and the market went full red and didn't stop dropping until November 2022, a year later.
In May 2025, the week after the all-time high is neutral, sideways. Four weeks later and Bitcoin continues sideways consolidating near resistance, ready to break to new highs and continue rising.
Market conditions now are very, very different compared to 2021. Right now, we are only halfway through the current bull market, for Bitcoin, and we have room left available for plenty of growth.
In a matter of days, maybe 5-6 days, we get a new all-time high and this means not the end of the bull market but the start of the next and final bullish wave.
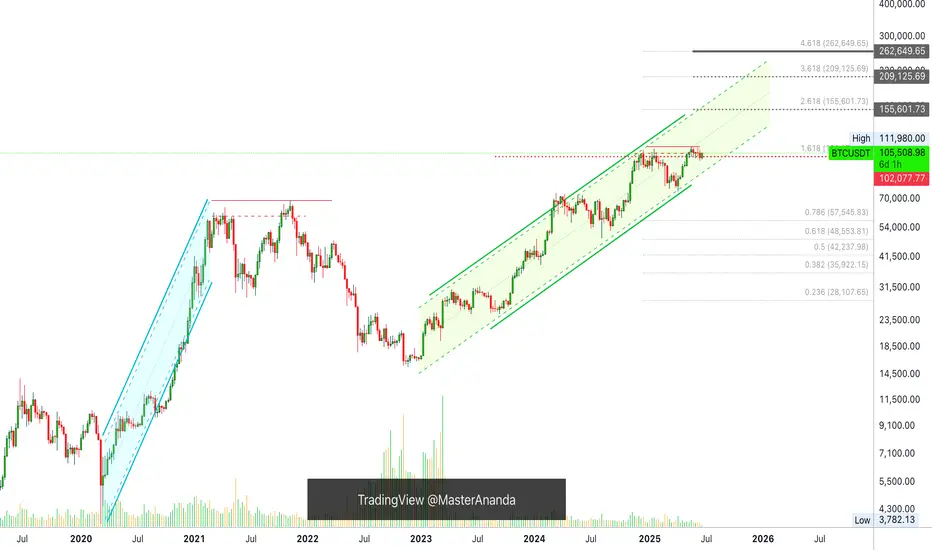
These targets on the chart are the most accurate of all numbers because they are based on almost 5 years of data.
Next target and minimum price for Bitcoin in the coming months is $155,601 but we know there is likely to be more, much more. With the institutional wave now in full force, banks opening to crypto because they have no other choice and the world evolving faster than anything we thought possible, we are aiming for $200,000 or more.
The next relevant level after $155,600 is $209,125. Which one is your target for this new 2025 all-time high?
Do you think Bitcoin will peak in late 2025 or early 2026?
Do you think you will manage to be successful in this round or are you bound to make the same mistakes? Over-trading, over-leverage, no being patient enough; not waiting for the right time to enter and not selling when the market is trading very high, greed; What will it be?
Do you think you have what it takes to succeed? You do!
Even if you made mistakes in the past or even if you are already doing good, you have what it takes.
If you are doing bad, this experience can be used to improve your game. If you are doing great, great, let's do better. There is never enough growth; we are happy, we are grateful but we accept abundance because we receive abundance thanks to hard work.
It is still very early but the market is starting to heat up. Once the bullish action starts, there is nothing that can stop us. The world will change for us. We will adapt to all market and geopolitical conditions, we will continue to improve and evolve.
The best one is not the one that makes no mistakes but the one that can extract learning from all experiences. Success is not being right all the time, success is never giving up.
Will you give up? Or, will you continue to trade long-term?
» Bitcoin is going up!
Namaste.
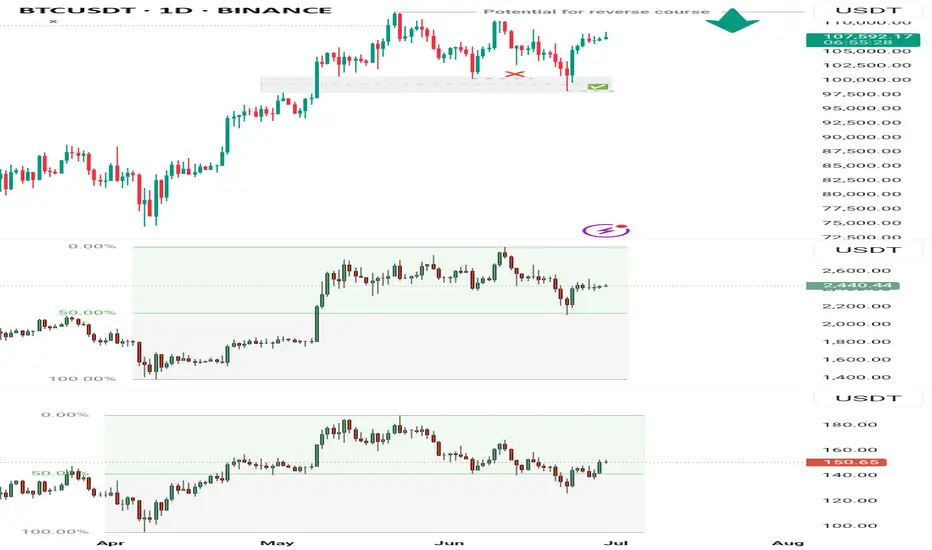
BTCUSDT Market Outlook (Daily Chart)BTC’s failure to rally into a new all-time high (ATH) from the June 5th low can be attributed to the fact that price wasn't coming from a true discount zone. Similarly, key correlated assets like ETH and SOL also hadn’t reached their respective discount levels at that point. This misalignment created an unbalanced market structure, which necessitated a corrective move to realign broader market pricing.
Now that both ETH and SOL have tapped into their discount zones and shown signs of recovery, the conditions are more technically sound to project a potential ATH for BTC in the coming weeks or month. However, on a broader scale, this current rally could serve as a liquidity trap — drawing buyers into a high before distribution.
As for now, any sudden price drop should be seen as a potential buying opportunity into the anticipated new ATH. But caution remains key — any strong sell signal or reversal confirmation near the ATH zone could trigger a significant selloff as sellers regain control.
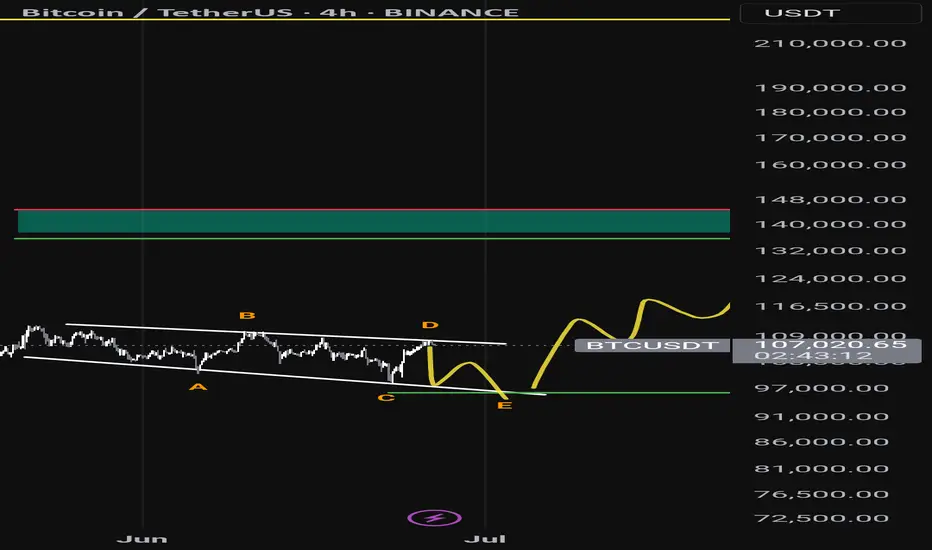
BTC to sweep liquidity?4 Hour Analysis:
- Market moving out consolidation phase (Accumulating late buyers)
- May sweep the 1st buyside liquidity (see chart)
- Or may sweep the ATH above the 1st buyside liquidity (see arrow on the right of the chart)


$btc/usdt short swing sh set upth:
sh htf liq + htf sh fib (1.136/1.272) + anti cypher harmonic pattern

Bitcoin Offensive plan for S/R, risk-on scenario confirmed__________________________________________________________________________________
Technical Overview – Summary Points
__________________________________________________________________________________
Momentum : Strong across all timeframes, driven by the Risk On / Risk Off Indicator (“Strong Buy” bias from 1D to 1H).
Key Supports : 98–100k remains the crucial zone to defend. Interim supports at 103.6k and 106k.
Major Resistances : 107–110k critical cluster, intermediate resistance at 108.2k.
Volume : Normal to moderately increasing volumes on all timeframes, short-term spike at 15min (caution warranted).
Multi-TF behavior : No signs of euphoria or capitulation except for 15min (behavioral overheating & high volume detected).
__________________________________________________________________________________
Strategic Summary
__________________________________________________________________________________
Structural bias : Strong bullish, confirmed by technical and sector data.
Opportunities : Pullback entries at 107–107.5k, trend-following plans on validated breakouts >108.2k/109.9k.
Risk zone : Major break under 106k then 103.6k = invalidation, watch for seller excess (ISPD)/extreme volume on 15min.
Macro catalyst : No major event expected; wait & see climate, caution around Middle East geopolitical headlines.
Action plan : Buy support, monitor breakout/volume, stop-loss below 106k then 99k.
__________________________________________________________________________________
Multi-Timeframe Analysis
__________________________________________________________________________________
1D – 12H – 6H : Durable bullish structure, price capped below 107–110k, momentum confirmed by Risk On / Risk Off Indicator (“Strong Buy”), no volume climax, healthy volume. 98–100k supports remain crucial.
4H – 2H – 1H – 30min : Aligned uptrend, no sell signals. Pullbacks absorbed at 103.6–107.5k pivots. 108.2k–109.9k breakout is pivotal, volumes healthy outside 15min.
15min : Emerging behavioral excess (ISPD = Sell), very high volume → risk of short-term overheat, avoid chasing without validation.
Summary : Bullish multi-timeframe confluence, but caution on ultra-short-term excess and geopolitical news flow.
__________________________________________________________________________________
Synthesis & Strategic Plan
__________________________________________________________________________________
Directional bias : Structurally bullish on all higher TFs, supported by Risk On / Risk Off Indicator, MTFTI, no major alert signals.
Action scenarios :
Buy pullback at 107–107.5k, SL below 106k (Swings) or below 107k (Scalps).
Confirmed breakout (vol./no behavioral excess) above 108.2–109.9k, targets >110k.
Risk/invalidation : Any break under 106k then 103.6k then 99k = bullish bias neutralized.
Risk management : Take partial profits on 109–110k extensions; avoid persistence if ISPD turns red & volumes spike on lower TFs.
Fundamental & on-chain factors : No macro catalyst, healthy consolidation, $99k–$100k on-chain supports decisive, breakout requires new inflows.
Decision summary:
Bias = Bullish, buy supports and validate breakouts with volume, watch for 15min excess and Middle East headlines. Strict SL below 106k/103.6k, risk-off below 99k. Partial profit taking on 109–110k extension. No immediate macro catalyst.

LONG BTC TILL 129,000Hi, I am expecting BTC to continue its uptrend with little fluctuations till 129K. Can go more till 140K but would be needing confirmation before we long again.
DISCLAIMER: ALL MY SHARED IDEAS ARE ONLY FOR EDUCATIONAL PURPOSES. I AM NOT RESPONSIBLE FOR YOUR ANY PROFIT OR LOSS.

BTC 26.06.25This could be the range i was waiting for to create the 3rd tap of the accumulation model later. Yesterday we had a mini model 1 at NY open which could have had the intention to be the starting point of the new range. I am now watching for new deviations which then would form a bigger range. There is nothing but liquidity until 104.536$ which would be a perfect target for a range low, but until there are no confirmations this only is an expectation. If the accumulation model is already complete, like i mentioned in my last post, then the target becomes the range high (110.652$).

BTC Key levelsBTC key levels are below
These are very important levels for reversals and breakouts.
111, 898
97,893
89,362
74, 538

Today's BTC trading strategy, I hope it will be helpful to you Four Bullish Drivers Behind Bitcoin's Rally
(1) Institutional Capital Rampage: From Whale Holdings to Market Scarcity
- **BlackRock et al. as anchor investors**: BlackRock's Bitcoin ETF (IBIT) has ballooned to $71.9 billion, holding 660,000 BTC—equivalent to 3.1% of total circulating supply. Such "whale-level" positions not only provide liquidity support but also shatter traditional financial institutions' attitude toward crypto.
- **Accelerating OTC concentration**: OTC platform data shows Bitcoin inventory plunged from 166,500 coins at the start of the year to 137,400 coins, a 17.5% drop. This signals massive coins are shifting from exchanges to institutional custody, creating a "scarcity effect" analogous to apple prices surging due to supply shortages.
(2) Fed Rate Cut Expectations Ignite Hot Money Inflows
- **Policy pivot-driven capital reallocation**: After Fed Governor Bowman signaled a possible July rate cut, CME futures now price in two 2025 rate cuts (up from one). Historical parallels: Bitcoin surged 42% in 6 months post-Fed's first 2019 rate cut (S&P 500 +12%), as low rates enhance Bitcoin's appeal as a "non-sovereign asset".
- **Diminishing opportunity costs**: A potential Fed rate cut would lower real yields (nominal rate - inflation). If 10-year Treasury real yields fall from 2.3% to 1.5%, the opportunity cost of holding gold/Bitcoin declines, pushing funds from bonds into risk assets.
(3) Regulatory Gate Opening: Chinese Brokerage Breaks New Ground
- **Guotai Junan International's milestone**: On June 24, Hong Kong's SFC approved its virtual asset trading services, making it the first Chinese-funded brokerage to gain such. This opens a "compliant channel" for mainland capital—post-announcement, its HK shares surged 101%, while OTC Bitcoin inventory dropped by 3,000 coins, indicating institutions are front-running liquidity inflows.
- **Financial infrastructure upgrade**: The service allows clients to trade BTC via traditional securities accounts, lowering entry barriers. Analogous to Chinese brokerages accessing gold ETFs in 2013, such channels typically trigger explosive incremental flows, expected to attract $1-2 billion from family offices initially.
(4) Technical "Golden Cross" Confirms Long-Term Trend
- **Key moving average resonance**: BTC recently completed a 50-day MA (102,300 USD) cross above 200-day MA (94,700 USD), forming a "golden cross". Backtesting 2019 and 2020 instances, this pattern preceded 58% average 6-month gains, though short-term pullbacks (10-15%) are common (e.g., June 2023 post-cross correction).
- **Strong support forming a safety net**: The 200-day MA now acts as dynamic support—pullbacks to ~95,000 USD would represent a "secondary buying opportunity at institutional cost bases", similar to housing prices finding support when breaking below moving averages.
Today's BTC trading strategy, I hope it will be helpful to you
BTCUSDT BUY@106000~107000
SL:105000
TP:108000~109000

BTCBtc was trading inside falling wedge since a weak. it has cleared it now and has very good possibility of pumping hard to 112k
