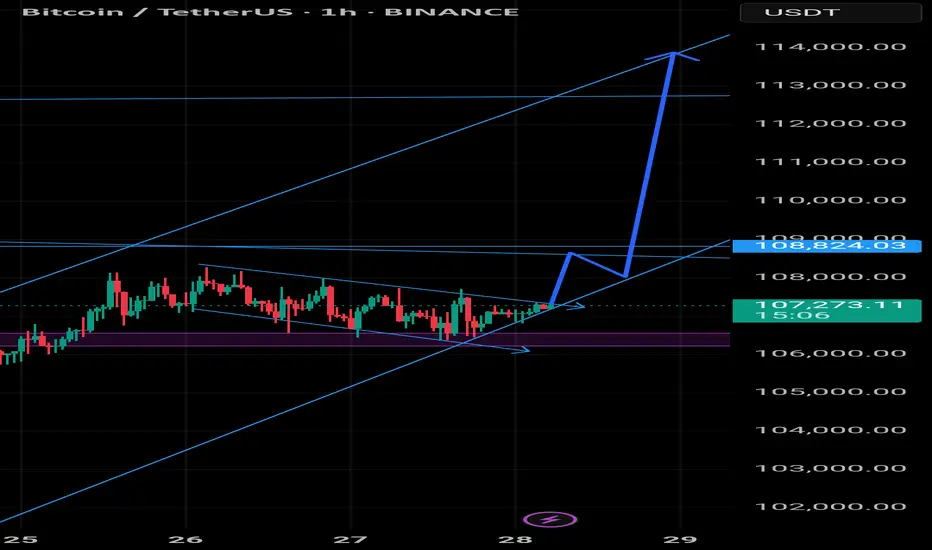
Bitcoin Next Move These are the two levels I am currently looking at to trade.
If we sweep the local high at 109k then we will be trading into a zone of supply as well which is good confluence in terms of a setup, most important is going to be the reaction of price off of that level.
My higher probability setup will be around the 111k level as that is where we have multiple sets of Poor highs and it is closer to the range high. I always prefer trading near the extremities of the ranges for higher probability setups.
I would also consider a long from 103k if we get a fast flush into that level but I prefer 101-102s to long as that is at the range low.
Note:
1. Always observe reaction at key levels before entry to avoid forced trades.
2. Maintain disciplined stop loss placement especially near supply sweeps and flush longs.
3. Prioritize setups at range extremes (102k or 111k) for optimal entries aligned with your edge.
BTCUSDT.3S trade ideas

Btc usdt 1-3-6-12 mouthAnalysis of Bitcoin's movement for the near future. For 1-3-6 months. Based on candlestick and technical analysis

Once again a perfect time to enter a short
As we are closing in to key resistance area we can see that we are getting a lot of smaller bodied 4H candlesticks. This is indicating a weak buy side and that we are looking to top out!
We also got overbought on the hourly RSI and the MACD has flipped bearish
Combining a crocodile tooth shaped formation taking form on the 15min, a rejection from the downward sloping trend line (third rejection indicates strong trend line) and that we are looking to reverse at key resistance. I entered a 100x short at 106375.
As I am writing we also got in another confirmation on the hourly timeframe. As we can see we got a nice bearish engulfing candlestick.
I think the chart speak for itself. We are about to go down big time!

PRICE SPECULATION ON BTCUSD!Price updates from the H1 timeframe . Price is likely to drop from the current high after we saw a distribution stage currently forming, therefore, a sell opportunity is envisaged.

Btcusdt A break above the trend line could lead to a potential run up in BTC price but a break below the purple support could lead to a drastic drop in price
BITCOIN PRICEACTION TRADING STRATEGIESBitcoin’s price is influenced by macroeconomic factors, including U.S. inflation trends and institutional adoption (e.g., Bitcoin ETFs with $138B in assets). Its volatility remains high, with 10% daily moves possible, driven by 24/7 trading and sentiment shifts. Recent recovery from a dip below $102,000 was tied to geopolitical tensions, but macro signals suggest a risk-on environment supporting further gains.
Outlook: Bitcoin is at a critical juncture, with technical indicators leaning bullish but resistance at $108,000 posing a challenge. A decisive breakout above $108,950 could signal a move toward $111,000-$115,000, failure to hold this level will retest 100k$ level or below.and below 100k could turn bearish .

BTC Flips Bullish Above $104k — 1D 50EMA & OB Cluster HoldCRYPTOCAP:BTC | #4h
Price reclaimed 1D 50EMA & $104k after a clean bounce from 1D FVG ($98k).
As long as $104k and the 4h OB cluster hold, lower targets are off the table.
Maintaining bullish bias toward $106k+.
Lose $104k? Bull plan is invalid, reassess for lower.

Bitcoin ready for new ALL TIME HIGHS.I think a breakout from this region is closer than people think.
Break of structure to the upside on the daily already occured . Order block is holding nice . A fvg has formed and a retest could occur , around 103.4k- 104.5k.
Overall the chart is bullish.
Next week we might see new All Time Highs.

BTC - LONG SET-UPBINANCE:BTCUSDT
Bitcoin is currently testing its critical resistance level
If the price gets rejected here, the key support to watch is the $𝟏𝟎𝟏,𝟐𝟎𝟎 - $𝟏𝟎𝟐,𝟖𝟎𝟎 zone. This area represents a strong demand level where a potential buying opportunity could emerge.
For a trade setup based on this support, a strategic Stop Loss (SL) should be placed below the $𝟗𝟖,𝟎𝟎𝟎 mark to manage risk.
For now, patience is crucial. Keep a close eye on the price action

UNEXPECTED RISK CRASH FREE FALL AFTER TREND DATA FOR TH NEXT 48HDepending on our study, BTC has a high chance of a new crash below 100K.
The next 48 hours are important for the trend change of BTC, which can allow the trend to free-fall below 100K
BTC is at a top, and it did recovery always recovered on the M volume top., We are now again on the same trend.
BTC can return below 100K as this update shows, with the possibility of targeting the main target 85K - This is the trend zone for new interest.
The reason for this crash is that BTC has not confirmed the cycle, which means the end of the cycle. There is always possibility that the market can act green, but we expect it can show an unexpected breakdown.

BTCUSDT 1D📈 #BTC Plan for July – Bullish Setup in Play
Bitcoin is forming a bull flag pattern on the daily chart — a classic setup that often leads to strong upward continuation when confirmed.
🔹 Key Indicators
• MACD is building positive momentum
• RSI is holding above 50
• Price is trading above the MA50 and the Ichimoku Cloud, indicating strong underlying support
📍 Strategy
We're buying here and will consider adding more near the key support zone:
$98,200 – $99,613
📈 Potential breakout targets (on confirmation):
🎯 $112,471
🎯 $116,880
🎯 $121,288
⚠️ Reminder
Always use a tight stop-loss and apply proper risk management.
Breakout confirmation with volume is crucial.

HolderStat┆BTCUSD aiming for 112kBINANCE:BTCUSDT is forming a bullish continuation structure after bouncing from the mid-range. With support holding and consolidation patterns completing, price action suggests a rally toward the 115,000 resistance line. Triangle and consolidation behavior confirms a strong uptrend continuation setup.

#BTC/UST#BTC
The price is moving within a descending channel on the 1-hour frame, adhering well to it, and is on its way to breaking it strongly upwards and retesting it.
We are seeing a rebound from the lower boundary of the descending channel, which is support at 106,000.
We have a downtrend on the RSI indicator that is about to break and retest, supporting the upward trend.
We are looking for stability above the 100 moving average.
Entry price: 106,600
First target: 106,750
Second target: 107,000
Third target: 107,291

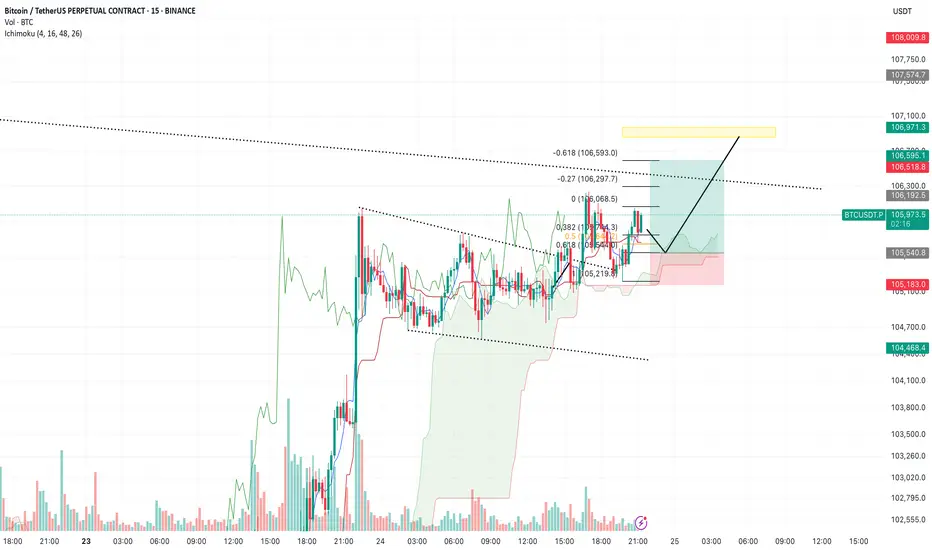
BTC/USDT – Update & New Plan (15m, Ichimoku)Previous idea recap:
Bulls proved stronger than expected — we didn’t get the move down to 104,000 as anticipated. Instead, price rallied directly to the 106,300 block, as outlined earlier, and saw only a brief pullback.
Current outlook:
Buyers remain in control here. My new base case is a move towards 106,900 (yellow liquidity block). Ideally, I’d like to see a quick dip to the 105,550 area first, which would set up a strong launch for the next leg higher into the key liquidity zone.
Watching how price reacts on minor pullbacks — still expecting buyers to step in and push us to 106,900 where significant liquidity is stacked.
Key levels:
Minor support: 105,550
Main target: 106,900 (yellow block)
Bulls remain in control above 105,550
Will update if conditions change.
Bitcoin sell short inter:115000Bitcoin needs to reach the 114,000-115,000 range and a daily time frame divergence and drop to the 84,000-50,000 range.

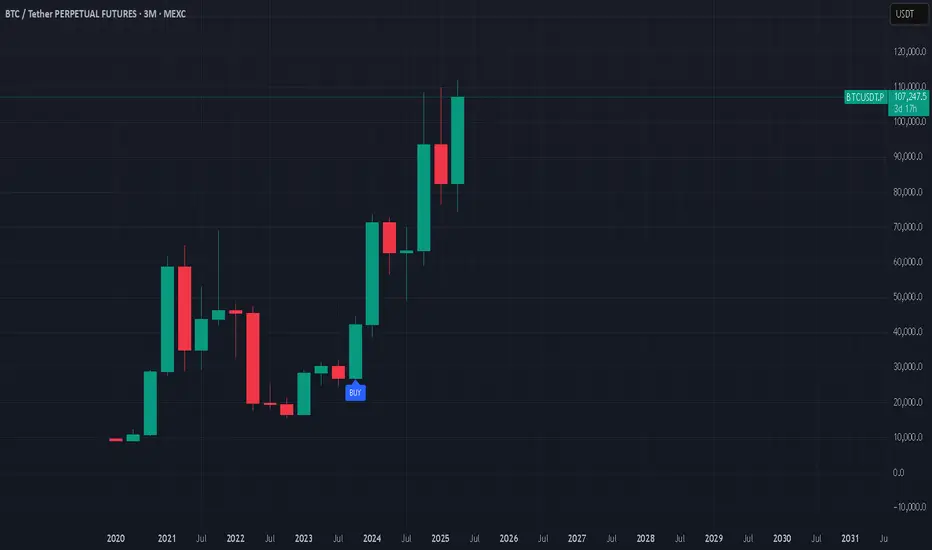
Called The Bottom GuysThem: "How did you call the start of the Rally?"
Me: ...
#crypto #bitcoin #trading #portfolio

Bitcoin possible sell idea Bitcoin appears to be losing momentum, with buying pressure easing. This could signal a short-term selling opportunity as the market enters a correction phase.

Bitcoin - overview with Initiative AnalysisHey traders and investors!
📍 Context
On the daily timeframe, the market is in a sideways range.
The boundaries are marked with black lines.
Buyer initiative is currently active.
Targets: 108,952; 110,530; 111,980.
📊 Key Actions
The seller attempted twice, on increased volume, to break down below the range, but both times the buyer brought the price back inside. Only seller wicks remained below the lower boundary.
🎯 Trade Idea
🔹 Look for long setups from 105 500 -104,622 or the 103,400–100,718 zone.
There is no context for short trades at the moment.
This analysis is based on the Initiative Analysis concept (IA).
Wishing you profitable trades!

Can #BTC continue to rise?📊Can #BTC continue to rise?
🧠From a structural perspective, we started to rebound after being very close to the ideal target area of the bearish cup-handle structure, and broke through the downward trend line, which means that the correction phase is over.
➡️So next we need to pay attention to the long trading opportunities after the pullback. At present, this position belongs to the contradictory range. It can continue to rise, but it will be very uncomfortable if we chase the rise. So wait patiently for trading opportunities after the pullback. We can pay attention to the neckline support area (102000-103000).
➡️If there is no pullback, but it continues to rise, then the resistance near 106500 is also worth our attention. This is the support-resistance conversion area that has been tested many times.
🤜If you like my analysis, please like 💖 and share 💬
BITGET:BTCUSDT.P

BTC - 108k?BTC looks it has power to go more up, remember the more it goes up the more shorts are active, but 108,500 good look for shorts as well!

bearish engulfing candleA bearish engulfing candle is a two-candlestick pattern in technical analysis that suggests a potential reversal of an uptrend to a downtrend. It consists of a small bullish (white or green) candlestick followed by a larger bearish (black or red) candlestick that completely engulfs the body of the first candle. This pattern indicates a shift in market sentiment, with selling pressure overpowering buying pressure and potentially leading to lower prices.

Bitcoin Weekly Ultra-BearishThe 100K support is still valid but the weekly timeframe chart isn't looking good.
Good afternoon my fellow Cryptocurrency trader, how are you feeling today?
Bitcoin peaked the week 19-May. Then we have bearish action only.
The week after 19-May was red, then two neutral weeks and a continuation this week. It looks pretty bad right now, terrible to be honest.
» The main support range sits between $82,500 and $88,888.
Thank you for reading.
This support zone will only become active is 100K breaks on the weekly timeframe.
Namaste.
