Btcusd sell setup H4Hello! Friends,
Greetings. Please leave a Like if you like the idea.
Before start talking about technical Let's share your LOVE by giving me LIKES to support this work. Thanks in advance.
BTCUSDT.3S trade ideas

BTC & USDT.D => Bullish Correction Incoming?Hello TradingView Family / Fellow Traders. This is Richard, also known as theSignalyst.
Both BTC and USDT.D are sitting around key rejection zones.
💰 BTC is hovering near the $100,000 level — a major previous low and a psychological round number.
📊 Meanwhile, USDT.D is testing the 5% resistance — a supply zone and another critical round number.
As long as $100,000 holds as support on BTC and 5.1% holds as resistance on USDT.D, we could expect a bullish correction across the crypto market.
What do you think? Will these levels hold or break? 🤔
📚 Always follow your trading plan regarding entry, risk management, and trade management.
Good luck!
All Strategies Are Good; If Managed Properly!
~Rich

Big move for BTC - liquidity sweep + order block retest scenarioPrice could sweep the highs (BSL 110670), then reject around 104700. If that happens, I’ll look for a retest of the OB at 995700 for a possible long.
If we break lower, deeper liquidity sits around 93350, with a strong OB between 92900–91700, that’s my last line for a high-probability reversal.

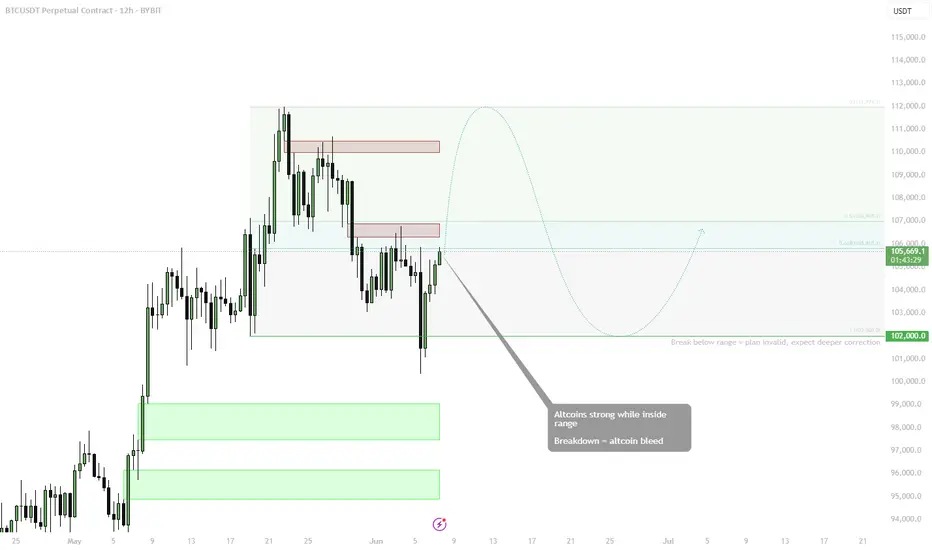
BTC — Altcoin Sentiment Hinges on BTC Holding BINANCE:BTCUSDT is consolidating within a well-defined range between ~$102K and ~$112K, with a bounce off the lower boundary now challenging midrange resistance. As long as BTC trades within the range, altcoins are expected to remain strong.
🟩 Midrange: $106K
• 0.618 fib and prior supply zone
• Key inflection for either a move higher or return to range low
🔻 Range Low Support: $102K
• Break below this = plan invalid
• Expect deeper BTC correction and altcoin bleed in that scenario
📈 Bias:
• Altcoins strong = only valid if BTC holds this structure
• Rotations likely while BTC moves sideways or grinds higher
• Upside target (range high): ~$111.9K
📌 BTC stability = altcoin opportunity. Breakdown from range? Get defensive fast.
BTC gonna surprise us its not the end for btc
looks very juicy
last bull flag gave huge pump
will this bullflag will be the same ?
place ur bets
BTCUSDT: Bounce Incoming?BTCUSDT Technical analysis update
-March 2024 resistance is now expected to act as a strong support level.
-The price has touched the 0.618 Fibonacci retracement level, suggesting a potential reversal from this zone.
-The 200 EMA on the 2-day chart is positioned as a strong dynamic support, reinforcing the bullish case.
We can expect a bounce from the $72-75k level.

Will Bitcoin's growth continue, or is this just a correction ?BINANCE:BTCUSDT After the weekend, the price showed a strong recovery. Currently, it is trading above the monthly and weekly pivot points. However, if these levels are broken without a subsequent buy-back reaction, we can expect the downward movement to continue as part of a higher-timeframe correction. Otherwise, we may see either a local correction or an upward move from current levels with the aim of breaking through the resistance zone and trendlines. All targets are outlined in detail in the video idea.
Write a comment with your coins & hit the like button and I will make an analysis for you
The author's opinion may differ from yours,
Consider your risks.
Wish you successful trades ! mura


Lingrid | BTCUSDT potential Bullish Momentum after Fake BreakoutBINANCE:BTCUSDT just reclaimed the support area after a deep liquidity grab below 100,000, rebounding sharply toward the mid-range. Price is still trapped below the descending resistance trendline, but the recent fake break and reversal signal a bullish shift in momentum. If bulls hold above 100K, a breakout toward 105,000 looks increasingly probable.
📈 Key Levels
Buy zone: 99,000–100,500
Sell trigger: break below 99,000
Target: 105,000
Buy trigger: strong breakout above the descending blue trendline
💡 Risks
Retesting resistance at 105,000 may trigger a pullback
Descending structure still intact until breakout confirms
Sharp volatility spikes could invalidate short-term setups
If this idea resonates with you or you have your own opinion, traders, hit the comments. I’m excited to read your thoughts!

Do you think it supports this model?After two weeks away from you, I am back.
Hello friends, as some of you dear ones know, I live in Iran, and due to the two-week war in Iran, I was not in the mood for analysis, nor was the internet helpful.
But I came back to you so that we can identify the profits together.
.
The chart you see has formed an old pattern (flag pattern), and if it breaks out of this pattern from above, we can expect an increase as large as the previous lag.
The target of this increase is the area that we had mentioned in previous Bitcoin analyses. (You can enter the page and look at the analyses)
.
I hope you have used this analysis well.
I wish you complete peace wherever you are.
You can follow the page to see more analyses, hoping for good days.

Market SIGNALS SHOW THAT BTC CAN FALL TO 85K USDMarket follow-up study shows that there is a good chance BTC can fall to 85K in the coming time period. The market cycle seems to end the green trend and to enter a new red zone.
Time will show what really can happen with BTC.
The market can make a fake trend, with a trend fall on a high time frame.
The crash can also happen on the main markets.
This is not trading advice, trade always only depending on your plan.

BTC recovers, price range sideways trend line💎 Update Plan BTC (June 25)
Notable news about BTC:
🌐 Growth stimulus factor
Reducing geopolitical tensions: The ceasefire agreement between Iran and Israel has helped improve investor psychology, promote capital inflows into risky assets like Bitcoin.
The dollar weakened: The USD index dropped to the lowest level in a year due to concerns about the economic impact from President Trump's tax policies, making Bitcoin a more attractive choice for investors to search for replacement assets.
Expectations for monetary policy: The decision of the US Federal Reserve (Fed) on keeping interest rates stable and interest rate cutting capacity in July has motivated the cryptocurrency market.
Technical analysis angle
Bitcoin may increase to the highest level of all time
Bitcoin price reached the lowest level of $ 98,200 on Sunday but has recovered strongly 5% in the next two days, closed on the dynamic average line according to the 50 -day exponential jaw at $ 103,352. At the time of writing on Monday, the price continued to trade higher at about $ 106,500.
If BTC continues to increase, the price can expand the momentum to the highest level of all time is $ 111,980 on May 22.
The relative power index (RSI) on the daily chart is 54, higher than the neutral level of 50, showing the motivation for price increase. The average divergent divergence (MACD) is referring to the price intersection (the MACD is about to cut on the signal line), if completed, the purchase signal will be made.
==> Comments for trend reference. Wishing investors successfully trading

BTC/USDT Smart Money Roadmap | Daily FVG + ATH TargetSeenForex | ICT-Based Smart Money Analysis
Bitcoin is currently reacting within a Daily Weak Fair Value Gap (WFVG) after a series of liquidity sweeps ($$$). Price structure suggests two possible scenarios:
✅ Bullish Continuation Setup:
Daily WFVG acting as potential mitigation zone
Targeting ATH liquidity above $112,000
Confirmation required: bullish BOS or entry model near FVG
🔄 Bearish Liquidity Sweep Scenario:
Deeper liquidity draw possible below WFVG
Next potential demand zone around $85,000–$87,000
Clean inefficiency (FVG) below waiting to be filled
🧠 Wait for price reaction inside WFVG or deeper zone before taking action.
📊 Strategy Used:
ICT | Smart Money | Liquidity Sweep | Order Block | BOS | FVG
📅 Date: June 19, 2025
🔍 Analyst: SeenForex
#BTC #Bitcoin #BTCUSDT #SmartMoney #ICT #FVG #Liquidity #TechnicalAnalysis #CryptoTrading #SeenForex #OrderBlock #TradingViewIdeas

A Disciplined Approach to BTC/USDT - Wait for the Right Set Up!Right now, I’m closely monitoring BTC/USDT — and what immediately jumps out is how aggressively this rally has pushed upward 🚀. We’ve seen price climb into a key external range high, taking out liquidity that was likely sitting just above those prior highs 💧.
This kind of move is often where institutional players step in to offload positions, as the liquidity makes it easier to find counterparts for previous accumulation phases 🏦. The way this price action is unfolding, I wouldn't be surprised to see a correction or retracement soon.
With the market this stretched, I’m not looking to get long here — especially not while BTC is trading at such a clear premium 🎯. No edge in chasing the highs.
Instead, I’ll be sitting back, waiting for a healthy pullback and a confirmed bullish structure shift before considering any entries 🔄📊. There’s no need to force trades in these conditions. Patience protects capital 🛡️.
⚠️ As always, this is not financial advice — just my current market perspective.

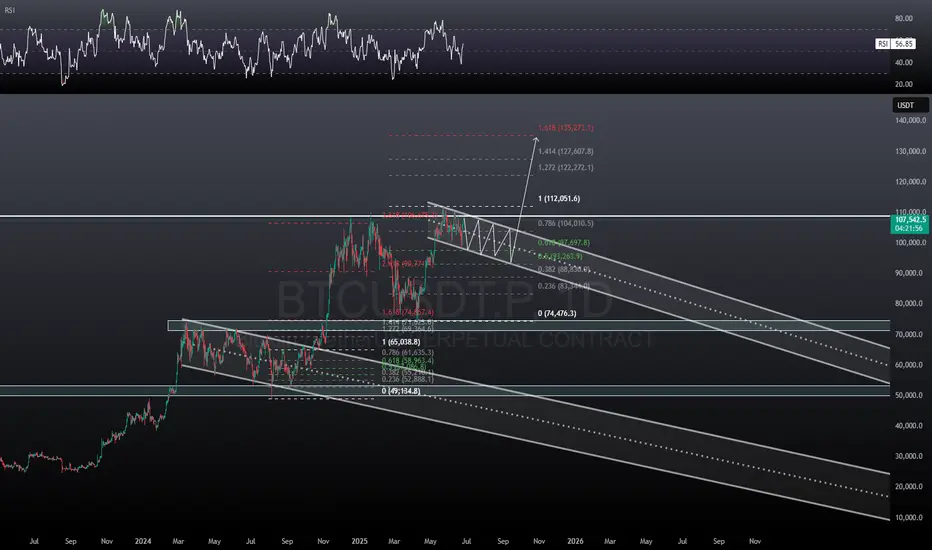
BTC is breaking out of a falling channel 🚀
Bitcoin has pushed strongly off the lower boundary and is approaching the top of a descending parallel channel on the daily chart 📈
A confirmed breakout could lead to a continuation rally toward key upside targets ✈️
🎯 Targets:
1️⃣ $111,233.01
2️⃣ $114,942.31
3️⃣ $118,490.33

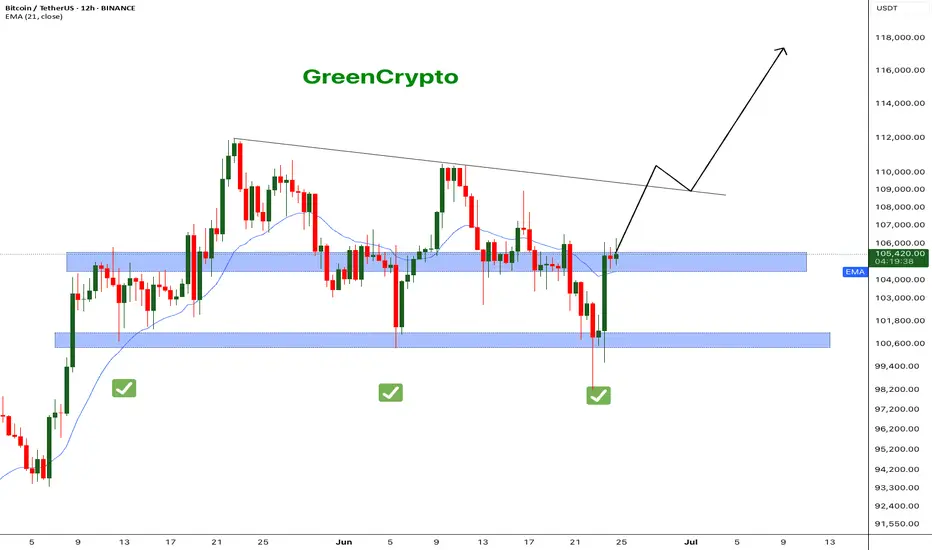
Bitcoin - What's next ? BINANCE:BTCUSDT (12H CHART) Technical Analysis Update
Now that ceasefire is announced, bitcoin price has successfully recovered to the resistance level and currently trading at the resistance zone. It's critical that bitcoin breaks this resistance for it to hit the next resistance around 110K .
I'm expecting price to reach 110k this week and we can see some consolidation in that range before moving further up.
Follow our TradingView account for more technical analysis updates. | Like, share, and comment your thoughts.
Cheers
GreenCrypto
BTC - Key Level Being TestedRight now BTC is fighting a pivotal level in its current trend. After falling slightly below the $100k level price has seen a strong uptick after a 4H reversal doji was created at the bottom of the trend.
Now price is at the $105k level which has shown lots of volume with flips between support and resistance. What we are watching for now is our red "Upper Resistance Trendline". The level is currently around $109k.
If we see a rejection of that level then it would show the bears are still in control and the momentum to the downside will continue. If we can close candles above the red trendline we could see a swift move back to our white trendline and a break of that could see a strong surge to new all time highs.
If we see the current uptrend start to fade and price close below our 0.236 fib that could be an early indication of lower levels needing to be tested. If we do start to fall rapidly the most important level to hold to keep the macro uptrend intact is the 0.618 fib level. Currently this level is around $88k and if that level would be flipped into new support it would be the best level to create a macro higher low.

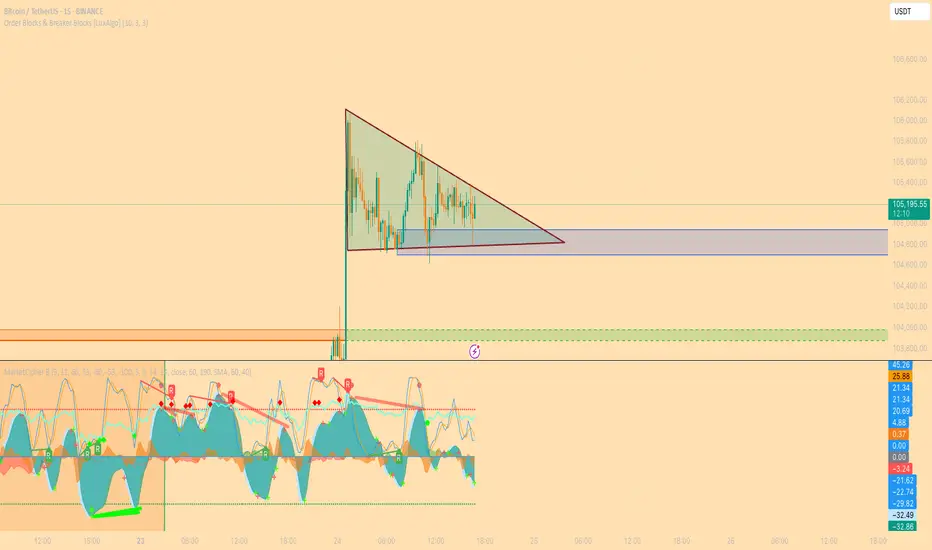
15 Min Bullish BTC pennant 15 minutes before POWELL testimonySelf-Explainatory. let's see if this LTF pennant works!
BTC/USDT Technical Outlook – Reversal Zone In Play✅ BTC/USDT Technical Outlook – Reversal Zone In Play
Current Price: 101,884.97 USDT
Structure: Bullish Reversal Setup
🧠 Market Insight:
Bitcoin has tapped into a high-probability demand zone between 100,000 – 99,300 USDT, showing clear signs of buyer absorption after extended downside pressure. The chart illustrates a strong bullish reaction from this area, hinting at a potential shift in momentum.
📈 What the Chart Tells Us:
Demand Zone Activation:
The price has tested a historically reactive demand block and bounced with strength — indicating a possible exhaustion of sellers and re-entry by larger players.
Volume Cluster Confluence:
Volume Profile shows heavy historical activity around this zone. This suggests that the current bounce is not just noise — but supported by previous institutional interest.
Path Projection (White Curve):
Market structure suggests a minor pullback followed by bullish continuation toward the 104,000–105,000 USDT target. The curved projection outlines potential market behavior leading up to this target.
Short-Term Resistance:
First key resistance is seen around 102,800–103,200 USDT. A break above this would likely trigger bullish momentum toward target levels.
🔐 Trading Insight:
Bias: Bullish (Short to Medium Term)
Entry Zone: 100,200 – 100,800 USDT (buy on minor dip)
Target Zone: 104,000 – 105,000 USDT
Invalidation: Clean breakdown below 99,000 USDT
📊 Summary:
BTC is currently sitting at a critical demand zone with bullish potential building. Price action, volume profile, and market behavior all support a reversal toward 104K+. Traders should watch for confirmation on the next pullback before entering long positions.

Potential Long Setup on BTC After Fakeout and V-Shaped Recovery🟢 Potential Long Setup on BTC After Fakeout and V-Shaped Recovery
After the fake breakdown around $101,116 and a strong V-shaped recovery, Bitcoin is showing signs of strength. If $105,771 breaks to the upside, a long entry with a stop at $104,579.8 could be a solid setup.
Keep in mind:
This long position should be taken with the bigger picture in mind — if BTC breaks $110,246.8, it might be much harder to catch a position then. So it's wise to already be in the market.
📌 Important note:
Don’t take heavy risk just yet. Skip taking profit (TP) on this one for now, but size your position cautiously. If the market confirms a trend later, you'll have more room to enter altcoins with higher conviction.
---
💬 What’s your take on this V-recovery? Are you entering early or waiting for more confirmation? Let me know in the comments!

BTC at Decision Point: Symmetrical Triangle Breakout Incoming ??BTC is now trading within a symmetrical triangle, bouncing strongly from the trendline support at $98,898, and now faces overhead resistance of around $106,000.
Price is moving between higher lows and lower highs; a breakout in either direction could trigger a significant move.
Key Levels:
Support Zones:
$101,409 – Near-term support
$98,898 – Strong ascending trendline support
$93,343 – Critical structure base
Resistance Zones:
$105,807 – Immediate ceiling
$106,057 – Triangle breakout point
$108,895 – First major upside target
$111,785 – Higher target if bulls take control
Analysis:
The structure shows clear compression, and BTC has already made a sharp bounce off the lower range, suggesting bulls are stepping in. However, a clean breakout above $106K is needed to confirm the momentum shift.
A breakout above this triangle could lead to a fast move toward $111K, while failure could send the price back toward $101K or even lower.
This is a make-or-break zone.
DYOR | Not Financial Advice

Bitcoin BTC Pullback Strategy: How I’m Planning My Next EntryI’m currently watching BTCUSDT 👀. Yesterday, we saw a bullish break of structure 🔼, and my bias is to follow that momentum moving forward 📈. Right now, price is overextended 📊, so I’m looking for a retracement into equilibrium, ideally around the 50–61.8% Fibonacci zone 📏.
If price pulls back into that range and holds above the bullish imbalance (discussed in the video) 🧱, I’ll be watching for a long opportunity 🎯. My targets are set at the previous highs and the Fibonacci extension levels 🔝.
⚠️ Disclaimer
This is not financial advice. Trading involves risk, and you should only trade with capital you can afford to lose. Always do your own analysis or consult a qualified financial advisor.

DeGRAM | BTCUSD rebound from the demand zone📊 Technical Analysis
● The BTCUSDT 4-hour chart on KUCOIN highlights a pronounced descending channel, with price action recently rebounding from a well-defined demand zone between 98,000 and 100,000. This green-shaded area has repeatedly acted as a springboard for bullish reversals, as evidenced by the strong wick and immediate recovery after the latest test. The chart also marks a series of lower highs and lower lows, but the most recent price action shows a break in bearish momentum, with a projected zigzag path indicating a potential move toward the 104,970 resistance. The confluence of the lower channel boundary and the demand zone suggests that buyers are stepping in aggressively at these levels, aiming for a retest of the upper resistance band.
● The technical setup is further reinforced by the presence of a major resistance level at 111,977, which has capped previous rallies. The chart’s structure, with its clear trendlines and highlighted resistance and support zones, points to a tactical opportunity for bulls to capitalize on the oversold conditions. The anticipated path, as drawn on the chart, suggests a gradual recovery with intermittent pullbacks, targeting the 104,970 area as the next significant hurdle. The overall pattern indicates that while the broader trend remains bearish, the immediate outlook favors a corrective rally from the current demand zone.
💡 Fundamental Analysis
● Recent fundamentals support the technical case for a short-term recovery. Over the past two days, Bitcoin has experienced heightened volatility due to escalating geopolitical tensions, notably US military action in the Middle East, which triggered a sharp sell-off and flushed out leveraged positions. Despite this, institutional accumulation remains robust, with over $1.2 billion in Bitcoin added to corporate treasuries in the last week, and Texas officially establishing a state-managed Bitcoin reserve. On-chain data shows sustained negative netflows from exchanges, indicating that large holders are moving coins to cold storage, a historically bullish signal. Meanwhile, derivatives data reveals a cautious market, with open interest skewed toward protective puts, but spot ETF inflows and long-term adoption trends continue to underpin the market.
✨ Summary
● BTCUSDT is rebounding from a key demand zone, with technicals pointing to a corrective move toward 104,970. The bullish scenario is supported by strong institutional accumulation and strategic adoption, even as short-term volatility persists. A sustained close above 104,970 would open the path to the 111,977 resistance, while a drop below 98,000 would invalidate the recovery thesis.
-------------------
Share your opinion in the comments and support the idea with a like. Thanks for your support!
