NEW BTC HIGHS?BTC just broke a previous resistance zone. Previous data indicates a more upward push.
This may even lead to new highs.
BTCUSDT.3S trade ideas
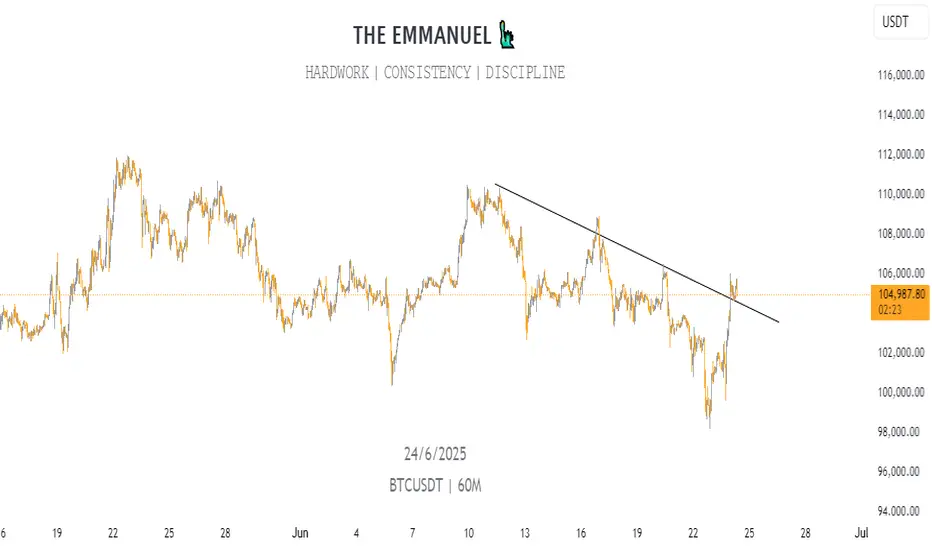
$BTC Breaks Out $110K in Sight?CRYPTOCAP:BTC has broken out of its descending channel and is now trading around $105K.
This breakout signals a potential trend reversal, with a projected move toward $111K.
Holding above the breakout zone could confirm further bullish momentum.
DYRO, NFA

Is BTC having War INDUCED PA? - 110k?
Owing to this the movement has been commenced due to the ceasefire! Whats next?
The move can be seen on the bit up 106,500 can be eyed, just expect a bit

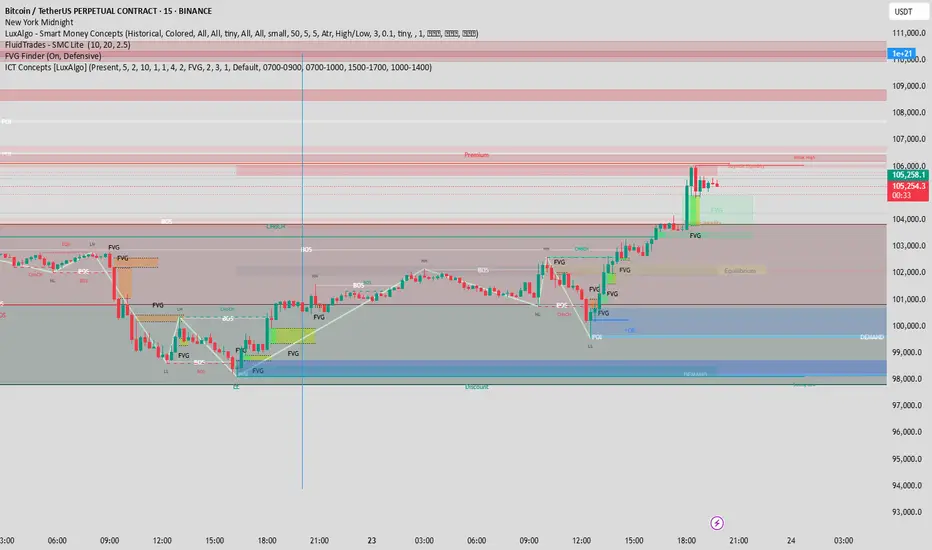
Breakdown: BTC/USDT 15m – Riding the Trend
🔹 Smart Money Confluences:
CHoCH at the bottom with a clear liquidity sweep (LL formed, then reversal)
Multiple FVGs aligned with structure—price keep respecting mitigation blocks
POI + OB near $99,800 gave the final long confirmation
BOS and strong HHs show clean bullish order flow
🟩 Premium/Discount Zones:
You entered at da discount, targeting premium—textbook ICT
Midline equilibrium held nicely before bullish continuation.
💡 Final Push:
Price is consolidating under weak high and buy-side imbalance.
Possible continuation if new FVG near $105k holds
🔔 Watch for:
Higher timeframe liquidity grab above $106k
Rejection near inefficiency = potential partial TP zone
BTC cup and handle After today’s bounce off the bottom trend line, it looks like a clear cup and handle pattern forming on BTCUSD Usually indicating a measured move around the height of the cup. Target 140k. I would be buying around the bottom of the bear channel if it retests the trendline.

Today's BTC trading strategy, I hope it will be helpful to youBitcoin is currently fluctuating around $105,500, rebounding 4.5% from yesterday's low of $101,000 and successfully breaking through the key psychological threshold of $105,000. Looking at recent trends, the price touched $105,000 in early June before pulling back, and now standing above this level again indicates that bullish forces are attempting further breakthroughs. Notably, this rally has been accompanied by continuous inflows of institutional capital—BlackRock's Bitcoin ETF (IBIT) has reached a scale of $71.9 billion, holding 660,000 BTC, making it the largest institutional holder in the market. Such "whale"-level position changes provide solid support for prices.
The market is currently in a phase where an "institutional bull market" intersects with an "emotional market". $105,500 is both a breakthrough point and a divergence point between bulls and bears. Investors need to maintain rationality amid greedy sentiment: in the short term, take advantage of volatility for high-throw and low-suction trading, while in the long term, adhere to the overarching logic of increasing institutional holdings and loose liquidity to seize opportunities amid fluctuations.
Today's BTC trading strategy, I hope it will be helpful to you
BTCUSDT BUY@104500~105500
SL:102500
TP:106500~107500

Bitcoin (BTCUSDT) - Price Testing Resistance after Morning StarBitcoin (BTCUSDT) price is currently testing the resistance zone of $105,000 to $110,000 (yellow lines).
A morning star candle pattern has formed above the 100 ema (orange line), which is also $100,000 price support.
Some bullish momentum is forming on the MACD Histogram, however, Bitcoin is still technically in a short-term downtrend for the past 30 days.
Bitcoin price needs to create a new uptrend on the daily chart, a series of higher-highs and higher-lows in the price, which could take several months.
At this time, Bitcoin is still reacting to global news and stock market correlations.

BTCUSD next target releasedNo comment needed. All information is in the chart analysis.
Steps to follow:
Analyze yourself.
Take the position with SL and Take Profits.
Wait, it may take a couple of days, so take a break and step away from the screen from time to time, just like I do :)
Get the result.
I will update the trade every day.
Like, comment with your good mood or viewpoint, share with your circle. It’s together that we get stronger!
Good trades, Traders!
The golden bear

BTC Short to 93.3My target is at least SSL on 93.3
WTF, there is no need to post a huge text description to understand what is depictured on the chart!

BTC is the champion our portfolio needs. BTC has some work to do. Either it will correct for a nice confrimatio low or strucure out for a bull fag. Either way, the price remains within a downward-sloping channel. That keeps me neutral bullish. But until I see a pivot point structure with signs of divergence in oversold conditions, it's difficult to get a proper RR.
Full TA: Link in the BIO

Markets Rally as Iran’s Strike Falls Short of Expectations🟢 Markets Rally as Iran’s Strike Falls Short of Expectations
One key point here is that global markets were bracing for a much more severe response from Iran toward the U.S. But when the actual attack turned out to be less intense than expected, risk assets — including crypto and stocks — started to climb, while oil prices dropped. Normally, heightened tensions in the Middle East would push oil prices higher, but this time, the opposite happened.
Another important factor is Bitcoin’s exchange outflows. As I’ve mentioned before, BTC leaving exchanges is a bullish sign — it means fewer coins are available to sell, which can fuel quick upward moves when a long trigger appears.
📍Wait for a clean long setup, and avoid emotional trades.
---
💬 Do you think the market is reacting rationally or emotionally right now? Drop your thoughts in the comments!

btc dirrectionnow days btc was bleeding much but to day was was recovering little as you see my last analyst it approaches the exact direction and I hope the coming days will go as I will insh Allah be ready for big bull run after it finish the last liquidity swept

BTCUSDT Short Setup at Fresh Supply ZoneBTCUSDT is currently trading near $102,397, approaching a clean supply zone between $102,887 – $104,030, where strong historical rejection has occurred.
A short entry around $102,887 offers a high-probability setup with a stop above the zone at $104,030, targeting $98,780 as the take profit level. This aligns with a previous demand structure and offers an excellent Risk:Reward ratio of approximately 1:3.6.
Trade Setup:
- Entry: $102,887
- Stop Loss: $104,030
- Take Profit: $98,780
- Risk:Reward Ratio: ~1:3.6
This setup expects sellers to defend the supply zone, rejecting bullish attempts and triggering a downward move.

A bearish trend is gradually taking shape.From a technical perspective, the complete breakdown of the box bottom, coupled with the MACD indicator about to fully crossing below the zero axis, both indicate that bullish momentum is weakening and a bearish trend is gradually forming. Short-term bulls need to take a temporary break and wait for the construction of a stabilizing platform. For bears, according to the current trend, they can lay out short positions on rallies. The ideal entry position is near the lower edge of the box, and they can try to lay out positions boldly after setting stop-losses.
On the news front, "Laote"'s policies change frequently, with extremely high uncertainty. The market needs global stability, and there has been no bull market in history built in a turbulent environment. Therefore, we need to treat market conditions cautiously, avoid blind and radical operations, and only by maintaining rationality can we respond to market changes.
you are currently struggling with losses,or are unsure which of the numerous trading strategies to follow,You have the option to join our VIP program. I will assist you and provide you with accurate trading signals, enabling you to navigate the financial markets with greater confidence and potentially achieve optimal trading results.
Trading Strategy:
sell@102300-102800
TP:100000-100500

BTC comleted wykoff with retest of sowJudging by 4h analysis, BTC completed wykoff with retest of sow and is getting completely obliterated now. Get out while you can! X_X

bitcoin update btc struggling to hold the 100k position market is choppy in lower tf but on higher tf its clearly shows sign of tapping below. with a double top on 3d tf, and breaking down of it will push long term holder book profits and with increasing tension in iran and usa 90k looks good support and as i mentioned previously about the cme gap in that area which works asa magnet for btc.
thanks
Measured move target madePrice bounced near the target and has been confirmed by the 4 hour SAR.
The 4 hour SAR is currently on a bearish retrace relative to the daily SAR.
As long as the Daily SAR is above price, the bearish Wolfewave is still in play.
Price is anticipated to go lower than what the 4 hour SAR has established as support.
To see more details and for faster movement, we look to the shorter intervals.
Shorter interval price action could invalidate longer interval patterns.

BTCBTC is currently trading within an 8H short FVG. For continued upside, a clean inversion of this zone is required.
Failure to flip this level may trigger a corrective move toward the $93K–$98K range. Monitor price action closely — confirmation is key.

Major Support Confluence, Tactical Rebound or Looming Flush?__________________________________________________________________________________
Technical Overview – Summary Points
__________________________________________________________________________________
Momentum: BTC is working a major daily support zone (102.6–103k USDT) with strong confluence across 1D, 12H, and 2H pivots. Technical rebound in play, but still no strong behavioral catalyst.
Supports / Resistances: Key support clusters at 102.3–103.3k (2H, 720min, daily pivots). Main resistances: 106.4k–110k.
Volume: Very high on 2H/1H near supports, hinting at possible washout/profit-taking. No buy climax identified.
Risk On / Risk Off Indicator: Strong bullish signal from 1D to 30min (neutral on 15min), while lower TFs remain under selling pressure.
Multi-TF Behavior (ISPD DIV): No excess or euphoria: market is waiting/compressed, caution is necessary in the short term.
__________________________________________________________________________________
Strategic Summary
__________________________________________________________________________________
Global Bias: Tactical bullish but cautious — confirmation on clean rebound needed to strengthen conviction.
Opportunities: Technical entries in the 102.6–103.3k zone with stops below 102k (aggressive) or 97.5k (defensive). Profit-taking zones at 106.4k/109.9k/110k.
Risk Areas: Invalidated below 97.5k (swing), potential flush down to 94k/88–89k. Heightened vigilance around macro releases.
Macro Catalysts: PMI prints (June 23), Fed on pause, increased geopolitical risks (latent volatility and cross-asset caution).
Action Plan: Prioritize active management: reduced position sizing, mechanical stops, and real-time bias adjustment based on volume and behavioral response.
__________________________________________________________________________________
Multi-Timeframe Analysis
__________________________________________________________________________________
1D–12H: Major supports (D Pivot Low 102626.8), structural uptrend, strong Risk On signal, but no behavioral/volume extremes.
6H–4H: Ongoing technical rebound, moderately high volume, support confluence, BUT short-term TF pressure remains.
2H–1H: Very high volume at support, possible local flush, but still no bullish behavioral confirmation—monitor for rapid volatility.
30min–15min: Tentative stabilization post-support absorption, no clear psychological excess, risk of further downside if rebound not confirmed; Risk On / Risk Off Indicator is neutral at 15min.
Summary: Bullish structural setup, but fragile micro dynamics—discipline and speed are key.
__________________________________________________________________________________
Fundamental & On-chain Overview
__________________________________________________________________________________
External factors: Fed on hold, US inflation slightly higher, robust economy, increased geopolitical risks (hot spots Israel–Iran, Ukraine–Russia). Latent risk-off sentiment but not yet materialized.
Calendar to watch: June 23, 09:45–10:00 UTC (US PMI & home sales).
On-chain: Low user activity, high institutional volumes, off-chain flow dominance, leverage high (mostly in stablecoins, limiting crypto-margined liquidation spirals), no euphoria or panic detected.
Risk/reward synthesis: Key technical buy zone 102.6–103.3k (stop < 102k/97.5k), targets 106.4k/109.9–110k. Below 97.5k: bearish bias, defensive risk management needed.
__________________________________________________________________________________
Final strategic synthesis
__________________________________________________________________________________
BTC remains "structurally strong but tactically fragile": major support confluence and bullish sectoral signal, but persistent micro selling pressure and macro/cross-asset uncertainty. Only entries on clear technical signals, mechanical stops and active risk management offer rational short-term setups in this volatile and compressed environment.
__________________________________________________________________________________

BTC, Selling pressure below 100K, 23 JunePlan BTC today: 23 June 2025
Related Information:!!!
Market capitalisation fell to $3.03 trillion over the weekend, likely due to speculators expecting a sell-off in response to US strikes on targets in Iran. However, the limited reaction from traditional financial markets brought buyers back to the crypto space, showing their willingness to buy at a discount and pushing market capitalisation back up to $3.12 trillion.
The cryptocurrency sentiment index dropped to 42 on Sunday, its lowest level in two months, but rebounded to 47 at the start of the new week, moving from the fear zone into neutral territory.
Bitcoin slipped to $98K over the weekend, briefly touching the classic support level at 61.8% of the April–May rally. However, by the start of the European trading session, it had already recovered to around $102K, compared to $102.7K at the beginning of Sunday. Still, last week’s sell-off broke the 50-day moving average support, weighed down by external factors. A breakout from the $96K–$105K range will likely determine the direction of the next major move
personal opinion:!!!
Selling pressure caused gold price to drop below 100k yesterday, macro economy has not changed much. Gold price continues to suffer selling pressure
Important price zone to consider :!!!
support zone : 100.800 ; 98.200
Sustainable trading to beat the market

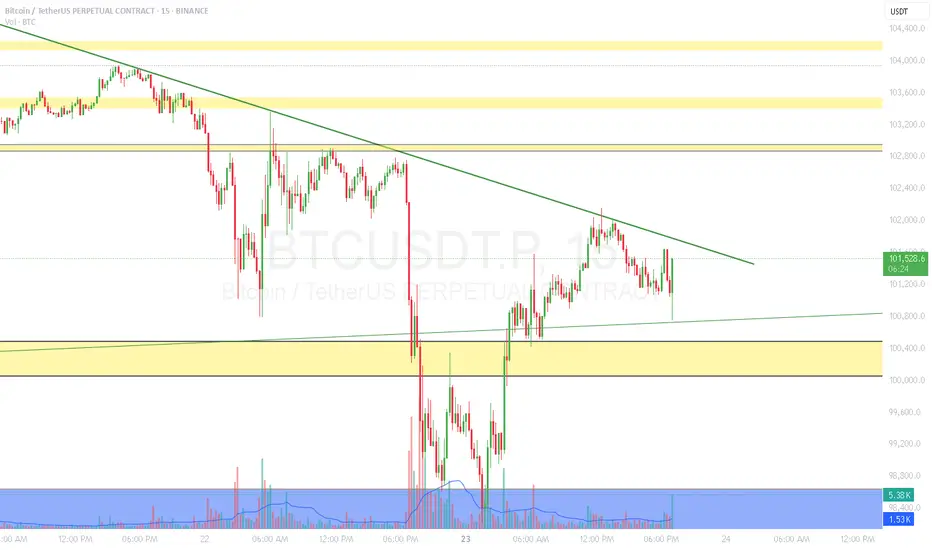
BTCUSDT Short Setup after Weak BreakoutThe BTCUSDT perpetual chart displays a bearish setup following a false breakout or weak retest of a descending wedge structure. After a strong bounce from the recent low, price surged but is now showing rejection at the $101,500 resistance level, marked by a key horizontal zone.
This area coincides with:
- The upper boundary of the falling wedge pattern.
- A former support zone now acting as resistance.
- A red candle signaling exhaustion from buyers.
A short position is initiated with:
- Entry: ~$101,500
- Stop Loss: ~$103,271
- Take Profit: ~$95,400
- Risk:Reward Ratio: ~1:3+
Unless price reclaims and holds above $103,271, this setup suggests a short-term bearish reversal is likely to unfold.

BTCUSD 4HThis chart presents a bearish setup for Bitcoin (BTC/USDT) on the 4-hour timeframe, shared by "Alpha_Gold_Trader." Here's the key breakdown:
---
Chart Breakdown
Current Price: Around $105,857
Resistance Zone (Register Point Level): ~$109,000 to ~$111,500
Support Zone (Breakout Level): ~$106,500 to ~$107,500 (pink box)
Bias: Bearish (implied by breakdown and downward projection)
Price Target: Around $95,000, labeled as "TARGET SUCCESSFUL"
---
Technical Implication
Price has broken below the support zone marked in pink.
A retest of broken support is anticipated before continuation down (common in breakout setups).
The setup suggests a short trade if price fails to reclaim the broken support and confirms rejection.
---
Trading Strategy Outline
Entry: Near $107,000 (on failed retest)
Stop Loss: Above $108,500 (back in the previous range)
Take Profit: ~$95,000 (target zone)

Bitcoin (BTC): Strong Sell-Off During Weekends | Plan A & BBitcoin was bleeding hard during the weekend when the US decided to join the ongoing war, which is now strongly impacting the economic markets.
As tensions are tightening, we are expecting a similar outcome to happen like we had during the beginning of the UA war, where at the start everything dipped hard, and later we had a strong upward rally.
Remember, people need to store their money somewhere safe, and the safest places are buying gold or Crypto.
Swallow Academy
