USA bombs IRAN - Bitcoin Falling!Operation Midnight Hammer was a major U.S. military strike carried out on June 21, 2025, targeting three of Iran’s key nuclear facilities: Fordow, Natanz, and Isfahan.
The operation involved seven B-2 Spirit bombers, each flying an 18-hour mission from Missouri, supported by over 125 aircraft, including refueling planes, fighter escorts, and surveillance assets.
To maintain the element of surprise, the U.S. used deception tactics, such as sending decoy aircraft westward over the Pacific while the actual strike force flew east toward Iran with minimal communications.
The bombers dropped Massive Ordnance Penetrators (MOPs)—30,000-pound bunker-busting bombs—on the fortified nuclear sites. Cruise missiles launched from a U.S. submarine struck additional infrastructure targets.
The Pentagon described the mission as the largest B-2 operational strike in U.S. history and the first known combat use of the MOP. Officials emphasized that the operation was aimed solely at nuclear infrastructure and not at Iranian civilians or military personnel
BTCUSDT.3S trade ideas


BTC Correction's 📉 Significant Bitcoin Correction During Uptrend
After a strong bullish rally, Bitcoin has entered a correction phase, retracing nearly 25% of its recent gains. Interestingly, this correction aligns exactly with the 200-period moving average on the 4-hour chart, marking a potential key support level.
🔍 Is Bitcoin’s Correction Over or Just Beginning?
The overlap with the 200 MA could signal the end of the correction, but if this zone fails to hold, deeper targets between the 35% and 75% retracement levels may come into play.
🛡️ Potential Support Levels for Bitcoin if the Correction Continues:
First support: 102,200 USD – 25% correction
Second support: 93,200 USD – 35% correction
Third support: 84,100 USD – 50% correction
Fourth support: 74,600 USD – 75% correction

Short BTC. Next price to touch is 87 to 89KHi,
Market has broken down the structure. When market breaks its structure it continue to fall till the next structure shows its presence which comes under area of 89K.
DIY its for educational purpose.
Happy trading.

BTC: Bias Map 22/06/25Previous Week:
BINANCE:BTCUSDT BINANCE:BTCUSDT.P
Bias:
Spot buyer within 93.5k–88k BTC zone. This is the key support region
Structure:
- Weekly fair value gap sits between 93.5k–88k
- Still trending lower, no reversal yet confirmed
- Weekly has swept previous ATH and rejected without displacement
Plan:
- Watch for Bitcoin to move into 93.5k–88k
- No trading Monday - sitting flat
- Iran’s retaliation risk still unpriced — major global risk looming
- Structure or weekly reaction will determine next steps
Macro:
- Global risk extremely elevated with increased escalation risk from a potential Iranian response
- Risk assets like crypto are broadly unattractive in this environment
- Capital preservation is still critical
A key issue I dislike about this structure is the similarities it shares with the 2021 bull run, where we swept previous ATH, failed to displace and then rejected and moved -77%
I do not think we will see a -77% move however but a scenario where this shares similar structure and we visit the 70-60s is without doubt a clear probability and one that must be acknowledged
This week will be absolutely critical to be patient and watch how the middle east situation evolves. We are heading into a potentially very dangerous and uncertain era so caution is critical

BTCUSDT LONG POSITIONENTRY: 106206.92
TAKE PROFİT : 109798.83
STOP LOSS : 1/3
Do not use high leverage!
Remember cash management (planning)!
Please follow the stop-loss rule!

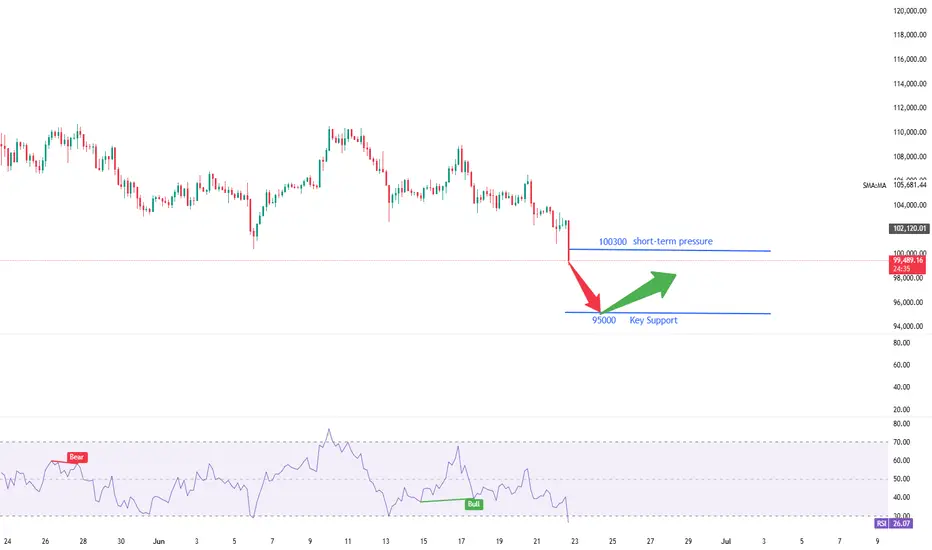
Need to wait for the key turning point.The Bitcoin market has currently broken below the key support level of 100,300, confirming a downward trend reversal. A daily-level recovery rally is now underway, and the 4-hour wave structure has not yet concluded. First, the downside target is seen at 95,000 to 98,000. Next week, the key turning point at 92,000 will likely determine the low of a rebound. Although this rebound low is not the ultimate bottom, it will trigger a relatively strong rebound after formation.
you are currently struggling with losses,or are unsure which of the numerous trading strategies to follow,You have the option to join our VIP program. I will assist you and provide you with accurate trading signals, enabling you to navigate the financial markets with greater confidence and potentially achieve optimal trading results.
Trading Strategy:
buy@95000-95500
TP:97500-98000
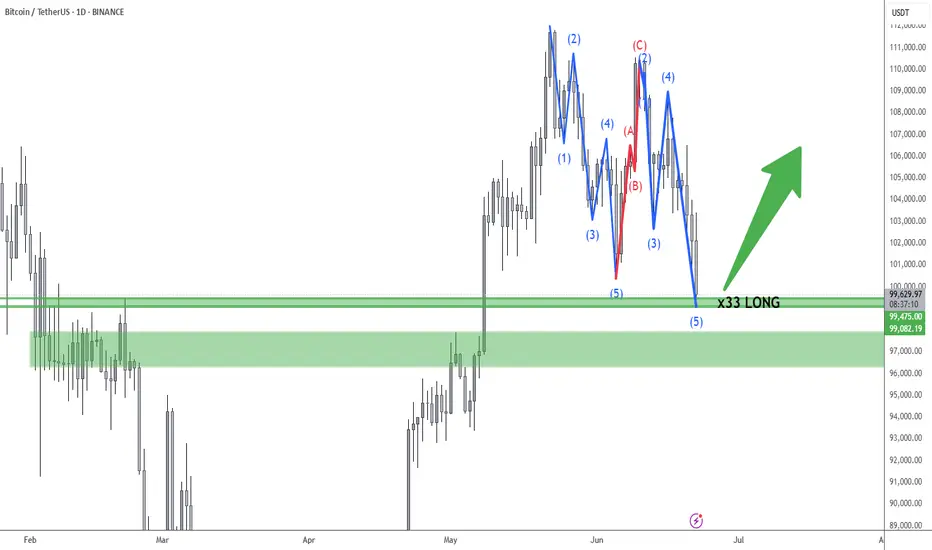
Long on Bitcoin. Bullmarket ahead!🚀 Entering a Degen LONG Position
I'm taking a calculated long here, with the 99.5k level acting as a key support zone.
✅ We’ve just swept the previous wick lows, grabbing a significant amount of liquidity that was resting below.
✅ The market has likely completed a clean ABC correction, with a nicely proportioned A = C structure — textbook move.
🧠 From a macro perspective:
The Iran war narrative appears to be fully priced in. At this point, only an extreme escalation (e.g. nuclear) could trigger a deeper selloff.
However, current geopolitical tensions may actually fuel bullish sentiment, as they give the FED more justification to pause or cut rates — a catalyst that could ignite the next impulsive leg of this bull market.
🤞 Fingers crossed — let’s see this rocket lift off.
$BTCUSD: Bull or bear?Choose your adventure gents...
If price breaks up today, it can ignite a daily timeframe trend signal pointing to a rally towards 114k within a few days.
If it breaks down, it will hit 96k within the next two weeks.
I've taken steps to reduce risk but I still trade futures actively in crypto pairs. There's good alpha in my long/short trading system and screening criteria, so I am comfortable trading it actively.
Current techo/fundamental juncture is risky, the way I see it, so if you haven't, maybe consider taking some profits, getting rid of leverage, trailing stops higher, etc.
Definitely not a time to be complacent with record exposure to US stocks from the public and foreigners, Gold hitting levels where it can purchase the same $ in real estate as in previous tops (1980, 2011), and companies buying into crypto to pump their failing business' stocks...to name a few red flags. There's some merit in long term bullish variables, but we might face some technical difficulties before that can materialize, and I rather be prepared by reducing risk in my long term exposure and max drawdown tolerance variables in my positioning and general strategy.
Best of luck!
Cheers,
Ivan Labrie.

Bitcoin Technical Analysis | Critical Support Zone in 4H Timefra📉 Bitcoin Technical Analysis | Critical Support Zone in 4H Timeframe
Bitcoin is currently testing a major support zone at $101,126, but bearish pressure remains high.
⚠️ If bulls fail to hold this level and no strong candle closes above it, we could see a further drop toward the $97,769 and $96,475 support zones.
However, if Bitcoin manages to bounce from here and begins a recovery, make sure to watch the descending purple trendline – a key resistance level that could slow down the upside.
🧭 The support and resistance levels drawn on this chart are highly reactive zones — use them to plan your trades and set smart entries and exits.
👉 Follow for more clean and actionable setups on BTC, ETH, and major crypto pairs!

BTC Loses Key Level — Will 100K Hold or Fold?Bitcoin has been locked in a range for the past 45 days, clinging above the critical psychological support at $100K. But cracks are starting to show…
Every bounce from the key level at $102,430 has been weakening — and now, for the first time, we’re breaking cleanly below it. Things are starting to tilt bearish.
So the question is…
⛏️ Will 100K be tested next?
🔍 Key Support Zone: $97.7K–$96.9K
Using the Fibonacci retracement from the swing low at $74.5K to the recent ATH, the 0.382 retracement lands at $97,655 — just below the $100K mark.
But there’s more…
Here’s why the zone between $97.7K and $96.9K is crucial:
0.382 Fibonacci retracement: A common pullback level in strong uptrends.
Anchored VWAP from $74.5K: Currently sitting around $96.9K, tracking cumulative volume-weighted average price — a key level.
Daily Order Block: Sits right at $96,887, aligning with the VWAP and reinforcing the area as demand-rich.
1.272 Fibonacci extension: From the previous move — providing another layer of confluence.
Fair Value Gap (FVG): The imbalance lies right in this zone. Price often fills these before continuing trend.
All of this stacks up to a high-probability long setup.
🕵️♂️ What to Do Now?
Set alerts at $100K and watch for a reaction. If price slices through, shift focus to the 0.382 Fib — monitor price action closely for signs of a reversal.
The first clean test of this zone could present a solid long — but as usual don’t trade blindly. Wait for confirmation.
_________________________________
💬 If you found this helpful, drop a like and comment!
Want breakdowns of other charts? Leave your requests below.

BTC/USDT Technical Analysis, 2025-06-20 19:45 UTCBTC/USDT Technical Analysis, 2025-06-20 19:45 UTC
💡 Trade Setup Summary
Pattern Detected: Bullish Hammer at local bottom
Confirmed by bullish candle close above pattern high
Volume Confirmation:
Volume Flow Analysis → Increasing OBV
Current Volume = 5.17, which although lower than the short-term mean, is paired with a positive trend
Order Book & Whale Confirmation:
Whale Bids > 2 BTC detected: 1 order, 3.54 BTC
Order Book Imbalance: 36.84% favoring buyers
Technical Indicators :
✅ Oversold region confirmed (likely RSI < 30, inferred by engine)
✅ Bullish pattern with volume trend confirmation
✅ Order book imbalance > 2%
✅ Whale bid presence
✅ Market pressure shows buyer dominance
✅ OBV increasing
Entry Price: 103146.58
Target (TP): 105646.58
Stop Loss (SL): 102146.58
Risk:Reward Ratio: ~2.5:1

BTC is still bearish (2H)This analysis is an update of the analysis you see in the "Related publications" section
The red zone seems to have had enough orders to reject the price downward. It is expected that the price will drop at least to the green zone below.
There will be some fluctuations along the way.
A daily candle closing above the invalidation level would invalidate this analysis.
For risk management, please don't forget stop loss and capital management
Comment if you have any questions
Thank You

Bitcoin (BTC/USDT) – Bearish Continuation After Failed Support !Bitcoin attempted to hold the $101,409 support level but failed to sustain above it. The breakdown confirms weakness, and the chart now suggests a continuation of the downtrend if bulls don’t reclaim lost ground quickly.
Technical Breakdown:
Failed Bounce: BTC briefly bounced near $101.4K but got rejected and closed back below the zone.
Bearish Structure: Price continues forming lower highs and lower lows — a clear downtrend.
RSI at 30.34: Close to oversold but still room to fall, which means downside isn’t exhausted yet.
Market Sentiment: Weak hands are exiting, and support zones are getting tested faster than they’re defended.
Key Levels to Watch:
Resistance:
$101,409 – Immediate level, now flipped to resistance
$103,573 – Strong barrier if bulls attempt recovery
$105,807 – Major horizontal resistance and lower high zone
Support:
$97,340 – Next major support zone (possible short-term bounce)
$93,343 – Key level if $97.3K fails to hold
$92,200 – Final support before panic could set in
Trade Idea – Bearish Bias:
Short on Retest Zone: $101.4K – $102K
Stoploss: Above $103.6K
Take-Profit Targets:
TP1: $97,300
TP2: $93,300
TP3: Optional – trail lower if breakdown continues
What Bulls Need to Do:
Reclaim $101.4K fast with a strong close above it on the 4H chart
Otherwise, sellers remain in control
This is not financial advice. Always do your own research (DYOR) and manage your risk accordingly.

#BTC bearish cup-handle structure, beware of a pullback!📊#BTC bearish cup-handle structure, beware of a pullback!
🧠From a structural perspective, we broke below the neckline, which means a bearish structure is established, so we need to be wary of further declines.
➡️Yesterday's decline was rapid, so we can wait for a rebound to appear and look for shorting opportunities near the blue resistance area or the downward trend line.
➡️Since it is the weekend, the trading volume may be less. If there is no rebound, then we need to wait patiently for a period of sideways consolidation before looking for shorting opportunities.
⚠️Note that the area around 106500 is a support-resistance conversion zone. If it breaks through here and stabilizes, we can remain optimistic.
🤜If you like my analysis, please like 💖 and share 💬 BITGET:BTCUSDT.P

BTC MACRO PLAY - SHORT TRADE SETUP📉 BTC/USDT SHORT TRADE SETUP – WEEKLY TIMEFRAME
🔍 Trade Idea Overview:
We are seeing a bearish divergence between price and volume on the weekly chart — while price makes higher highs, volume is decreasing, signaling a potential reversal or weakening trend.
Further confluence is seen with the VMC Cipher indicator. If a red dot prints, it will confirm the short entry. If not, the trade idea should be abandoned.
📊 Trade Plan:
Entry Zone: Around $106,300–$107,000 (wait for confirmation)
TP 1 🎯: $102,000
TP 2 🎯: $97,500
TP 3 🎯: $93,000
🛑 Risk Management:
Stop-Loss: Above recent highs at $111,800 (or adjusted based on your entry)
⚠️ Disclaimer:
Once TP 1 is reached, move stop-loss to breakeven to protect capital and eliminate risk.
TP 3 may never be reached, but it remains part of the plan to capture extended downside if momentum continues.
If no red dot prints, there is no confirmation — be ready to abandon the trade.

BITCOIN BEARISH SETUPBitcoin (BTC/USDT) – Breakdown from Double Top Confirms Bearish Trend Continuation
The 4-hour chart of BTC/USDT (Binance Perpetual Contracts) presents a textbook double top formation followed by a confirmed breakdown below structural support levels. The bearish trend has already met its first target, and technicals suggest the move could extend lower toward the key demand zone around $96,000.
🔍 Key Technical Highlights:
Double Top Pattern: Clear double top structure formed between $109,000–$110,000, followed by a strong rejection.
Support Break: Price broke down below key support at ~$105,000, triggering a sell-off and validating the bearish reversal.
Bearish Retest: After the breakdown, price retested the broken trendline (highlighted with a red zone) and failed to reclaim the range.
First Target Hit: Price achieved the first projected support zone at around $101,000.
Next Target: Based on measured move projection and previous structure, the next downside target lies near the $96,000 mark.
📉 Outlook:
The structure remains bearish as long as BTC trades below the broken support-turned-resistance zone (~$105,000). Momentum favors continued downside toward the next key zone unless a significant bullish reversal signal emerges.

BITCOIN BEARISH SETUPTechnical Analysis Summary:
Pattern Formation: The chart shows a descending triangle pattern with double tops, indicating bearish pressure at resistance levels.
Breakdown Confirmation: Price has broken below a key ascending trendline (shown in dashed line) and retested the breakdown area, forming a bearish rejection (highlighted red zone).
Key Zone: The price is currently trading around $105,075, just under the previous support-turned-resistance zone (~$106,000). This confirms a failed bullish structure and strengthens the bearish outlook.
Targets:
First Target: Around $101,000–102,000, aligning with the next visible support zone.
Second Target: Around $97,000–98,000, which is a major support / key zone based on prior structure.
Bias: Bearish in the short term, as long as price remains below the $106,000 resistance zone.
Trade Setup Outlook:
A short position is implied by the arrows.
Best entries are around retests near $105,500–106,000 with stops above the recent highs (~$107,000).
Conservative profit-taking at the first target, with extended TP near the key support zone.

bitcoin update as reacted market is now at a key support level of 101k.
market will now might give a dead cat bounce till 104-105k max, a scalp long can be taken with cautious, one bad news and that ded cat bounce will die with the market.
stay safe everyone.

Bitcoin StructureBTCUSDT — day
Now we clearly respect the supply zones . The price has already beaten off the zone twice, and there is no desire to go higher yet.
Also by structure:
There was an explicit Break of Structure, then Market Structure Shift (MSS) - impulse change
Below in the region of 93k - the discount zone, where there is a large liquidity (according to calculations - stops by about 17 billion)
→ Continuation of the rollback down
→ Liquidity collection from 93k
→ And only after that a possible turn up
❗️So far, I'm only looking for shorts from the offer zones - on junior TF, with confirmation on 4H.

BTC/USDT – 4H Chart Technical AnalysisBTC/USDT – 4H Chart Technical Analysis
Market Structure & Trend
Overall Trend : Bearish (clearly defined by a consistent downtrend channel).
Current Structure : Price is in a corrective downtrend within a descending channel, after multiple rejections from the supply zone.
Key Technical Zones
1. Supply Zone
Strong rejection zone where the price previously reversed sharply.
Still acting as resistance, located around the upper range.
2. Demand Zone
Currently being retested for the fifth time, weakening its strength.
Recent price action shows liquidity sweep and swing low break inside this zone, potentially trapping early longs.
Fair Value Gaps (FVG) & Fibonacci Levels
1D FVG sits below the current demand, aligning with:
Golden Pocket (0.618–0.65 Fib).
Acts as a high-probability bounce zone for long entries if demand fails.
A break below this FVG could open up deeper downside toward the 0.786 Fib or beyond.
Psychological Levels
105,000 – Major resistance & potential take-profit area for long positions.
100,000 – Key support and liquidity magnet if the demand zone fails.
Volume Profile
High Volume Node: 102,000 – 106,800 — price tends to gravitate here, indicating potential consolidation or resistance.
Low Volume Area: Below 100,500 — suggests thin liquidity, which may cause sharp moves if price drops into this range.
Scenarios & Trade Ideas
Bullish Scenario
If price holds above the demand zone (after multiple retests) and confirms on LTF:
Potential Long to local resistance.
On breakout, target the 105,000 psychological level.
Confluence: High volume area offers both support and a magnet.
Bearish Scenario
If price fails to hold the demand zone:
Enter short position targeting the 1D FVG and 100,000 psychological level.
If that breaks, expect sharp continuation due to low volume below.
Conclusion
Price is at a pivotal point — currently balancing on weakened demand after multiple retests. Watch for LTF confirmation:
Above demand = bullish recovery setup.
Below demand = bearish continuation toward 100,000 and the FVG.
Manage risk tightly due to the proximity of both key zones.

Today's BTC trading strategy, I hope it will be helpful to you Analysis of Market Dynamics Under Geopolitical Conflicts
The current conflict between Iran and Israel has entered a critical phase of "reciprocal retaliation". In the early morning of June 22, Iran launched missile strikes on Israel, targeting military command centers and nuclear R&D facilities in Tel Aviv, while Israel carried out multiple rounds of airstrikes on missile bases in western Iran. This high-intensity mutual bombardment has broken the "limited retaliation" pattern of previous regional conflicts. Iranian Supreme Leader Ayatollah Ali Khamenei explicitly stated the intention to "completely destroy the Israeli regime", indicating a real risk of further escalation.
The U.S. stance in this conflict has become a key variable. While President Trump said it "may take two weeks to decide whether to join the war", he also emphasized that "it's hard to ask Israel to stop attacks", an ambiguous stance that has intensified market uncertainty. Notably, Iran has ruled out the possibility of nuclear talks during the conflict, and the breakdown of diplomatic channels has made military confrontation the only option—this could lead to geopolitical risk premiums persisting in asset pricing.
Historical experience shows that Bitcoin's performance in geopolitical conflicts features "short-term volatility, medium-term divergence". During the Iran-Israel conflict in April 2024, Bitcoin plunged 7% within an hour, but it rose 5% against the trend after the U.S. airstrike on Iran in 2020. The current market's uniqueness lies in that Trump signaled "possible military action" before the conflict, giving the market a digestion period—thus, Bitcoin only fell 4.5% after the conflict broke out on June 13, showing stronger resilience than in 2024. However, if the U.S. officially enters the war, it may trigger panic selling similar to the early stage of the 2022 Russia-Ukraine conflict, which requires high vigilance.
Bitcoin's current price of $102,500 is facing a dual test of geopolitical conflict and technical resistance. The reciprocal retaliation between Iran and Israel has not ended, and whether the U.S.参战 (enters the war) will determine the direction of market sentiment. Technically, whether the $103,000 resistance level is broken will guide short-term trends. Investors need to distinguish between short-term emotional shocks and long-term trend forces—geopolitical conflicts may cause short-term volatility, but the de-dollarization trend and the stability of institutional holdings provide long-term support for Bitcoin.
In terms of operations, it is recommended to adopt a strategy of "light-position trial + flexible hedging": do not blindly chase breakouts, nor ignore pullback buying opportunities. Remember: in the fog of geopolitics, real opportunities often lie at the intersection of market panic and rationality, and risk control is always the first principle of investment.
Today's BTC trading strategy, I hope it will be helpful to you
BTCUSDT BUY@101000~102000
SL:99500
TP:103000~104000

BTC - Cup & Handle?BTC forming a cup and handle on the 1D chart which seems to be the main timeframe/narrative of play..
