btc usdtbtc usdt
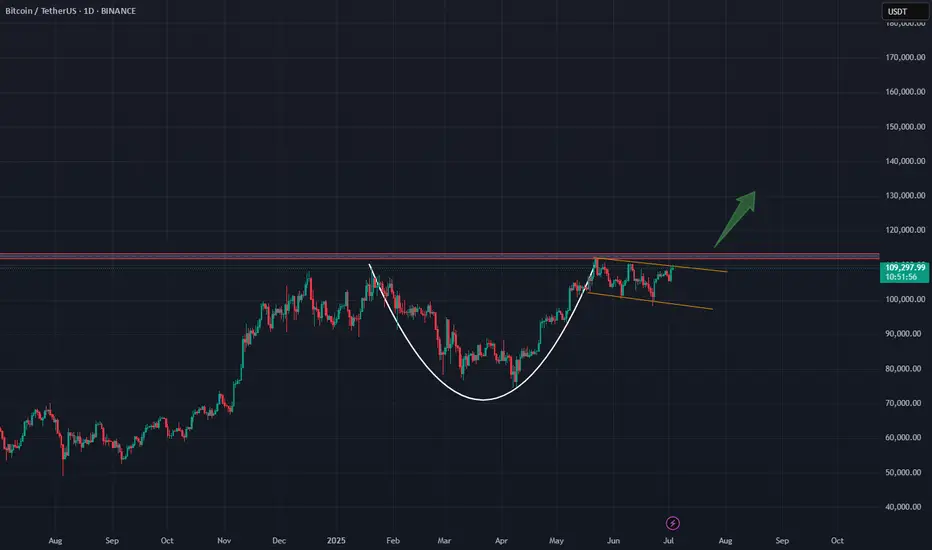
cup patern
I think my eyes are seeing correctly! After the breakout from above and confirmation on the red line, it will move upward.”
BTCUSDT.3S trade ideas
Bitcoin (BTC): Going For Another Breakout | New ATH?Bitcoin is showing strong signs of buyside movement, where we are pressuring the local resistance zone, which upon breaking should lead us to a new ATH area.
We have had multiple attempts to break out from that area, so being back here does not mean anything. yeet, we have to ave clean breakout in order to see the $120K area tested.
Swallow Academy

Narrow range signals Bitcoin will breakout.On July 6, 2025, Bitcoin was trading at $108,162 with a market capitalization of $2.15 trillion. With a daily trading volume of $9.49 billion, the cryptocurrency fluctuates in a narrow intraday range between $107,876 and $108,252.
The 4-hour Bitcoin chart shows a slightly wider view, showcasing sideways trading between $107,500 and $108,500 after a rebound from $105,130. Declining trading volumes suggest weakening market momentum, reinforcing the need for a breakout to confirm direction. Key technical levels remain in focus; a break above $108,500 could lead to a retest of $110,500 resistance. Conversely, a break below $107,000 per Bitcoin could pave the way for a pullback to $105,000. Oscillator data remain mostly neutral in this timeframe, while all short- to medium-term exponentials and simple moving averages suggest a persistent buying trend.
If Bitcoin breaks above the $110,500 resistance level convincingly and is accompanied by strong trading volume, it will open the path for the continuation of the bullish move. The alignment of all major moving averages in the buy zone and positive momentum signals support the possibility of an extension to new highs. (But a break below $107,000, especially on increasing trading volume, could trigger a deeper correction to the $105,000 and $98,000 support levels. Despite bullish long-term indicators, weakening trading volume and neutral oscillators warn that bullish momentum may stagnate in the short term.)

Long IdeaI'm seeing a possible bullish cypher pattern forming for the mini blow off top for btc. This mimics the SPX500 and currently in lagging state. Ater that, it will go back around 50k - 60k area, probably to eliminate saylor out before going to the 240k - 280k region..

BTC shorting opportunity comes againBTC climbed above 108000 again, and the short-term bullish power was slightly stronger. According to the current strength, BTC still has room for growth, but it is still under pressure in the 109000-110000 area in the short term; if there is no major positive news, BTC may find it difficult to break through the resistance area in the short term under the current conditions, and may even experience stagflation and retreat again after approaching the resistance area.
Therefore, I think shorting BTC with the help of the resistance area is still the first choice for short-term trading. We can boldly short BTC in the 108500-109500 area and look towards the target area around 106000 again.

Bitcoin BTC Trade Plan: Watching for Breakout or Pullback Entry📊 Currently watching BTC (Bitcoin) as price action remains bullish overall, but we're approaching a key decision point 🎯
💹 Price is pushing higher, but with some signs of exhaustion after the recent rally ⚠️ — and with the weekend approaching, we could either see a continuation higher or a healthy pullback
I’m keeping an eye on two potential trade scenarios:
1️⃣ A break and clean retest of the recent high, which could offer a continuation long if momentum follows through 🚀
2️⃣ A retracement into equilibrium — a deeper pullback toward fair value 📉 — which could also present a high-probability long setup if confirmed with structure and reaction 📈
Either way, I’m letting the market reveal its hand and waiting for one of these setups to play out before committing 💡
💬 Not financial advice — always assess your own risk and confirm with your own analysis.

Bitcoin long back to $110000Recently opened a long position on bitcoin. Aggressive entry. Soon I anticipate a push back up to 110000
4hr trend is still in tact. 1hr trend is bearish failed to make new LL.
Lets see how it goes.
2RR trade roughly.

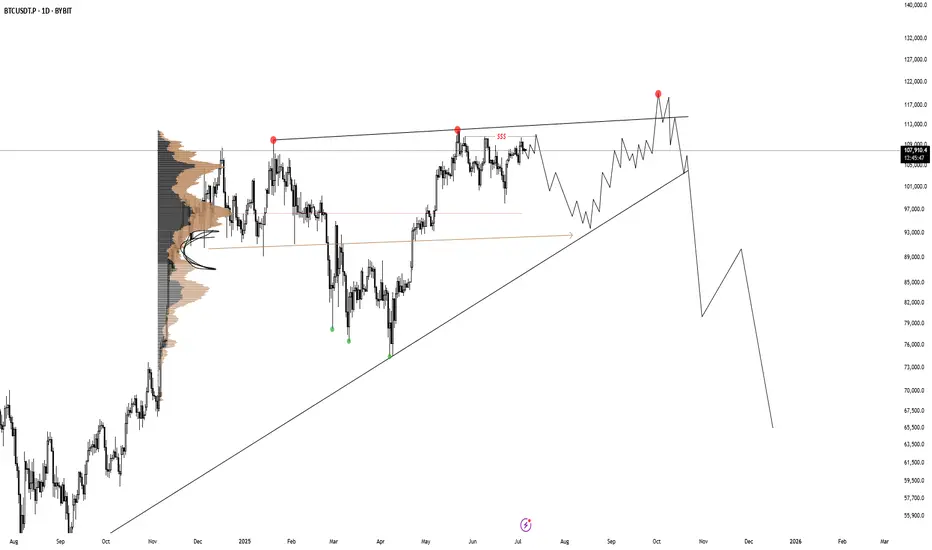
BTC HTF Distribution V2This is still the main scenario I'm looking for until it's invalidated. A build up like this, followed by a fake breakout out of this rising wedge as 3rd tap would be perfect.
BEst long on Btc is at $104 600CRYPTOCAP:BTC
Our plan is still bullish
But price reached VAH
That's why some pullback is possible
$104 600 is key zone for me. POC + VWAP. I`ll take a long trade in a case of local confirmation.

BTCUSDTIt seems that the price of $110,000 is a strong resistance for Bitcoin, and as long as the price is below $110,000, its trend is bearish, and we can consider the targets of $107,000 and $105,000 for it.

Bitcoin turns bullish again | Price target = $140k++After 2 months of consolidating within a descending channel, Bitcoin has finally broken out, confirming a major technical breakout and shifting the structure back to bullish. The breakout was followed by a clean retest of the channel resistance turned support, which is now acting as a launchpad for the next leg up.
🧠 Technical Analysis:
Descending Channel Breakout: Price has convincingly broken out of the downward sloping channel, invalidating the bearish structure and flipping it bullish.
Retest Confirmation: The price is currently retesting the upper boundary of the channel — a textbook bullish retest. This confirms buyer strength and shakes out weak hands.
Liquidity Magnet Above 111k: A significant cluster of buyside liquidity sits above 111k. Once that level is breached, expect an explosive acceleration toward 120k.
Measured Move Target: Based on the height of the prior impulse (from April to May), the projected extension points to ~140k.
🌍 Macro & Sentiment Drivers:
ETF Flows & Institutional Demand: U.S. Bitcoin Spot ETFs continue to show consistent inflows, signaling strong institutional accumulation — a major shift in long-term demand.
Fed Pivot Speculation: Expectations for a Fed rate cut later in 2025 are building. Lower interest rates could fuel risk-on sentiment, pushing capital back into crypto.
Big Beautiful Bill: This bill is expected to inject money into the economy, increasing liquidity — ultimately going into crypto. This bill will be signed into law today.
Bullish crypto developments: Settlement of the XRP SEC case, spot crypto ETFs, mainstream crypto adoptions, etc. will all contribute to the bullish sentiment.
🧩 Final Thoughts:
This setup combines strong technical structure, favorable macro tailwinds, and clear liquidity targets. The coming days are critical — if Bitcoin clears 111k cleanly, it could trigger a short squeeze and FOMO-driven rally straight into 120k.

Bitcoin (BTC): Aiming For $104,000 Before Next Bullish MoveWe are getting ready for another upward movement on Bitcoin, which we have marked as an area near $104K.
Ideal zone slightly below EMA where the order book has shown a decent amount of orders just sitting. This is the zone we will be looking for any kind of MSB to form with a proper breakout, which then would lead the price back to upper zones!
Swallow Academy

BTC in a Bearish 60 min movementBTC in a 60-minute bearish move
It appears that BTC has already completed the C leg of a 60-minute harmonic pattern near 109680
BTC is forming a larger corrective pattern rather than taking a true direction, thus increasing the chances of completing this pattern before moving up again.
Currently, the price is positioned to complete the D leg of the pattern near 105700
I am looking for short-term targets near 107240; 106275 and 105715
You may find more details in the chart!
Thank you and Good Luck!
PS: Please support with a like or comment if you find this analysis useful for your trading day

Bitcoin STANDING..bitcoin now is standing on monthly pivot and hold that as the support.
3rd pivot's resistance is at 124k is reachable in few weeks.

Monday - Trade of the day Hello I took a week off from trading — life got a bit hectic 🌀. Looking back, I actually needed that break from the charts 🧠💆♂️.
But we’re back this week! Let’s see how many X’s we can cream off the market 💸🔥
Here are the immediate levels I’m watching 👀 — mainly some range deviations from both internal and external ranges.
If we break either side of the range, I’ll be looking to enter from the last supply or demand zone for a continuation 🚀📉📈
That said, I’ll stay mindful of any supply and demand zones that could get in the way ⚠️📊
Let’s get it 💪📅
BTC/USDT CHART ANALIYSIS !!BTC/USDT
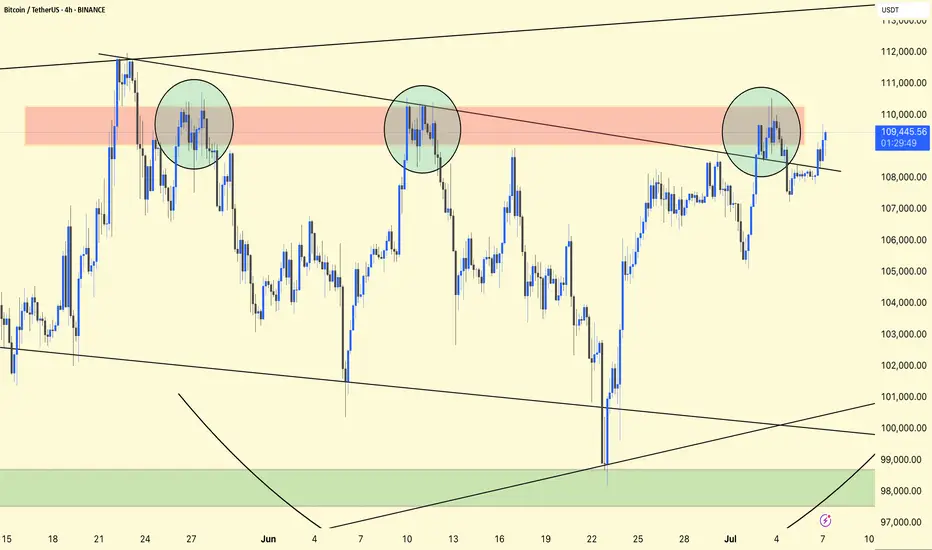
You have three circles highlighting repeated price rejections around the $109,000–$110,000 area (red resistance band).
A descending trendline connects those high points, creating a sloping resistance.
There is a broad support area around $98,000–$100,000 (green area below).
The price recently broke above the trendline and is now retesting around that $109,000–$110,000 area.
If BTC stays above ~$108,500–$109,000, it could head further towards $112,000–$113,000.
A drop below the trendline and back to $107,500 could trap the bulls, leading to a retest of $105,000 or lower support around $100,000.
Bullish setup: Entry $108,800–$109,200, target $112,000–$113,000, stop-loss below $107,000.
Bearish setup: Short if price rejects $109,500–$110,000, target $105,500, stop-loss above $110,800.
Stay alert!
BTC - Falling Correction = Continuation?BTC has been playing by the rules lately!
Every time Bitcoin forms a falling correction, it turns out to be a bullish continuation pattern — and history might be repeating itself 👀
As shown on the chart:
Previous falling channels (flag/wedge structures) have consistently led to strong bullish impulses.
The current correction also appears to be a falling channel, hinting at another potential bullish leg soon.
As long as the structure holds and no major support is broken, the next target could be a new all-time high.
Let’s see if BTC continues to respect this textbook behavior.
📌 Remember: Falling corrections in an uptrend = healthy continuation!
📚 Always follow your trading plan regarding entry, risk management, and trade management.
Good luck!
All Strategies Are Good; If Managed Properly!
~Rich

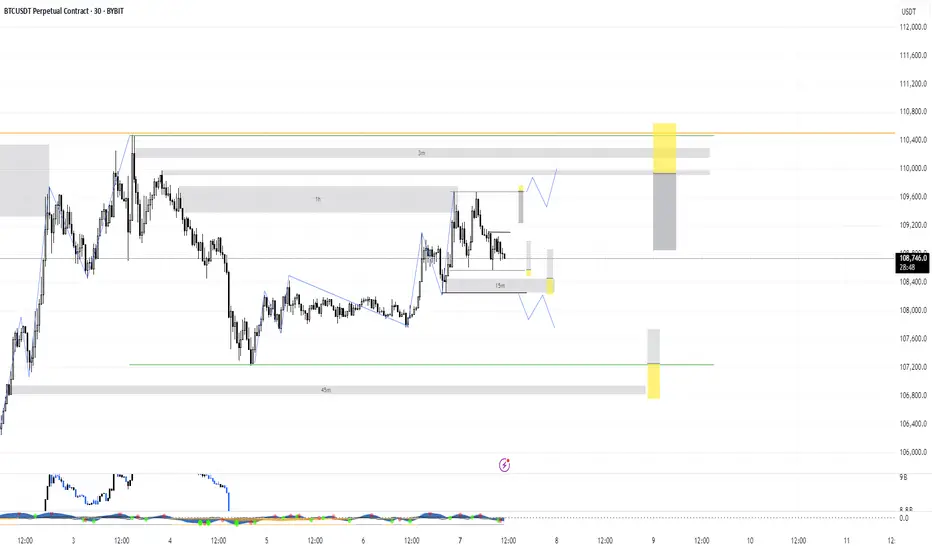
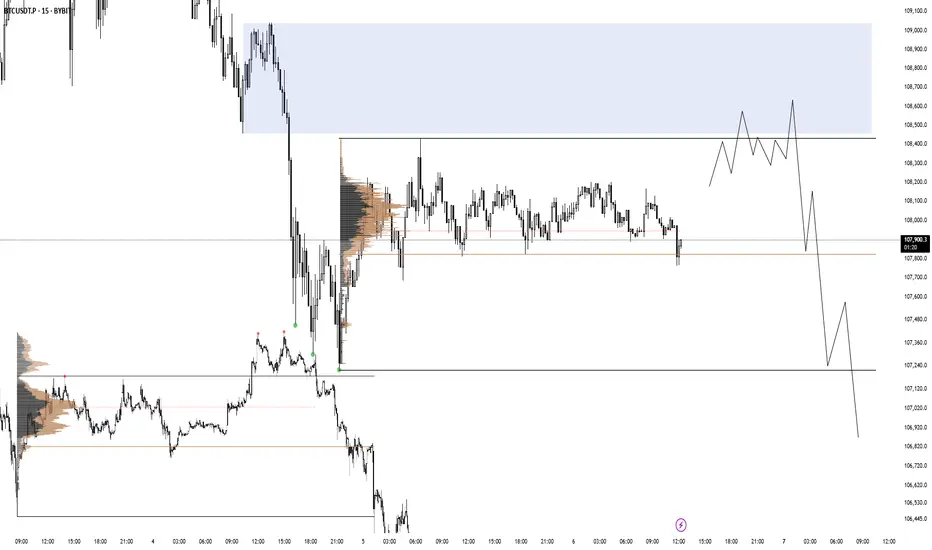
BTC 06.07.25There is a range imbalance with no price action in discount after BTC accumulated on friday afternoon. I am looking for a valid distribution like in the picture on the left.
[SeoVereign] BITCOIN Bearish Outlook – June 29, 2025We are the SeoVereign Trading Team.
With sharp insight and precise analysis, we regularly share trading ideas on Bitcoin and other major assets—always guided by structure, sentiment, and momentum.
🔔 Follow us to never miss a market update.
🚀 Boosts provide strong motivation and drive to the SeoVereign team.
--------------------------------------------------------------------------------------------------------
Hello,
This is Seobeorin, approaching technical analysis not as a result but as a prediction, from a realistic perspective.
I am presenting a bearish view on Bitcoin as of June 29, 2025.
If you refer to the Ethereum idea from June 27, 2025, you can confirm that I presented a bearish perspective on Ethereum at the time. The basis for that perspective is still valid, and we are currently waiting for the take-profit level to be reached. The reason I selected Ethereum at the time was because I believed that the downward pressure on Ethereum was relatively stronger than that on Bitcoin.
However, based on today’s Elliott Wave count on the Bitcoin chart, I now judge that Bitcoin is also likely to experience some short-term downward pressure. Therefore, I am presenting a short position idea on Bitcoin.
The first take-profit target is set near $106,056. Depending on future price movements, this take-profit target may be narrowed or expanded. I will continue to track this idea, and as it develops, I will align the reasoning accordingly to organize the thought process more clearly.
Thank you.

Bitcoin is in a downward trend.Hello dear friends.
Considering the trend of Bitcoin, it is expected that this Bitcoin will fall to around $100,000.
❌Please note that this is just a prediction, so be careful with your capital.

Bitcoin will Return all-time high Interestingly Bitcoin (BTC) has not been particularly impressive over the weekend, which has been a somewhat consistent theme of the cryptocurrency market so far in the year 2025. The premier cryptocurrency continues to hover around the $108,000 mark, showing signs of indecision amongst the investors.
Resistance zone 111K
Support zone 107K
The conversation has been about when the Bitcoin price will return to its all-time high. Interestingly, the latest on-chain data shows that investors are becoming increasingly confident in the long-term promise of the flagship cryptocurrency.
Hope you can understand all our chart Pattern According the Bitcoin analysis.
Thanks for your Support.
if you found this analysis share you Opinion in comments I'm Tankful from you.

Bitcoin (BTC) 4H Chart – May see new ATH SOON !!Bitcoin is currently moving tightly within a broad symmetrical wedge structure. Despite multiple fakeouts and low-conviction moves, the price has managed to stay range-bound and is holding above key support, a sign of underlying strength.
Chart Structure:
Price has broken out of the downtrend resistance but is yet to confirm momentum.
The structure suggests a larger move is imminent, with bulls gradually gaining control.
Key Levels:
Immediate Resistance: $108,700
Major Resistances Ahead: $111,862 → $116,818 → $122,341
Immediate Support: $105,189
Major Support Below: $97,205
Potential Setup:
A confirmed breakout above $108,700 with volume could initiate a rally toward the next resistance zones.
Bulls must hold the $105,000 area to avoid another deep pullback into the lower structure.
Bias:
Cautiously bullish — market is waiting for a catalyst to trigger follow-through.
Stay patient, and watch for confirmation through price and volume.
DYOR. Not financial advice.

BITCOIN CRASH INCOMING!!! (Brace Yourself Now???) I am breaking down MARKETSCOM:BITCOIN and the potential completion of the 4th wave on an leading diagonal which might work as an early warning of a crash towards $93k!
Wait for the confirmations, and play the market with a proper trading strategy that you have backtested enough to be able to say that you will be long-term profitable. That means make sure your trading system is good enough that you always have an edge and a great enough money management system to make sure that you are giving your edge enough space to play out in the long run and be robust against losing streaks!
