Today's BTC trading strategy, I hope it will be helpful to youBitcoin is currently fluctuating around $105,500, rebounding 4.5% from yesterday's low of $101,000 and successfully breaking through the key psychological threshold of $105,000. Looking at recent trends, the price touched $105,000 in early June before pulling back, and now standing above this level again indicates that bullish forces are attempting further breakthroughs. Notably, this rally has been accompanied by continuous inflows of institutional capital—BlackRock's Bitcoin ETF (IBIT) has reached a scale of $71.9 billion, holding 660,000 BTC, making it the largest institutional holder in the market. Such "whale"-level position changes provide solid support for prices.
The market is currently in a phase where an "institutional bull market" intersects with an "emotional market". $105,500 is both a breakthrough point and a divergence point between bulls and bears. Investors need to maintain rationality amid greedy sentiment: in the short term, take advantage of volatility for high-throw and low-suction trading, while in the long term, adhere to the overarching logic of increasing institutional holdings and loose liquidity to seize opportunities amid fluctuations.
Today's BTC trading strategy, I hope it will be helpful to you
BTCUSDT BUY@104500~105500
SL:102500
TP:106500~107500
BTCUSDT.5L trade ideas

Good moment for try to Buy BTCGood moment for try to Buy BTC. Very good down movement and now we make small step of the up. This point can be point for start to move new up trend with update local highest high. Stop to previous local low bar. Will see...

Today's BTC trading strategy, I hope it will be helpful to youBitcoin is fluctuating around $101,000, like driving to a crossroads. Looking down, the average price over the past month is supported at around $100,000. Looking up, $105,000 seems like a hurdle. In the United States, although the possibility of a rate cut in July is low (only 10%), some Fed officials have said they support rate cuts if inflation is under control, which has made the market expect easing in the second half of the year. More importantly, the United States and Hong Kong, China, are issuing "legal IDs" for stablecoins. Large companies like JD.com are applying for licenses, which may make Bitcoin transactions more convenient in the future, equivalent to adding fuel to the market. Large companies are also voting with their actions. For example, MicroStrategy continues to buy Bitcoin, indicating that long-term optimists have not wavered.
Today's BTC trading strategy, I hope it will be helpful to you
BTCUSDT BUY@100000~101000
SL:98000
TP:102000~103000


BTC at the Crossroads — $91k Demand or Deeper Flush to $76k?🎯 BINANCE:BTCUSDT Trading Plan:
Scenario 1 — Bullish Reclaim:
If price reclaims 1D 50EMA and $104k, bias flips bullish; look for continuation toward ATHs
Scenario 2 — Base Case (Favored):
Remain patient for a move to $91k–$92k; swing-long setup on signs of strength or iH&S formation
If $91k–$92k holds, expect a summer rally and new ATHs later in 2025
Scenario 3 — Breakdown:
If $91k fails, prepare for deeper move to $73k–$76k; this is the “max long” zone if tested
Must hold here; below $73k–$76k, next support is $55k
🔔 Triggers & Confirmations:
Long only above $104k + 1D 50EMA, or after bullish structure at $91k–$92k
Major long only on strong support at $76k, with clear confirmation
📝 Order Placement & Management:
Buy: On reclaim of $104k (trend confirmation) or at $91k–$92k with iH&S/reversal pattern
Backup Buy: If $76k is tagged with confirmation
Stops: Under $91k or $73k (based on entry)
Targets: New ATHs for late 2025
🚨 Risk Warning:
Losing $91k opens path to $76k; losing $76k is a major structure break
Don’t knife-catch — wait for confirmation at each level

Bitcoin Poised to Reach 111500Bitcoin Poised to Reach 111500
Bitcoin faced a strong support zone for the second time during this month near 104K.
The pattern is taking a complex shape but overall remains supported by the Geopolitical situation as well.
During the last 5 hours BTC bounced from that zone showing a strong momentum and is poised to test the old structure zones again 107855 ; 108710 ;
The other important zones that may have more value are 110230 and 111500
You may find more details in the chart!
Thank you and Good Luck!
❤️PS: Please support with a like or comment if you find this analysis useful for your trading day❤️

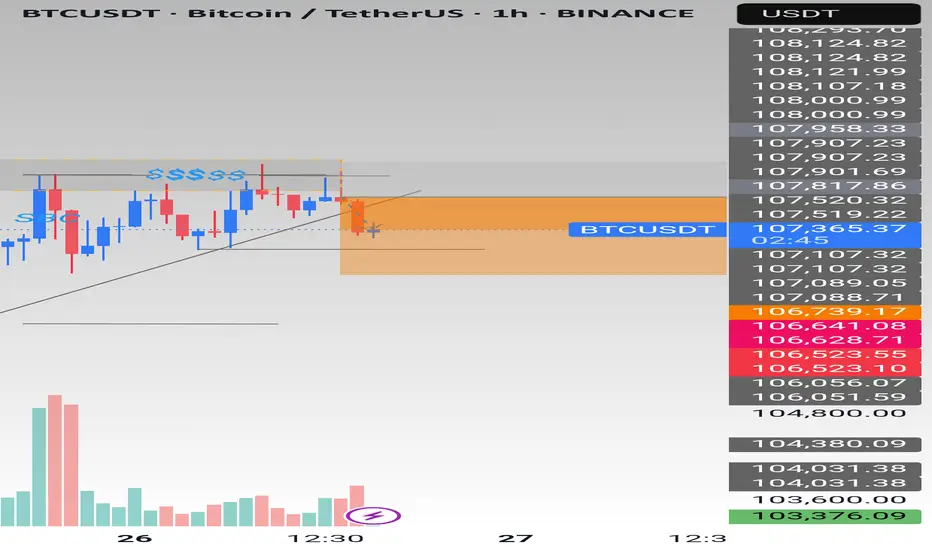
BTCUSDT Short Setup Below Major Trendline ResistanceBTCUSDT is currently testing the upper boundary of a descending trendline, which has acted as strong resistance over multiple touches. Price is now at $106,300, a key area aligned with previous rejections and now forming a potential lower high within the structure.
This setup presents a short opportunity, with:
- A clear rejection level at the descending trendline.
- A defined Stop Loss at $108,270, just above recent swing highs and the upper trendline.
- A Take Profit target at $100,559, a level near the bottom channel and prior support.
Trade Parameters:
- Entry: ~$106,300
- Stop Loss: $108,270
- Take Profit: $100,559
- Risk:Reward Ratio: ~1:2.91
A breakdown from this level could trigger continuation to the downside, while a close above the trendline with momentum would invalidate the setup.
Bias: Bearish Rejection from Trendline
Confirmation: Strong wick or bearish engulfing candle near the resistance zone

Good moment for try to Buy BTCGood moment for try to Buy BTC. A good triangle has formed. There are prerequisites for its upward breakout. Very good risk/reward ratio. Stop below the triangle. Let's see...
Bitcoin Weekly Ultra-BearishThe 100K support is still valid but the weekly timeframe chart isn't looking good.
Good afternoon my fellow Cryptocurrency trader, how are you feeling today?
Bitcoin peaked the week 19-May. Then we have bearish action only.
The week after 19-May was red, then two neutral weeks and a continuation this week. It looks pretty bad right now, terrible to be honest.
» The main support range sits between $82,500 and $88,888.
Thank you for reading.
This support zone will only become active is 100K breaks on the weekly timeframe.
Namaste.

Once again a perfect time to enter a short
As we are closing in to key resistance area we can see that we are getting a lot of smaller bodied 4H candlesticks. This is indicating a weak buy side and that we are looking to top out!
We also got overbought on the hourly RSI and the MACD has flipped bearish
Combining a crocodile tooth shaped formation taking form on the 15min, a rejection from the downward sloping trend line (third rejection indicates strong trend line) and that we are looking to reverse at key resistance. I entered a 100x short at 106375.
As I am writing we also got in another confirmation on the hourly timeframe. As we can see we got a nice bearish engulfing candlestick.
I think the chart speak for itself. We are about to go down big time!

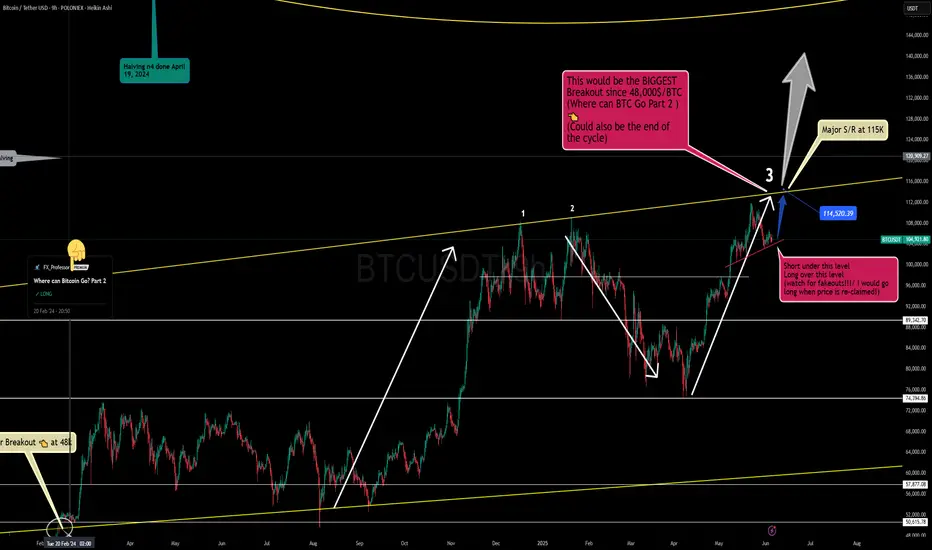
Where Can Bitcoin Go? Part 7Title: Where Can Bitcoin Go? Part 7
Post:
🌍📊 Where Can Bitcoin Go? Part 7 🧭🔥
This is it — Part 7 of our ongoing macro Bitcoin analysis — and this one is rooted in the three all-time trendlines that I’ve used for years to map out Bitcoin’s biggest moments.
We are now heading north, potentially to do something historic : test the upper trendline resistance for the third time . 📈
When Bitcoin does this, it tends to either break out massively ... or signal the end of a cycle . That’s why this zone — 114.5K to 115K — is critical . A successful breakout here and $100K becomes history . It would unleash Bitcoin into a new phase of its long-term bullish evolution. 🦅
On the flip side: this might also mark the final resistance of the current cycle . Either way, it’s a zone where serious decisions will be made — and manipulation will likely spike. 👀
🔑 Key Levels:
114,520–115,000 : Breakout zone — reclaim this and we’re headed higher.
97,770 : Key support — fail to hold, and we reassess the bullish case.
🎥 Want to better understand the levels in play? Watch my latest video idea, where I draw comparisons between BTC now and the Brexit 2016 setup. This will help you see why I’m preparing for major volatility . 🚀📈 Bitcoin smells like 'Brexit to the NORTH Pole!' 💥🇬🇧
I’ll post the video link below once live — keep an eye out for it!
👇 Previous post: “Bitcoin smells like 'Brexit to the NORTH Pole!’”
One Love,
The FXPROFESSOR 💙
ps. Big breakout at 115k or end of cycle? I am hoping for the first!
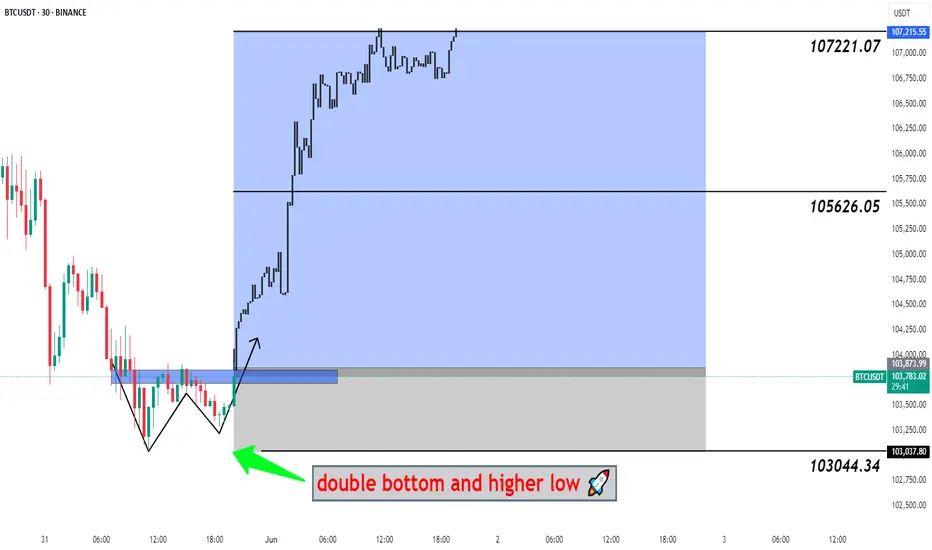
#BTCUSDT Big Pump Next Hour - Bitcoin, BTCUSD, BTCUSDT 📉 Double Bottom Pattern Forming – Potential Reversal Setup
The current price structure is showing signs of a Double Bottom – a classic bullish reversal pattern. After an extended downtrend, this pattern suggests that the market may be preparing for a trend reversal from this key demand zone.
🔹 Trade Setup
Entry, Targets, and Stop Loss (SL) are marked on the chart.
Entry: Upon breakout confirmation above the neckline.
Stop Loss: Just below the recent swing low to manage downside risk.
Targets: Calculated using the measured move method from the bottom to the neckline .
🔹 Risk & Money Management (Professional Approach)
To maintain consistent profitability and protect capital, strict risk management is essential. For this setup:
🔸 Position Sizing: Based on a fixed % of total capital (typically 1–2% of account equity per trade).
🔸 Risk-to-Reward Ratio: Minimum of 1:2, ideally higher.
🔸 Stop Loss Discipline: No arbitrary changes after entry. SL only adjusted for breakeven or trailing stops once price moves favorably.
🔸 Trade Management: Secure partial profits at key levels, trail stops as structure forms.
🔸 Capital Allocation: Avoid overexposure. Trade fits within overall portfolio strategy.
💬 Let the setup come to you. React, don’t predict.
🔁 Like, comment, or share your thoughts below!
BINANCE:BTCUSDT BITSTAMP:BTCUSD COINBASE:BTCUSD BINANCE:BTCUSDT.P INDEX:BTCUSD CRYPTOCAP:BTC.D CRYPTO:BTCUSD BYBIT:BTCUSDT.P BINANCE:BTCUSD
Premium zone tagged — now we watch how the Smart Money reactsBitcoin just tapped into the 108,151 level — the top of a measured premium range and a likely area where profit-taking begins and fresh distribution footprints form.
This run-up wasn’t random. Price surged from inefficiency, cleanly filled the fair value gap (FVG), and is now flirting with a key liquidity pocket.
Here's what the structure says:
Premium reached: 108,151 (0% fib)
If rejection holds, Smart Money looks to discount entries:
0.236: 106,136
0.382: 104,889
0.5: 103,882
Deep retracement zone: 0.618 at 102,874
Final defense for bulls? The unmitigated FVG block between 101,440 → 99,613
Possible Playbook Scenarios:
Quick retrace → higher high:
Bounce off 104,889 or 103,882 before attacking 108,967+
Deeper sweep:
Into 102,874 (0.618) before Smart Money steps in again
Invalidation:
Break below 99,613 closes this bullish narrative and confirms a structural break
TL;DR Execution Logic:
Wait for retracement into 0.5–0.618 fibs
Look for bullish reaction (engulfing or SFP)
Upside targets:
108,151 (retest)
108,967 (liquidity sweep)
Further upside if momentum sustains

BTC trade plan🚨 BITCOIN – Eyeing $135K Before the Real Drop? 🚨
📆 Timeframe: 1D | Exchange: BINANCE
🧠 Elliott Wave Breakdown:
After completing Wave 3 near the $109K level, BTC entered a classic A-B-C correction.
We're currently breaking out of a bullish flag, hinting at the final leg Wave B rally still to come!
📈 Wave B Target Zone:
🎯 1.0 Extension: $135,920
🔴 1.236 Extension (Max Spike): $145,000
This zone is our “Red Box of Rejection”, where a strong reversal is likely as Wave C kicks in.
A sharp Wave C dump could target the 1.618 Fib extension at $74,576 — a textbook retracement level for deeper Wave 4 corrections.
That area would offer a generational buying opportunity heading into Wave 5, targeting above $220K+!
🚀 Final Wave 5 Target:
💥 1.618 Extension: $221,993+

DeGRAM | BTCUSD once again trading above $105k📊 Technical Analysis
● Fresh bounce off the confluence of the 8-month up-sloping purple trend-line and 102-103 k green demand box prints a higher-low inside the rising wedge, keeping bulls in control despite June’s pull-back.
● Price is reclaiming the minor down-trend line from the 12 Jun high; a daily close above 106 k confirms a bear-trap and unlocks the 111.8-112.5 k supply at the wedge cap.
💡 Fundamental Analysis
● Spot-ETF desks absorbed >5 400 BTC in the last three sessions while exchange reserves fell to a four-year low, signalling supply drain.
● Cooling US PCE expectations trimmed real yields, and Mt Gox repayment delays ease overhang fears—both supportive for risk assets.
✨ Summary
Long 102–104 k; hold above 106 k targets 111.8 k → 115 k. Bull thesis void on a 16 h close below 99 k.
-------------------
Share your opinion in the comments and support the idea with a like. Thanks for your support!

The Pattern That Could Launch BitcoinSpotted a long-term inverted head & shoulders pattern forming over a 7–8 month stretch on Bitcoin — much more reliable than short-term setups. If this bullish structure plays out, we could be looking at a breakout that pushes BTC firmly into price discovery.
I’ve included local Fibonacci levels on the chart, though I couldn’t fit the macro one (going from $4k → $69k → $15k — the 1.618 extension of that larger swing lands at $119,800. That could be a key resistance target if we clear the ATH and continue the uptrend. After that, there's the smaller timeframe, but more recent, fib ext 1.618 sitting at $131k.
I'd be very cautious of a failed pattern if $101k doesn't hold. As a last support, 95k and the red 20EMA might hold.
Let’s see how this plays out 🚀

Bitcoin to revisit $100k | Summer price target = $120kGeopolitical tension is causing fear in the markets. Today, Bitcoin fell from $107.7k to current price $105k with no sign of buyer support whatsoever, printing 11 consecutive H1 red candles intraday. Like a hot knife through butter.
At $105k, there is very little support. Sell volume absolutely overshadowed the tiny buy volume. Bulls have yet to close a green candle. I believe in the next few hours Bitcoin will be trading at $104k, followed by the first stop $102k.
$102k can serve as an entry point, depending on how price reacts. $100k is the optimal entry point for maximum profit, after mass liquidations. Retail traders are confident that the liquidity hunt is over after the initial tap, placing stops and liquidation levels at $100k.
Invalidation level will be beyond the 200SMA. The 200SMA have historically proven itself time and time again as a safe zone during rallies after golden crosses.

BTC SELLIn higher Time Frame Poi zone Tap and Nd Also Liquidity Swift in that zone I plan to sell here first Target 106000.
BTC — Altcoin Sentiment Hinges on BTC Holding BINANCE:BTCUSDT is consolidating within a well-defined range between ~$102K and ~$112K, with a bounce off the lower boundary now challenging midrange resistance. As long as BTC trades within the range, altcoins are expected to remain strong.
🟩 Midrange: $106K
• 0.618 fib and prior supply zone
• Key inflection for either a move higher or return to range low
🔻 Range Low Support: $102K
• Break below this = plan invalid
• Expect deeper BTC correction and altcoin bleed in that scenario
📈 Bias:
• Altcoins strong = only valid if BTC holds this structure
• Rotations likely while BTC moves sideways or grinds higher
• Upside target (range high): ~$111.9K
📌 BTC stability = altcoin opportunity. Breakdown from range? Get defensive fast.
Today's BTC trading strategy, I hope it will be helpful to youToday, Bitcoin's price is like a ball caught between two forces, swaying around $103,300. On one side, the Fed just said "let's wait and see" (latest report states the impact of tariffs is uncertain, so no hurry to cut rates), putting a temporary brake on leveraged crypto speculators. On the other side, Middle East tensions are on a rollercoaster—Israel and Iran alternate between clashes and talks, but Iran's move to accept Bitcoin for oil purchases has put a floor under prices. Right now, the market feels like a spring compressed too far: $103,000 acts as a strong support (like a sofa cushion), while $107,000 looms as a ceiling, likely confining short-term moves to this range.
Recent Price Dynamics
The $103,000 level has emerged as a critical support zone, functioning like an "invisible mattress" for prices. During recent volatility, prices repeatedly rebounded when testing this level, indicating many investors view it as a relative low—willing to absorb selling pressure here. For example, on June 13, when Bitcoin fell due to Middle East tensions, it quickly bounced after hitting a low of $102,614, confirming the support at $103,000.
Today's BTC trading strategy, I hope it will be helpful to you
BTCUSDT BUY@102000~103000
SL:101000
TP:105000~106000

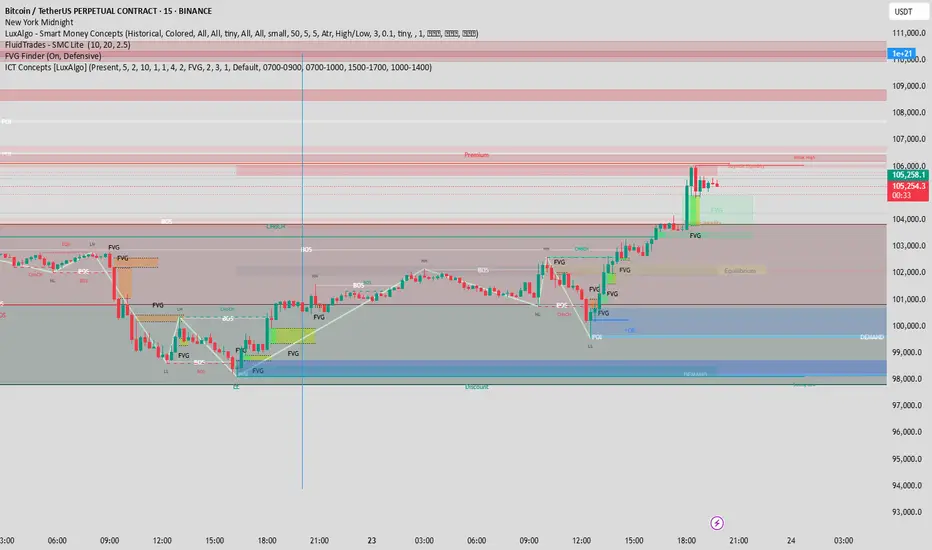
Breakdown: BTC/USDT 15m – Riding the Trend
🔹 Smart Money Confluences:
CHoCH at the bottom with a clear liquidity sweep (LL formed, then reversal)
Multiple FVGs aligned with structure—price keep respecting mitigation blocks
POI + OB near $99,800 gave the final long confirmation
BOS and strong HHs show clean bullish order flow
🟩 Premium/Discount Zones:
You entered at da discount, targeting premium—textbook ICT
Midline equilibrium held nicely before bullish continuation.
💡 Final Push:
Price is consolidating under weak high and buy-side imbalance.
Possible continuation if new FVG near $105k holds
🔔 Watch for:
Higher timeframe liquidity grab above $106k
Rejection near inefficiency = potential partial TP zone
A Disciplined Approach to BTC/USDT - Wait for the Right Set Up!Right now, I’m closely monitoring BTC/USDT — and what immediately jumps out is how aggressively this rally has pushed upward 🚀. We’ve seen price climb into a key external range high, taking out liquidity that was likely sitting just above those prior highs 💧.
This kind of move is often where institutional players step in to offload positions, as the liquidity makes it easier to find counterparts for previous accumulation phases 🏦. The way this price action is unfolding, I wouldn't be surprised to see a correction or retracement soon.
With the market this stretched, I’m not looking to get long here — especially not while BTC is trading at such a clear premium 🎯. No edge in chasing the highs.
Instead, I’ll be sitting back, waiting for a healthy pullback and a confirmed bullish structure shift before considering any entries 🔄📊. There’s no need to force trades in these conditions. Patience protects capital 🛡️.
⚠️ As always, this is not financial advice — just my current market perspective.

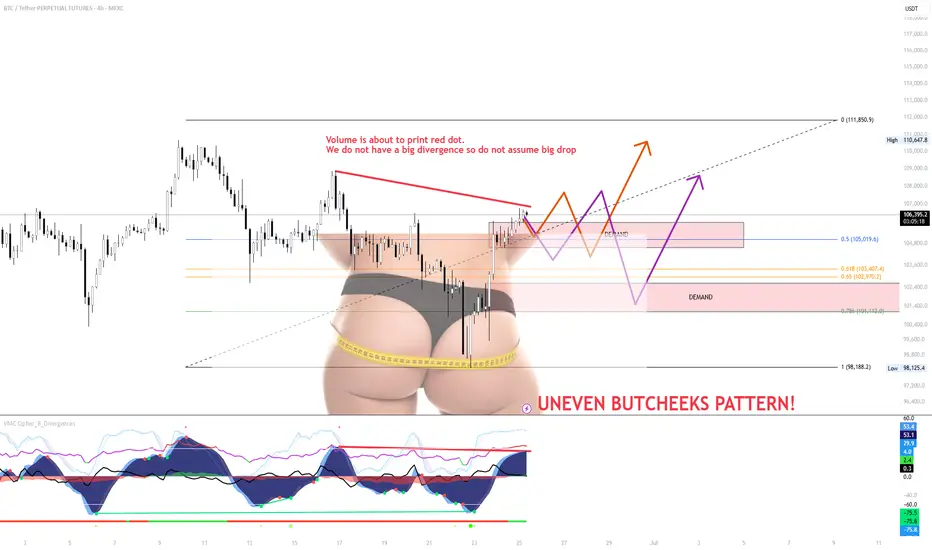
SMALL RETEST on BTC and continuation of BTC TrendThe small range forming just under local resistance is weak and showing signs of exhaustion. Despite a possible red dot printing soon, volume is not confirming a strong bearish divergence, so don’t assume a major drop is guaranteed just yet.
The “Uneven Butcheeks” pattern visually highlights imbalance
A fakeout back into the range, or
A flush to grab liquidity sitting beneath key demand zones.
Key Scenarios
Scenario A (Orange Path)
A breakout through the overhead supply zone could trigger upside continuation toward $111,850.
But unless it’s backed by strong volume and broader BTC strength, I’ll be fading this move.
Right now, this doesn’t look like conviction from bulls — it looks like exhaustion.
Scenario B (Purple Path)
A rejection at current levels or a weak fakeout could break back into the demand zone.
With thin structure below and low buy-side aggression, price could sweep down toward $102.9k–$101.1k, or even lower.
If we get this move, I’ll be watching how buyers behave around the lower demand — that’s where bulls need to prove themselves.
⚠️ Strategy:
Don’t front-run this — let the price confirm or invalidate.
Watch volume. Watch BTC dominance.
Until then, this zone is chop-heavy, and patience = protection.