Bitcoin (BTC): Strong Sell-Off During Weekends | Plan A & BBitcoin was bleeding hard during the weekend when the US decided to join the ongoing war, which is now strongly impacting the economic markets.
As tensions are tightening, we are expecting a similar outcome to happen like we had during the beginning of the UA war, where at the start everything dipped hard, and later we had a strong upward rally.
Remember, people need to store their money somewhere safe, and the safest places are buying gold or Crypto.
Swallow Academy
BTCUSDT.5L trade ideas

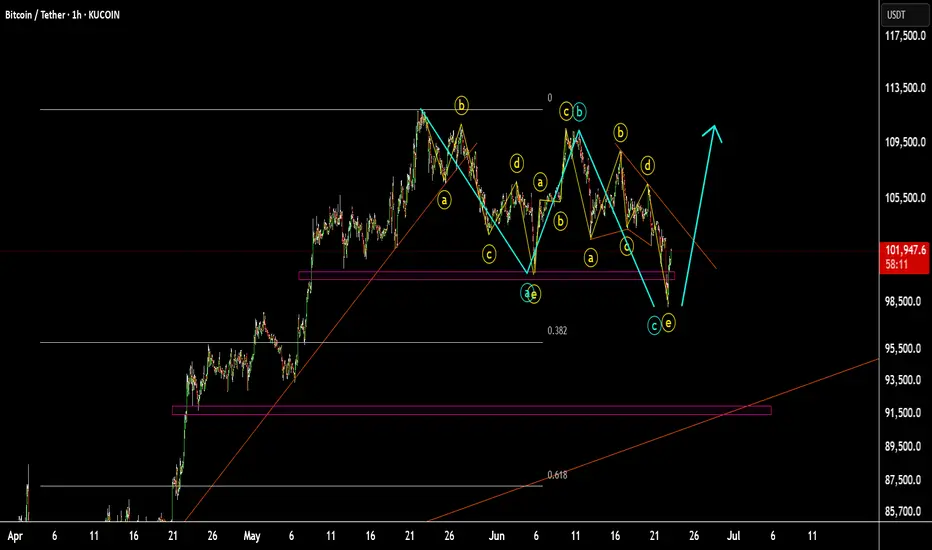
BTCUSD scenario 2#BTCUSD scenario 2 is waiting for 3 (TOP) High and then start to move down again.
scenario 1 is ZIGZAG pattern.
I dont buy at this time.
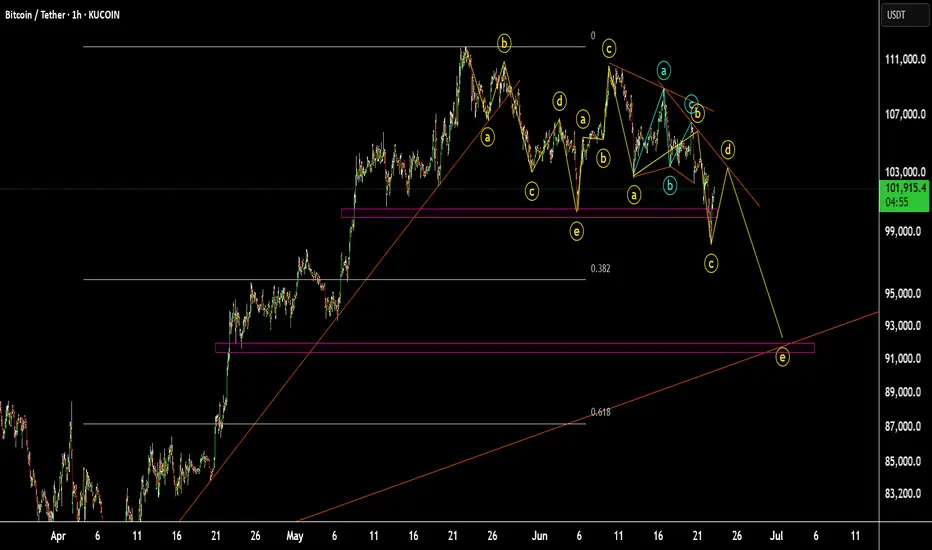
BTCUSD scenario 1#BTCUSDT is bearish umtil 92k.
because of main trendline is break
the main flow is 535 correction in this scenario.
Today's BTC trading strategy, I hope it will be helpful to youBitcoin Trading Strategy: Navigating $101,000 Volatility with a Three-Dimensional Model
Current Bitcoin prices oscillating near $101,000 reflect more than just technical support battles—they embody an expectation gap between policy implementation timelines and institutional fund flows. This strategy constructs a "Policy-Funds-Technology" three-dimensional analysis model, using the U.S. *Genius Act* House voting process and Hong Kong's *Stablecoin Ordinance* countdown as policy anchors, institutional behavior differences (e.g., MicroStrategy增持 vs. Grayscale fund flows) as funding validation, and key technical breakouts as entry signals for a dynamically adjusted trading system.
I. Policy Landscape: Dual Catalysts on the Horizon
- **U.S. *Genius Act* Legislative Progress**: The Senate passed the *Genius Act* with a 68:30 supermajority, and Trump has publicly pressed the House to expedite voting, with markets expecting final legislation by mid-late July. The bill requires stablecoin issuers to maintain 100% dollar/T-bill reserves, effectively integrating stablecoins into the "digital dollar" system. This is expected to attract ~$20 billion in institutional capital via compliant channels.
- **Hong Kong *Stablecoin Ordinance* Launch**: Scheduled to take effect on August 1, the ordinance has prompted institutions like Standard Chartered and JD.com to prepare license applications. The introduction of offshore RMB stablecoins will create new liquidity entry points for Bitcoin.
II. Funding Dynamics: Institutional Long-Term Conviction vs. Short-Term Positioning
- **MicroStrategy's Bold Accumulation**: The firm's holdings surpassed 330,000 BTC after a June 22 purchase, with an average cost of $88,627—current prices yield a 14% unrealized gain, demonstrating corporate investors' long-term confidence.
- **Grayscale GBTC Contrast**: $46.3 million flowed out of GBTC in the week ending June 20, reflecting institutional portfolio optimization ahead of policy milestones.
- **Tron USDT Liquidity Base**: With circulation exceeding $70 billion (50% of global USDT) and $80 billion daily transaction volume, Tron's stablecoin provides robust liquidity support for Bitcoin.
III. Technical Confirmation Mechanisms for $101,000
1. Short-Term Support Validation:
- Price forms a "Morning Star" candlestick pattern within $100,000-$101,000, accompanied by 20% higher trading volume than the prior day.
2. Trend Breakout Confirmation:
- RSI rebounds from below 40 to above 50, coinciding with a decisive price突破 (breakout) of the intraday resistance at $102,000.
**Trading Tactics**:
- **Aggressive Entry**: Long positions on confirmed Morning Star patterns, with stop-loss below $100,000 (2% below support).
- **Breakout Follow-through**: Add to positions above $102,000, targeting $105,000 resistance.
- **Risk Control**: Maintain position sizes below 15% of portfolio, with profit-taking triggers set at 3%–5% intervals.
This framework balances policy-driven structural shifts with tactical technical signals, enabling traders to navigate the volatility gap between institutional long-termism and short-term market noise.
Today's BTC trading strategy, I hope it will be helpful to you
BTCUSDT BUY@101000~102000
SL:98000
TP:103000~104000

$BTC - Short-term OutlookCRYPTOCAP:BTC | 4h
We got a solid bounce off 98k
Next key level is 103.5k–104k. A clean reclaim flips short-term bias bullish.
If price gets rejected again, this likely confirms a bearish retest, and likely leading back down to the 94k–92k value area
Price could range for awhile at this level as we challenge the 104k — prior value acting as resistance.

Your Edge Isn’t Just Technical, It’s PersonalMost traders obsess over their strategy: Which indicator? What session? What entry signal?
But very few stop to ask the question that could change everything: “Does this style actually fit who I am?”
The Truth Most Don’t Talk About
Trading success is not about copying someone else’s edge. It’s about discovering your own edge, and that begins with self-awareness .
And it hit deep because this is the part of trading psychology we often skip.
Some Real Talk
If you’re naturally calm and risk-averse, trying to scalp news spikes will drain you.
If you’re fast-thinking, decisive, and love volatility, swing trading might feel like watching paint dry.
If you thrive on rules and structure, discretionary trading might feel chaotic.
If you're intuitive and adaptive, being forced into mechanical rules may kill your edge.
You’re not underperforming because you lack discipline, you’re likely just misaligned.
What Changed for Me
I stopped trying to “be the trader” everyone said I should be. And I started trading like me.
I built a system that fits my mental rhythm.
I gave myself permission to simplify.
I became consistent not because of a new setup, but because I removed internal friction.
Final Thought:
Your best trades don’t just come from the chart. They come from a place of alignment, when your mindset, risk tolerance, and system flow together. So before chasing another strategy, ask yourself: “Is my trading style in tune with my personality?”

BTCUSDTBULLISH TREND
Major Zone = Yellow area
Can take entry on break of HH/
instant buy/
or any fib level 0.5 or 0.618
Sl is mentioned on the chart, you can adjust your tp's according to ur sl and entry.

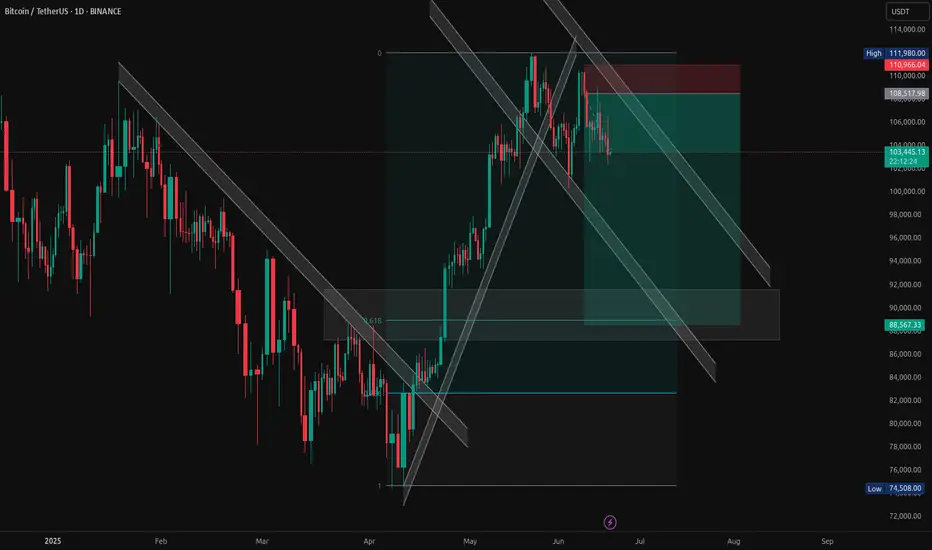
BTC/USDT – Bearish Channel Rejection with Confluence ZonesBitcoin is showing signs of weakness after rejecting the top of the descending parallel channel. This trade idea is based on multiple confluences:
Bearish rejection at key resistance near $110,000–$112,000
Price respecting the descending trendline
0.618 Fibonacci retracement zone acting as potential demand
Risk-reward structure targeting deeper support near $88,500
Previous bullish channel broken – now acting as resistance
📌 Entry near: ~$108517
🎯 Target: ~$88500
🛑 Stop Loss: ~$111980
Looking for further downside continuation if this structure holds. Watch how price reacts at mid-channel and the demand box.

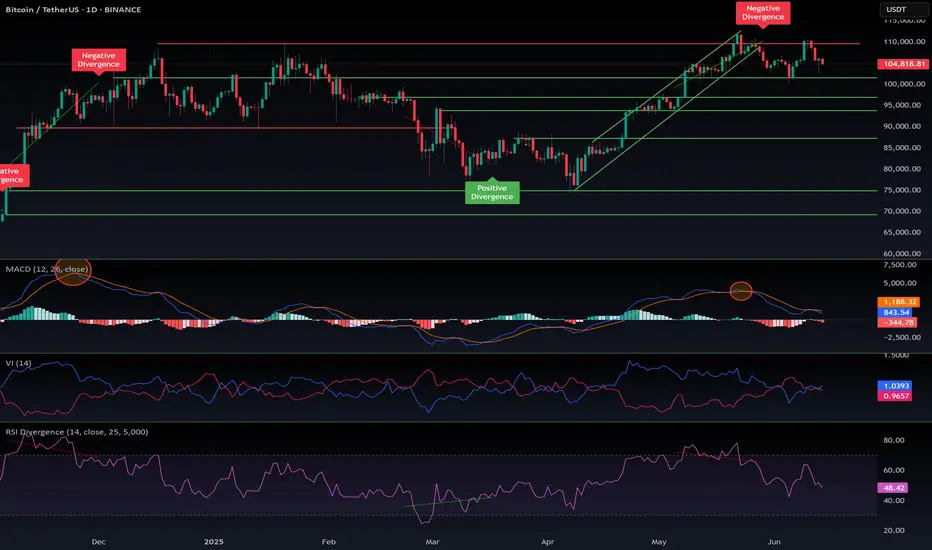
BTC Correction's 📉 Significant Bitcoin Correction During Uptrend
After a strong bullish rally, Bitcoin has entered a correction phase, retracing nearly 25% of its recent gains. Interestingly, this correction aligns exactly with the 200-period moving average on the 4-hour chart, marking a potential key support level.
🔍 Is Bitcoin’s Correction Over or Just Beginning?
The overlap with the 200 MA could signal the end of the correction, but if this zone fails to hold, deeper targets between the 35% and 75% retracement levels may come into play.
🛡️ Potential Support Levels for Bitcoin if the Correction Continues:
First support: 102,200 USD – 25% correction
Second support: 93,200 USD – 35% correction
Third support: 84,100 USD – 50% correction
Fourth support: 74,600 USD – 75% correction

BTC is still bearish (2H)This analysis is an update of the analysis you see in the "Related publications" section
The red zone seems to have had enough orders to reject the price downward. It is expected that the price will drop at least to the green zone below.
There will be some fluctuations along the way.
A daily candle closing above the invalidation level would invalidate this analysis.
For risk management, please don't forget stop loss and capital management
Comment if you have any questions
Thank You

Bitcoin (BTC/USDT) – Bearish Continuation After Failed Support !Bitcoin attempted to hold the $101,409 support level but failed to sustain above it. The breakdown confirms weakness, and the chart now suggests a continuation of the downtrend if bulls don’t reclaim lost ground quickly.
Technical Breakdown:
Failed Bounce: BTC briefly bounced near $101.4K but got rejected and closed back below the zone.
Bearish Structure: Price continues forming lower highs and lower lows — a clear downtrend.
RSI at 30.34: Close to oversold but still room to fall, which means downside isn’t exhausted yet.
Market Sentiment: Weak hands are exiting, and support zones are getting tested faster than they’re defended.
Key Levels to Watch:
Resistance:
$101,409 – Immediate level, now flipped to resistance
$103,573 – Strong barrier if bulls attempt recovery
$105,807 – Major horizontal resistance and lower high zone
Support:
$97,340 – Next major support zone (possible short-term bounce)
$93,343 – Key level if $97.3K fails to hold
$92,200 – Final support before panic could set in
Trade Idea – Bearish Bias:
Short on Retest Zone: $101.4K – $102K
Stoploss: Above $103.6K
Take-Profit Targets:
TP1: $97,300
TP2: $93,300
TP3: Optional – trail lower if breakdown continues
What Bulls Need to Do:
Reclaim $101.4K fast with a strong close above it on the 4H chart
Otherwise, sellers remain in control
This is not financial advice. Always do your own research (DYOR) and manage your risk accordingly.

BITCOIN BEARISH SETUPBitcoin (BTC/USDT) – Breakdown from Double Top Confirms Bearish Trend Continuation
The 4-hour chart of BTC/USDT (Binance Perpetual Contracts) presents a textbook double top formation followed by a confirmed breakdown below structural support levels. The bearish trend has already met its first target, and technicals suggest the move could extend lower toward the key demand zone around $96,000.
🔍 Key Technical Highlights:
Double Top Pattern: Clear double top structure formed between $109,000–$110,000, followed by a strong rejection.
Support Break: Price broke down below key support at ~$105,000, triggering a sell-off and validating the bearish reversal.
Bearish Retest: After the breakdown, price retested the broken trendline (highlighted with a red zone) and failed to reclaim the range.
First Target Hit: Price achieved the first projected support zone at around $101,000.
Next Target: Based on measured move projection and previous structure, the next downside target lies near the $96,000 mark.
📉 Outlook:
The structure remains bearish as long as BTC trades below the broken support-turned-resistance zone (~$105,000). Momentum favors continued downside toward the next key zone unless a significant bullish reversal signal emerges.

BTC/USDT Smart Money Roadmap | Daily FVG + ATH TargetSeenForex | ICT-Based Smart Money Analysis
Bitcoin is currently reacting within a Daily Weak Fair Value Gap (WFVG) after a series of liquidity sweeps ($$$). Price structure suggests two possible scenarios:
✅ Bullish Continuation Setup:
Daily WFVG acting as potential mitigation zone
Targeting ATH liquidity above $112,000
Confirmation required: bullish BOS or entry model near FVG
🔄 Bearish Liquidity Sweep Scenario:
Deeper liquidity draw possible below WFVG
Next potential demand zone around $85,000–$87,000
Clean inefficiency (FVG) below waiting to be filled
🧠 Wait for price reaction inside WFVG or deeper zone before taking action.
📊 Strategy Used:
ICT | Smart Money | Liquidity Sweep | Order Block | BOS | FVG
📅 Date: June 19, 2025
🔍 Analyst: SeenForex
#BTC #Bitcoin #BTCUSDT #SmartMoney #ICT #FVG #Liquidity #TechnicalAnalysis #CryptoTrading #SeenForex #OrderBlock #TradingViewIdeas

Wednesday, Trade of the day 📊 Wednesday Trading Update
Tuesday didn’t give us any tangible plays — price action was choppy, unconvincing, and mostly noise. But that’s behind us. Let’s see what Wednesday brings, especially with London and NY sessions ahead.
Midweek is notoriously volatile for BYC, and historically, Wednesday has often been the day that breaks the range or gives us a proper deviation setup — so eyes sharp today 👀.
My trades today will stick to standard range plays, nothing forced. We're still sitting above 4H supply, and unless we get a clean breakout with structure shift, I’ll remain cautious and reactive, not predictive.
Here’s what I’m watching today:
👉 Look for clear market structure shifts on the LTF (lower timeframes)
👉 Divergences can give early signs if you're using oscillators
If I get time, I might record a quick session later. No promises, but I’ll update if that changes.
🎥 If you're unsure what to look for, go back through the video archive — everything you need has already been broken down in detail.
📅 Weekly Schedule:
Wednesday – ❌ No class
Thursday – ❌ No class
Friday – ❌ No class
Let’s stay sharp — volatile Wednesdays tend to reward patience and precision.

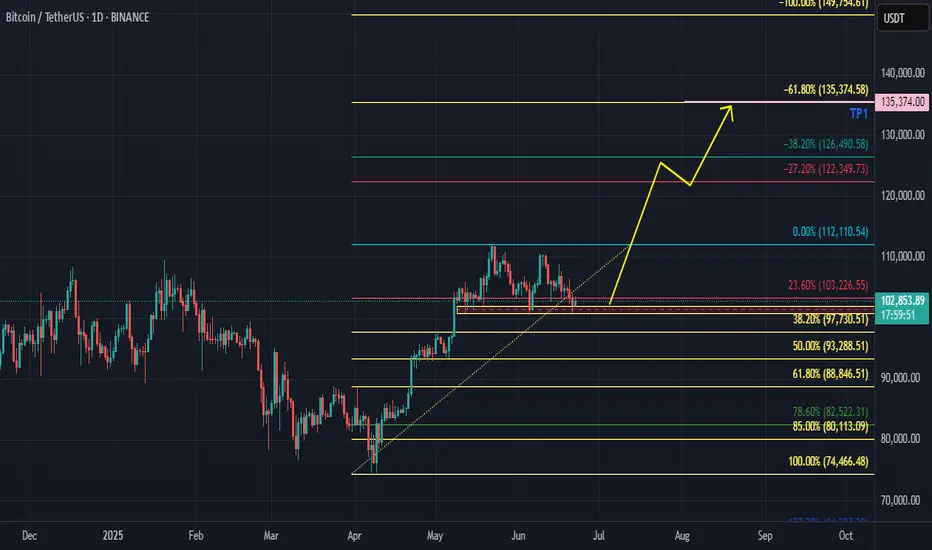
BTCUSDT Daily 22th JunI have drawn Fibonacci Retracement and specified TP 135k$. I think BTC would may bullish.
$BTC Bounce Targeting $112K?CRYPTOCAP:BTC is trading within a descending channel and has just bounced off the lower support level near $101,400.
If this rebound holds, we could see a push toward $107,000–$ 112,000.
However, it remains in a downtrend, so any upside may face resistance unless the channel breaks with strong volume.

$btc/usdt short swing sh set upth:
sh htf liq + htf sh fib (1.136/1.272) + anti cypher harmonic pattern

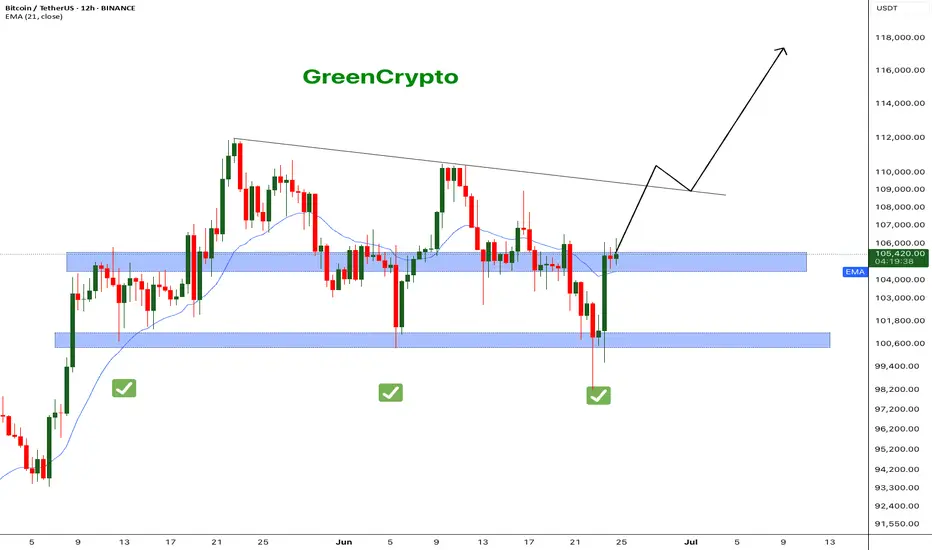
Bitcoin - What's next ? BINANCE:BTCUSDT (12H CHART) Technical Analysis Update
Now that ceasefire is announced, bitcoin price has successfully recovered to the resistance level and currently trading at the resistance zone. It's critical that bitcoin breaks this resistance for it to hit the next resistance around 110K .
I'm expecting price to reach 110k this week and we can see some consolidation in that range before moving further up.
Follow our TradingView account for more technical analysis updates. | Like, share, and comment your thoughts.
Cheers
GreenCrypto
Bitcoin and the descending channel it consistently followsAccording to the UTC+3 time zone, there is a Bitcoin channel between the 23:00 and 03:00 candles on May 21, which uses the width of the channel (the yellow channel). If we copy the same channel and place it at the upper wick of the 15:00 candle on May 27, we get the green channel. Similarly, by copying the yellow channel and aligning it with the lower wick of the 03:00 candle on May 22, which is one of the first two white candles at the start of the channel, we get the orange channel. The blue channel, on the other hand, is my prediction. In addition, not only the 0 and 1 points (solid line) of the channels but also the 0.5 (short line), 0.25, and 0.75 (dotted lines) levels act as support and resistance.

Will Bitcoin's growth continue, or is this just a correction ?BINANCE:BTCUSDT After the weekend, the price showed a strong recovery. Currently, it is trading above the monthly and weekly pivot points. However, if these levels are broken without a subsequent buy-back reaction, we can expect the downward movement to continue as part of a higher-timeframe correction. Otherwise, we may see either a local correction or an upward move from current levels with the aim of breaking through the resistance zone and trendlines. All targets are outlined in detail in the video idea.
Write a comment with your coins & hit the like button and I will make an analysis for you
The author's opinion may differ from yours,
Consider your risks.
Wish you successful trades ! mura

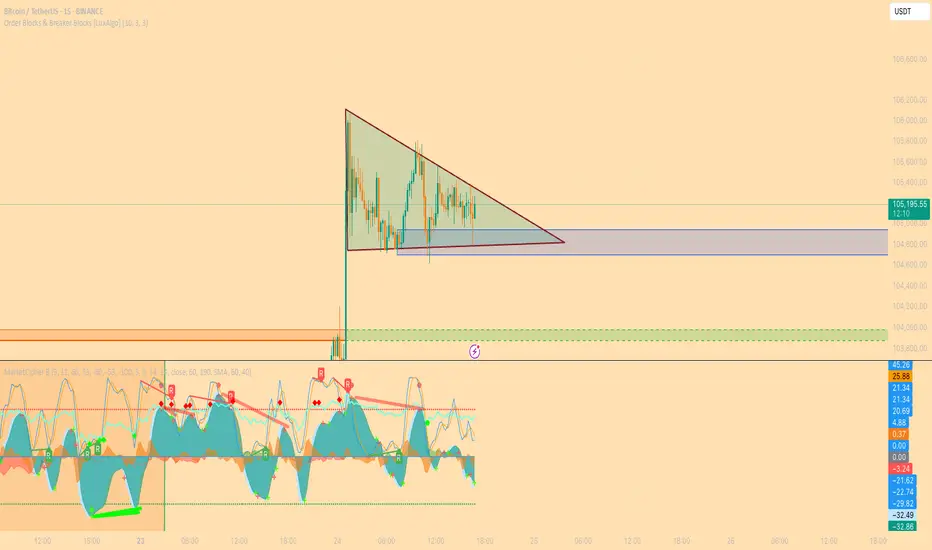
15 Min Bullish BTC pennant 15 minutes before POWELL testimonySelf-Explainatory. let's see if this LTF pennant works!
$BTC correction: targets 101k, 97.5k, 94k, 87kThe hype is peaking — institutions, banks, Wall Street, and even governments are buying Bitcoin.
Yet despite the frenzy, BTC has been rejected three times around the $110K level and appears to be heading into another correction.
Bitcoin maximalists are pushing a strong FOMO narrative to attract retail investors, but several factors are pushing back:
- Psychological barrier: At these price levels, retail investors are hesitant. Owning just a "fraction" of a Bitcoin doesn’t appeal to the average person.
- Geopolitical tension: The conflict with Iran is serious. This isn’t a small, isolated country — Iran is a millennia-old civilization with global alliances. This situation won't resolve quickly or easily like Libya, Syria, or Iraq.
- Oil price surge: Escalating tensions could disrupt the Strait of Hormuz, a critical route for global oil. Western sanctions on Russia already strain supply — if Iran joins, where will Europe get its energy? U.S. supply won’t be enough. Expect a spike in inflation.
- Recession risks: Persistent inflation could drive a recession in the second half of the year.
- Trade wars & tariffs: No resolution, just chaos.
- Ukraine-Russia war: Still unresolved. Still draining global stability.
In short, the world is burning — and this is terrible for markets.
Bitcoin maximalists — some even selling company shares to buy more BTC — may soon face the harsh reality: Bitcoin needs a deeper flush before it can rally again. Retail won’t return until altseason clears the way and resets sentiment.
In a cycle dominated by propaganda, institutional manipulation, and global unrest, predictions are fragile. The only guide left: the chart.
Technically, we’re in correction mode again. Comparing with past cycles, potential pullback targets are:
$101K, $97.5K, $94K, $87K
There’s massive support at $74K, but it's unlikely we revisit it soon.
Stay cautious. DYOR.
#Bitcoin #CryptoMarket #BTCUpdate #Geopolitics #Altseason #CryptoCorrection #MacroView #CryptoFOMO #RiskAssets #DYOR