BTC HTF TA- Going as planned.
- Nothing changed
- Prepare for the worst liquidation event where every retail traders are net long in crypto based on their fantasies, hopes and dreams. X has been toxicating them with the ideas of US gov. or US iBank will make them rich.
BTCUSDT.5L trade ideas

Bitcoin (BTC): Buyers Are Accumulating | Breakout Incoming?Buyers have finally shown dominance near the 200EMA, where now we are heading for for the resistance zone, which will be tested.
As we are entering the friday with that kind of buyside volume we might be seeing strong pump during the weekends so that's what we are looking for now.
Swallow Academy

BTC dump time , fake breakout, watch US news todayAny US strike on Iran will lead to a big dump in price

Bitcoin, everyday dump dayNow, we can see everyday is dump day till several days
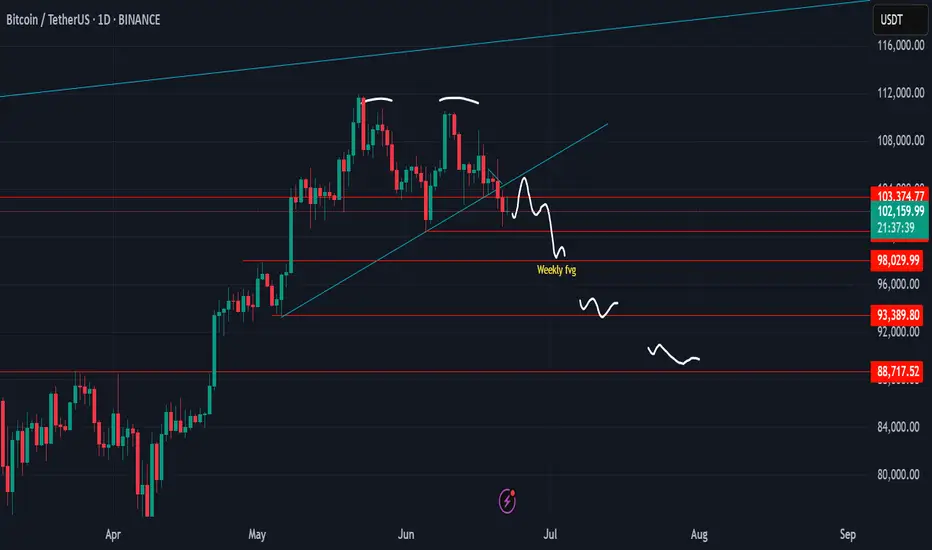
After success breakout trendling and support, then can't back above the lines
Reasonable target is mini pump to retest then dump to 98k, 98k level is support and weekly open fvg
But if 98k break we will see 93k, and if 93k break we will see final of double top target around 88k and altcoin will rug hard again
But if Bitcoin can go back above 108k, maybe this scenario will be invalid
$BTC Breaks Key Support – Bearish Signal Bitcoin has lost the CRYPTOCAP:BTC Breaks Key Support – Bearish Signal
Bitcoin has lost the critical 50 EMA on the daily chart, which has historically acted as a strong support level. This breakdown mirrors the 2021 double top structure and is now hinting at a deeper correction.
🔸 Key Support Zone at $100,000:
Losing this zone increases downside risk. If $100K fails to hold, next visible supports are at $96K and $91K, aligning with past consolidation zones.
🔸 Risk Level at $104,500:
A daily close back above $104.5K would invalidate this bearish view and indicate strength recovery.
🔸 Outlook:
Wait for further confirmation below $100K for potential short setups. Avoid long entries until clear reversal signs appear.

BITCOIN TO 193000!!!!EVERYONE IS WRONG!it has been 5 years that i have been studying the btc and linkusdt cycles, and what i know is that a bull market is coming this summer, starting in july—maybe on the 4th or 7th.

BTC is stuck in a tightening triangle — compression phaseVolatility building up into June 18–19.
Expect a big breakout.
Main scenario: breakout to the upside with a “God Candle” and new momentum for altcoins after prolonged BTC dominance.
Alts have been suppressed, but that’s part of the setup — don’t get tricked by the fake moves.
Stay patient, don’t lose focus, and be ready for a sharp move!

Today's BTC trading strategy, I hope it will be helpful to youWhen Bitcoin prices dip to $101,900—despite the prevailing bearish sentiment—a rational long-position strategy can still be formulated by weighing long-term investment value against potential short-term rebound opportunities. The analysis below covers entry timing, position management, and risk control.
I. Entry Timing Judgment
(1) Technical Signals
Monitor price performance around $101,900. Potential long entry signals include:
1. **Confirmation of bottom patterns**: When prices consolidate near this level to form double bottoms, triple bottoms, or other base structures, and the trading volume during the second/third retest is notably lower than previous attempts—indicating weakening selling pressure. For example, if a double bottom forms near $101,900 with 30% less volume in the second retest than the first, this signals a preliminary entry point.
2. **Technical indicator crossovers**: Track metrics like the Relative Strength Index (RSI) and Moving Averages (MA). A long signal strengthens when:
- RSI breaks above 50 from oversold territory (below 30).
- The 5-day MA crosses above the 10-day MA (golden cross).
- Price breaks through short-term resistance (e.g., $102,500) alongside moderate volume expansion.
(2) News Catalysts
Macro events and industry trends are critical for timing:
1. **Fed dovish signals**: Clues of earlier rate cuts or reduced hiking expectations—boosting market liquidity and benefiting Bitcoin. Align such news with technical signals to enhance long-position reliability.
2. **Cryptocurrency sector tailwinds**: Developments like progress on U.S. stablecoin legislation, relaxed global regulatory policies, or breakthroughs in real-world adoption (e.g., more enterprises accepting Bitcoin payments, higher settlement ratios) can reignite value reassessment. If prices stabilize near $101,900 amid such news, consider entering long positions.
Today's BTC trading strategy, I hope it will be helpful to you
BTCUSDT BUY@102000~103000
SL:101000
TP:105000~106000

BTCUSDT Possible Sell BTCUSDT completed wave 4 of 5 and currently in wave 5 of 5 . wave 5 targets are on green and a possible sell is in place to finish wave 2 of 5 .
Good LUck
#BTC URGENT UDPATE Plus ALTCOINS Strategy.CRYPTOCAP:BTC UPDATE:
Bitcoin looks critical at the moment. The 50 EMA supports nearly $103K if this level breaks, we could see a drop toward $98.5K.
The current structure doesn’t look promising, and it’s wise to stay on the sidelines for now.
Altcoins may offer better opportunities once those lower levels are reached.
The strategy is to ladder in slowly when there are signs of reversal, until then we stay put!
Remember: nothing goes up forever, and nothing goes down forever.
Geopolitical tensions might be fueling this move, but I believe better days are ahead.
Stay patient.
Avoid high-leverage trades during this choppy, sideways price action.
Stay tuned, I’ll keep you updated the moment signs of a reversal appear.
Let me know what you think in the comment section and hit that like button if this post helped you in any way.
Thank you
#PEACE

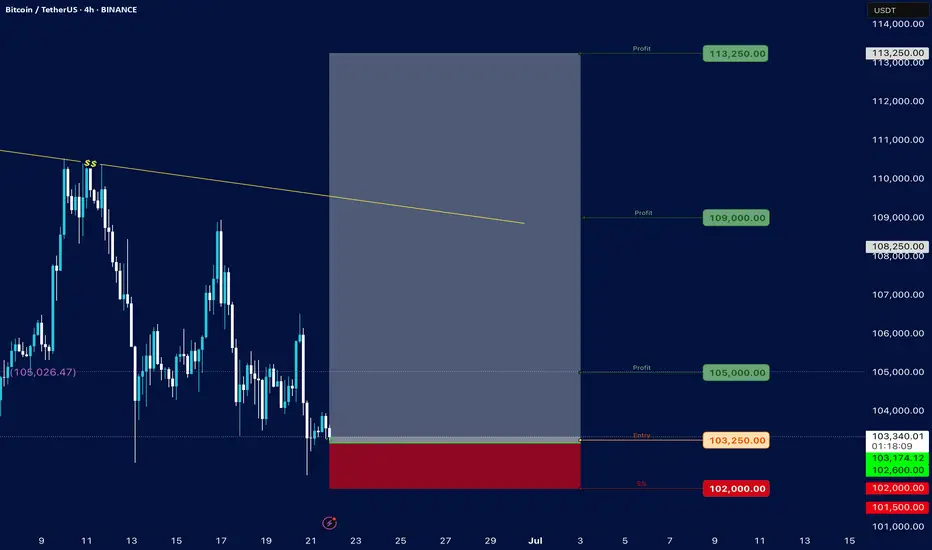
Bitcoin### Bitcoin Price Analysis (June 21, 2025)
#### **Current Price**: $103,236.15 (as of the snapshot)
- The price is hovering near the lower end of the recent range, with key support at **$102,000** (marked as "S/s" on the chart).
- Resistance levels are visible at **$105,000**, **$107,000**, and **$110,000–$114,000**.
#### **Key Observations**:
1. **Support and Resistance**:
- **Strong Support**: $102,000 (critical level; break below could signal further downside).
- **Immediate Resistance**: $105,000 (previous entry point and psychological level).
- **Higher Targets**: $110,000–$114,000 (if bullish momentum returns).
2. **Price Action Context**:
- The price recently rejected the $105,250 level ("Entry") and is now testing lower support.
- The "Profit" markers at $105,000 and $105,026 suggest these were take-profit zones for traders.
3. **Trend and Sentiment**:
- The chart shows consolidation between $102,000–$110,000, with no clear breakout yet.
- A hold above $102,000 could lead to a retest of $105,000, while a break below may target $100,000 or lower.
4. **Volume and Timeframe**:
- The snapshot lacks volume data, but the date range (June–July) suggests a medium-term view.
- Key dates to watch: June 25–28 and early July for potential volatility.
#### **Conclusion**:
- **Bullish Case**: Hold above $102,000 and reclaim $105,000 to aim for $110,000+.
- **Bearish Risk**: Break below $102,000 could accelerate selling toward $100,000 or $99,000.
**Actionable Insight**: Watch the $102,000–$105,000 range for a breakout or breakdown. A rebound from support with volume could signal a buying opportunity, while a drop below $102,000 may indicate further downside.
*(Note: The analysis is based on limited data from the snapshot. For a full assessment, additional indicators like RSI, MACD, and volume would be needed.)*
Bitcoin Expecting Relief moveBitcoin Poised for 109K
Bitcoin is showing resilience around the key psychological support level of 100K which appears to be holding firm despite recent volatility. The current price action reflects a complex consolidation pattern, but overall sentiment remains bullish, driven in part by ongoing geopolitical tensions that are boosting Bitcoin’s appeal as a safe-haven asset.
If this support holds, the structure suggests a potential move toward the next resistance level at 109K.
You may find more details in chart Ps Support with like and comments for more analysis.

BTC is Bearish again?BTC 1W Overview
BTC is still trading above 100k despite the macro situation and ww3 situation in the Middle East , which is fine for the BTC maxis and institutions.
Weekly structure starting to shift in a bearish direction considering the weekly close below the structure and daily range is just a chop fest around the 104k area and so does the other assets getting chopped.
BTC.D is now over 1000 days uptrending and this is wild and not at all what many were expecting this point in the cycle.
Big concern on my mind is that what if BTC pulls back to the 90k area as I think may happen which I marked in the chart then altcoins will leg down another 20-30%.
Obviously everything is not about technical and the fundamental side is simply that there is an ongoing conflict in the middle East and the whole crypto market is waiting for a resolution one way or the other and crypto market lacks patience and even we do get the uncertainty then it still doesn't address the deeper market issues of altcoin weakness and continued dominance of BTC (BTC outperformed every single alt except MKR).
My best bet for LONG maxis will be around the 92k area Weekly FVG and Yearly Open, if we get more bad news from the middle East or Russia-ukraine or Sir powell comes with a bad news then this zone will be fast forwarded
And for short maxis or Beras my best bet will be S\R of 104k or monthly open is area to look for
All this planning will go down the drain if TRUMP comes with a good news regarding Tarrifs with china or other countries or any other news from the TRUMP because he's unpredictable
On the short time frame Scalps are possible on both sides and 100k is a psychological level to long but in bearish scenerio or war news will just wreck it
Final bias shifting Bearish
For alts instead of trying to long every dead cat bounce or predict the bottom we have to wait for it to happen and then react accordingly because reaction and execution is better than drawing predictions and getting chopped

Long trade
1min TF entry
🟢 Trade Journal Entry – Buyside Trade
📍 Pair: BTCUSDT
📅 Date: Saturday, June 21, 2025
🕒 Time: 11:45 AM (NY Session AM)
⏱ Time Frame: 1 Minute
📈 Direction: Buyside
📊 Trade Breakdown:
Entry Price 103,468.8
Profit Level 103,639.8 (+0.17%)
Stop Loss 103,420.3 (−0.05%)
Risk-Reward
Ratio 3.53: 1
🧠 Context / Trade Notes:
1-Minute TF Scalping Setup:
Trade executed on ultra-low time frame during late NY AM volatility window — ideal for short bursts of movement and precision entries.
Liquidity Sweep Below Minor Low:
Entry taken after price dipped below a small intra-session low, triggering a liquidity grab before a quick reversal.

Another drop for BitcoinHi traders,
Last week Bitcoin went exactly as predicted.
Price went up a little higher into the Daily FVG and after that it started the next wave down and smaller correction up.
Now we could see a small correction up and after that another drop.
Let's see what the market does and react.
Trade idea: Wait for the correction up to finish to trade shorts.
If you want to learn more about trading FVG's with wave analysis, please make sure to follow me.
This shared post is only my point of view on what could be the next move in this pair based on my analysis.
Don't be emotional, just trade your plan!
Eduwave

Bitcoin Key $103K Supports Tested, Swing-Bullish Opportunity?__________________________________________________________________________________
Technical Overview – Summary Points
__________________________________________________________________________________
Strong bullish momentum on daily, fueled by the Risk On / Risk Off Indicator and MTFTI structure.
Major supports identified at $102,600 – $103,300, high confluence (4H, 12H, 1D).
Resistances clustered between $106,000 and $110,000 (240 & D Pivot High, W Pivot High).
Volumes generally neutral; no buyer/seller climax.
Directional trends diverge: overall swing remains bullish, short-term intraday still corrective.
__________________________________________________________________________________
Strategic Summary
__________________________________________________________________________________
Global Bias: Structured bullish as long as supports >$102,600 are preserved.
Opportunities: Longs on retest of major supports, favoring daily/4H trend-following. Reactive shorts only on rejection at $104,500–$106,000.
Risk zones: Below $102,600 = structure break. Prioritize cash/hedging.
Macro catalysts: Waiting for September FOMC. Monitor geopolitical risks (MENA).
Action plan: Gradual entries on pullbacks, disciplined stops below pivots, prudent sizing outside confirmed breakouts.
__________________________________________________________________________________
Multi-Timeframe Analysis
__________________________________________________________________________________
1D & 12H : Bullish trend confirmed by the Risk On / Risk Off Indicator and MTFTI. Major supports intact ($102,600–$103,300). Volumes neutral, market in wait mode. Swing long favored.
6H & 4H : Upward momentum, no significant bearish signals. “Buy the dip” valid above support; healthy structure as long as key levels hold.
2H, 1H : Early micro-divergence signals (MTFTI Down short term), increased caution. Favor entries on confirmed correction or breakout only.
30min, 15min : Intraday correction, neutral/bearish volumes, aggressive long setups discouraged. Scalping only on exhaustion spikes, strict stops.
ISPD DIV summary : No excess/panic, mature consolidation/range context.
Risk On / Risk Off Indicator summary : Bullish across all TF except very short-term (>15min neutral).
__________________________________________________________________________________
Fundamental & On-chain Synthesis
__________________________________________________________________________________
Fed: status quo, US macro softening, market waiting.
Geopolitical tensions: potential for increased volatility.
On-chain: institutional predominance, low network pressure, no panic selling or retail euphoria.
Off-chain: high derivatives volume, OI > $96B. Squeeze risk if catalyst emerges.
__________________________________________________________________________________
Decision Matrix – Execution Plan
__________________________________________________________________________________
Swing Long: Entry $103,200 – $103,800, stop <$102,400, target $107,000+ (RR>2:1)
Scalping Short: On confirmed rejection $104,500 – $106,000, stop >$106,400, target $103,400 (RR>1.5:1)
Strict risk management below major supports, position proactively on volatility/news.
Cash/out below $102,400 or with major geopolitical headlines.
Stay flexible; alternate range-buy/take profit until breakout volume or FOMC news.
__________________________________________________________________________________


Bitcoin and the geopolitical news BINANCE:BTCUSDT.P
Advanced Technical Analysis of Bitcoin's Structure – Current Situation on Smaller Timeframes
We notice a symmetrical triangle forming on the small timeframes (1-hour and 4-hour), centered in a critical area. Historically, when this price pattern forms, Bitcoin takes no more than three days to confirm its trend. Therefore, the close of the third-day candlestick will serve as a pivotal turning point.
🔹 Immediate Support: 103,400
🔹 Strong Support: 102,500 — a daily low + institutional liquidity zone
🔹 First Resistance: 105,600 — associated with a convergence of moving averages (EMAs)
🔹 Main Resistance: 106,700 — a crossover with the 200-period moving average, which can be described as the largest psychological barrier
---
Possible Scenarios:
☑️ Positive Scenario:
If 105,600 is breached, we are expected to witness an upward movement targeting:
108,000
110,000
118,000 (potentially later)
✅ Catalysts:
Positive US economic data
Regulatory news supporting the markets (such as institutional entry and cryptocurrency regulations)
---
⚠️ Negative Scenario:
If the 102,500 support level is broken, the path will be open to:
100,000
99,000 (strong psychological support area)
❗️ Potential Triggers:
Negative inflation data
Major geopolitical escalation (especially if it directly involves the United States)
🔴 Important Note: I'm not a proponent of trading based on news, but I'm including the US factor because it's the only one I consider truly influential in geopolitical analysis.
The US entering a full-scale war would prompt American investors (who represent about 5% of active traders) to withdraw immediately for fear of long-term repercussions.
🔻 America is making history now, and Trump is managing the situation expertly. He is likely to avoid getting involved in long-term conflicts, focusing on concluding deals and wars strategically.
---
Current Sideways Trading:
Trading continues between the 103,400 and 105,600 levels within the symmetrical triangle.
The future direction will be determined by the following developments:
If the conflict ends and a deal is reached (especially if Iran surrenders), we will witness a strong upward breakout.
If the United States enters the war directly, we expect a downward breakout to levels that may reach 92,000.
---
Technical Conclusion: 💎
Bitcoin is in a critical consolidation phase with a delicate balance between institutional selling pressure at 106,700 and strong buying demand at 102,500.
The next breakout will depend on:
1. A clear breakout of the triangle pattern
2. The strength of the liquidity accompanying the movement
3. Official US developments—regulatory or political
---
Important Clarification:
❌ The recent decline is not directly related to the Iran-Israel war. Rather, it came as a result of:
1. Options expiry
2. Trump's statements about the possibility of direct US intervention, with the arrival of an aircraft carrier in the Middle East
🔍 A war between only two parties doesn't worry the market much, but US intervention is the decisive factor.
✅ America alone is the one that moves the markets.

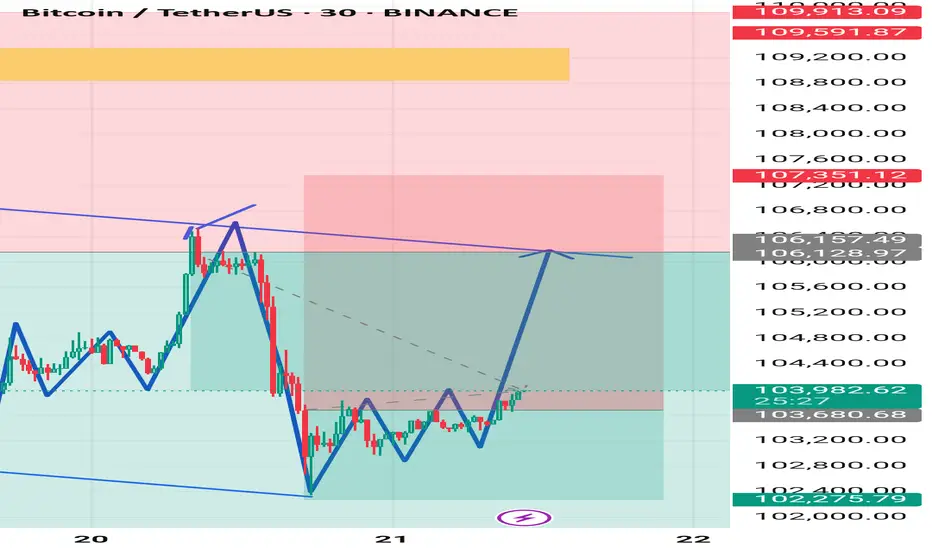
Xauusd market This chart is a 30-minute BTC/USDT (Bitcoin/Tether) technical analysis from Binance, showing a potential bullish setup. Here's a breakdown of the key elements:
1. Descending Broadening Wedge
The blue trendlines forming a broadening wedge indicate a reversal pattern.
Price has been moving within this structure and recently broke out from the bottom back toward the upper resistance line.
This pattern typically ends with a bullish breakout, especially after consolidation near the lower boundary.
2. Key Zones
Support Zone: Around $102,275 – $103,680 (light green zone).
Resistance Zone: Between $106,128 – $107,351 (light red zone), with an extended resistance up to ~$109,591 (dark red line).
3. Pattern Suggestion
The blue zigzag lines suggest a possible Inverse Head and Shoulders pattern near the current price area, indicating a bullish reversal.
A projected price path (in dotted grey) hints at a bullish move targeting the upper trendline near $106,128–$106,157, potentially a 16th–21st June breakout setup.
4. Price Action
Current price: $103,982.63, with moderate momentum (+0.66%).
The arrow projection suggests a bullish move targeting the upper resistance zone.
---
Summary:
Bias: Bullish short-term outlook.
Target Zone: $106,100–$107,300.
Invalidation: Drop below $102,275 may negate the bullish setup.
Let me know if you'd like an entry/exit plan, risk/reward analysis, or a trading strategy based on this setup.
Skeptic | Bitcoin Deep Dive: Rate Hikes, War Tensions & TriggersInterest Rates: The Big Picture
Let’s start with the Federal Reserve’s move—interest rates jumped from 4.25% to 4.5% . What’s the deal? Higher rates mean costlier borrowing , so businesses and folks pull back on loans. This drains liquidity from risk assets like Bitcoin and SPX 500, slowing their uptrend momentum or pushing them into ranges or dips. Now, mix in the Israel-Iran conflict escalating ? Straight talk: risks are sky-high , so don’t bank on wild rallies anytime soon. My take? BTC’s likely to range between 97,000 and 111,000 for a few months until geopolitical risks cool (like Russia-Ukraine became “normal” for markets) and the Fed starts cutting rates. Those two could ignite new highs and a robust uptrend. Let’s hit the charts for the technicals! 📊
Technical Analysis
Daily Timeframe: Setting the Stage
You might ask, “If 100,000 support breaks, does that mean we’ve formed a lower high and lower low, flipping the trend bearish per Dow Theory?” Absolutely not! Here’s why: our primary uptrend lives on the weekly timeframe, not daily. The daily is just a secondary trend. If 100K cracks, it only turns the secondary trend bearish, leading to a deeper correction, but the major weekly uptrend stays intact.
Spot Strategy: No spot buys for now. Economic and geopolitical risks are too intense. I’ll jump in once things stabilize. 😎
Key Insight: A 100K break isn’t a death sentence for the bull run—it’s just a shakeout. Stay calm!
4-Hour Timeframe: Long & Short Triggers
Zooming into the 4-hour chart, here’s where we hunt for long and short triggers:
Long Trigger: Break above 110,513.92. We need a strong reaction at this level—price could hit it early or late, so stay patient for confirmation.
Short Trigger: Break below 101,421.65. Same vibe—watch for a clean reaction to tweak the trigger for optimal entry.
Pro Tip: These levels are based on past key zones, but time outweighs price. Wait for a reaction to nail the best entry. Patience is your edge! 🙌
Bitcoin Dominance (BTC.D): Altcoin Watch
As BTC dips, BTC.D (Bitcoin’s market share) is climbing, meaning altcoins are taking a bigger beating. Don’t touch altcoin buys until the BTC.D upward trendline breaks. They haven’t moved yet—you might miss the first 10-100%, but with confirmation, we’ll catch the 1,000-5,000% waves together. 😏
Shorting? If you’re shorting, altcoins are juicier than BTC—sharper, cleaner drops with more confidence. Patience, patience, patience—it’s the name of the game.
Final Thoughts
My quieter updates lately? Blame the geopolitical chaos, not me slacking . I’m hustling to keep you in the loop with clear, actionable insights. here, we live by No FOMO, no hype, just reason. Protect your capital—max 1% risk per trade, no exceptions. Want a risk management guide to level up? Drop a comment! If this analysis lit a spark, hit that boost—it keeps me going! 😊 Got a pair or setup you want next? Let me know in the comments. Stay sharp, fam! ✌️

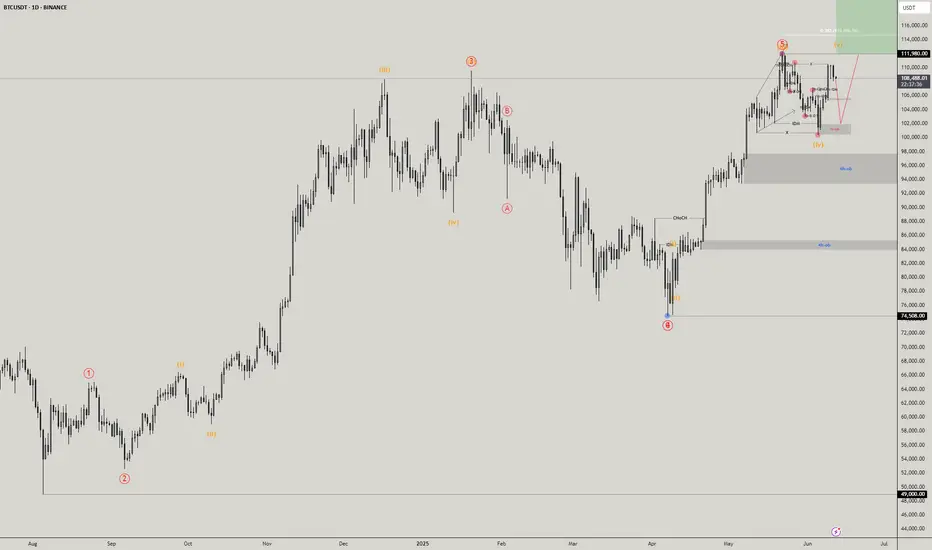
Trade Plan Update #12: Navigating BTC’s Critical Levels
*Conflicting timeframes (bullish 1H/Daily vs. bearish 4H/Weekly) are causing choppy price action. Here’s my 2-step game plan: *
📈 Scenario 1: Bullish 1H Play
Key Support Zone: $100,314 - $102,000 (last line of defense for 1H bullish structure).
Trigger: A strong rejection + bullish reversal signal in this zone.
Action: INSTANT LONG ENTRY. No waiting—aggressively capitalize on momentum.
📉 Scenario 2: Daily Structure Fallback
If $100,314 fails:
1- First Demand Zone: $93,300 - $98,000
Watch for a strong bounce → Go long if momentum confirms.
Weak reaction? Hold and monitor lower.
Second Demand Zone: $84,000 - $88,000
Ideal reversal zone for resuming the bull run.
LONG on confirmed strength.
Bull Run Lifeline: $74,600
Non-negotiable: A daily close below this invalidates the bull trend.
✅ Key Reminders:
Patience is strategy: Only act when price confirms your thesis (no guessing!).
Risk first: Define stops for every entry.
Watch price action—NOT hopes.
👇 What’s your take?
Which scenario seems more likely?
Are you adding any key levels?
Let’s discuss below! 👀

Bitcoin– bearish momentum builds after rejection at $109KIntroduction
Bitcoin (BTC) is currently showing weakness after forming a lower high at $109,000. This level acted as a significant point of rejection, and since then, BTC has been moving lower. The price has broken through key support areas, indicating a possible shift in market structure. In this analysis, we’ll break down the recent price action, explain the technical signals behind the move, and discuss what could be expected in the short term.
Rejection from the 0.786 Fibonacci Level
The rejection at the $109,000 level aligns perfectly with the 0.786 Fibonacci retracement on the 4-hour timeframe. This level is often seen as a strong resistance point during corrective moves, and in this case, it held firmly. The precision of this rejection gives it more weight, and since hitting that point, BTC has been steadily declining. This move down suggests that buyers were unable to push through the resistance, leading to increased selling pressure.
Break of the 4H Bullish FVG
As BTC started its decline from $109,000, it broke through the bullish Fair Value Gap (FVG) that had formed earlier on the 4-hour chart. This gap previously served as a support zone but has now been decisively broken with strong volume. The loss of this level is significant, as it marks a breakdown of the bullish structure and opens the door for further downside movement. In the process of this move lower, BTC has created a new bearish FVG on the 4-hour timeframe. This gap remains open and could potentially act as a magnet for price to revisit, offering a possible short entry if price retraces into that zone. However, the clear break below the previous bullish FVG indicates a shift in momentum and supports a more bearish bias for now.
Downside Target at $102.7K
Given the recent breakdown, the next key level to watch is around $102,700. This area marks the wick low on the 4-hour timeframe and stands out due to the size and sharpness of the wick. Such large wicks often leave behind unfilled orders, which markets tend to revisit over time. The presence of these resting orders makes this level a likely target for the ongoing move down. It also acts as a strong area of potential support, where buyers might step back in if the price reaches that point.
Conclusion
With the rejection from the 0.786 Fibonacci level and the failure to hold the bullish 4H FVG, BTC has shown clear signs of weakness. The breakdown in structure suggests a continuation to the downside is likely, with $102.7k being the most immediate target. This level could serve as a strong support zone due to the unfilled orders left behind by the previous wick. Until BTC reclaims key support levels or shows a shift in momentum, the bias remains bearish in the short term, and traders should remain cautious while expecting further downside.
Thanks for your support.
- Make sure to follow me so you don't miss out on the next analysis!
- Drop a like and leave a comment!

The Importance of the 104463.99 Point
Hello, traders.
Please "Follow" to get the latest information quickly.
Have a nice day today.
-------------------------------------
(BTCUSDT 1D chart)
This volatility period is around June 22nd (June 21-23rd).
Therefore, waves can be generated at any time during the volatility period.
The 104463.99 point is the DOM (60) indicator point of the 1W chart, which corresponds to the end of the high point of the 1W chart.
Therefore, it seems that the price defense is being done well.
I think that defending the price at the high point is significant because it raises expectations for further increase.
-
If it falls after a period of volatility, there is a possibility that it will meet the M-Signal indicator of the 1W chart, and I think the important point at that time is the 99705.62 point.
Therefore, when it falls, you need to check whether the M-Signal indicator of the 1W chart rises to around 99705.62 and whether it is supported.
-
Even if it rises after receiving support near 104463.99, the key is whether it can maintain the price by rising above 108316.90.
The 108316.90 point is the HA-High indicator point of the 1D chart, which corresponds to the middle value of the high point range.
Therefore, in order to continue the uptrend, it must be supported and rise in the 108316.90-111696.21 range.
Currently, both the Low Line and High Line of the auxiliary indicator OBV are showing a downward trend.
Therefore, in order for the uptrend to begin, OBV must rise above the High Line and be maintained.
If not, it is highly likely that it will fall due to selling pressure.
One hopeful(?) thing is that the PVT oscillator is showing an overall upward trend.
(Changed from OBV oscillator to PVT oscillator.)
Therefore, we can see how important the area around 104463.99 is playing a role of support and resistance.
-
In my chart, the basic trading strategy is to buy near the HA-Low indicator and sell near the HA-High indicator.
Therefore, it is virtually impossible to create a trading strategy at the current price level.
In such cases, you should conduct trading through day trading or quick response.
If not, you may experience a lot of psychological fear and anxiety.
The basic time frame chart of all indicators is the 1D chart.
Therefore, if you cannot read the flow of the 1D chart, you are likely to end up getting faked and suffer losses.
Therefore, you should read the flow of the 1D chart and create a big picture of how to create a trading strategy, and respond in detail on the time frame chart below the 1D chart.
-
Thank you for reading to the end.
I hope you have a successful trade.
--------------------------------------------------
- This is an explanation of the big picture.
(3-year bull market, 1-year bear market pattern)
I will explain more details when the bear market starts.
------------------------------------------------------
