bitcoin bullish and bearish BINANCE:BTCUSDT.P
bullish
🔹 Technical analysis according to Elliott waves (time: 1 hour)
📌 The pattern shown on the chart shows a complex structure that includes a complex correction within the larger wave (B), and the following is clear:
🔸 Main waves:
Wave (1) up from the bottom has been confirmed.
It was followed by a corrective wave (2) that ended near the 0.786 Fibonacci level = 102,575.
Then the upward wave (3) started, and it seems that it has been completed or is about to be completed.
🔸 Current status:
The price is currently moving within a small corrective wave, likely wave (4).
Current major support is located at: 🔸 102,275.7 (very important level) 🔸 100,317.6 (in case the correction extends)
🔸 Critical resistance areas:
For the bullish scenario to be valid, the resistance must be broken:
106,759 (0.618 Fibonacci ratio)
108,948 (0.786 – peak of wave C)
---
🔹 Important technical points:
🔸 The last correction (A)-(B)-(C) shows a clear triple structure, indicating that wave (2) has been completed.
🔸 The price is currently bouncing off the 0.5 - 0.618 Fibonacci levels (104,402 - 104,923), which reinforces the possibility that wave (2) has actually ended, and that we are currently starting an upward wave (3).
---
✅ Conclusion:
✅ As long as the price is above 102,275, the upward scenario through wave (3) remains valid.
⚠️ Breaking 100,317 indicates the failure of the bullish scenario and a structural shift in the waves.
🔻 Alternative (Bearish) Scenario – Short-Term:
If the price fails to maintain the current support at 102,275, we may not be in wave (4) but rather at the beginning of a new downward wave within a broader corrective scenario, as follows:
---
🔸 Wave Interpretation:
🔹 Wave (B), which completed at the peak near 108,948, likely marked the end of an upward correction.
🔹 The current downward wave from that peak could be:
Either wave 1 of C within a larger correction,
or the beginning of wave (C) within a bearish (A)-(B)-(C) pattern.
---
🔻 Potential Downside Targets in This Scenario:
1. Breaking 102,275 = Confirmation of the beginning of a new downward wave.
2. First Target:
🔸 101,484 (1.618 Fibonacci Extension – Wave 1 Expected)
3. Second and Stronger Target:
🔸 100,317 = Previous Major Support, Representing an Important Structural Test Area.
4. Third and Most Extreme Target in This Scenario:
🔸 98,800 – 99,260 = Possible Wave C Extension (Corresponds to a Larger Downside Scenario).
---
⚠️ Failure Signal:
Remaining below 105,926 (Previous Sub-Wave Resistance) maintains selling pressure.
Any weak bounce and lack of a clear wave 5 upwards = an additional sign of bearish dominance.
---
🔻 Conclusion:
✳️ The bearish scenario assumes that the peak at 108,948 was the end of corrective wave (B), and that we are now in a downward wave C targeting areas between 101,400 and 99,200, and possibly lower.
✳️ A break of 102,275 would be key to activating this scenario.
BTCUSDT.5L trade ideas

Bitcoin Short-Term 1H Timeframe, Next Target ConfirmedWe have two drops on this chart. The one of the left is more extended and long lasting compared to the one on the right. When a move is sudden with major force, it tends to end suddenly as well.
The recent drop was very steep and the force needed to keep pushing prices lower cannot be maintained, it requires too much energy; for this reason, a higher low is in place and the bulls win the game.
The action is happening above the blue line and space on the chart, this is the 0.618 Fib. retracement support. This is the most important level and so far it holds. Prices went below just to recover. Can be called a failed signal or a bear-trap, whichever you choose, the action is bullish above this level and bearish below.
Bitcoin's main support stands around $102,663, this level was not challenged. Since bears failed to push prices lower, the next logical move is a challenge of higher resistance. And the same pattern repeats, up and down, up and down... This is the short-term noise. When all is set and done, Bitcoin will resolve going up.
Patience is key.
Thank you for reading.
Thanks a lot for your continued support.
Namaste.

continue to move accumulation: below 109,000💎 Update Plan BTC (June 20)
Notable news about BTC:
Semler Scientific (SMLR) unveiled an ambitious three-year strategy on Thursday aimed at significantly expanding its Bitcoin holdings to 105,000 BTC by the end of 2027. The announcement coincided with the appointment of a new executive to lead the firm’s digital asset initiative.
The Nasdaq-listed healthcare firm has named Joe Burnett as its Director of Bitcoin Strategy, a move it believes will strengthen its long-term treasury vision and enhance shareholder value. As part of this strategic shift, Semler Scientific plans to accumulate Bitcoin through a mix of equity and debt financing, alongside reinvested cash flows from its core business operations.
Technical analysis angle
BTC as well as XauUSD are trapped in the channel price 104k to 110k these are also two important milestones of BTC. Also congratulations to investors when detecting the bottom of 104k. The next expectation within the price channel is still maintained at 110k landmark
But with the recent moves of investors, the community is afraid that BTC will continue to adjust in the future.
==> Comments for trend reference. Wishing investors successfully trading

Squeeze Building in BTC – Targeting 100,500 ShortPrice is coiling between interest zones above and a heap of liquidity below. Expecting an impulsive break—looking to short down to ~100,500.

BTC/USDT Technical Analysis🔍 BTC/USDT Technical Analysis
📆 Chart Context:
Published on: June 18, 2025
Instrument: Bitcoin (BTC) vs Tether (USDT)
Timeframe: Appears to be 4H or 1H based on candle width and structure
🧠 Market Structure
🔸 Lower Highs Forming
Clear rejection from around 110,000–112,000 USDT
A sequence of lower highs suggests bearish momentum
Market is failing to break previous highs, signaling potential reversal
🔸 Strong Support Zone
Marked between $99,000 – $100,000
This level has previously caused price reversals (see June 6 and 13 wicks)
Currently being tested again — buyers have defended this area twice
🔁 Price Action & Candlestick Behavior
Recent candles show indecision and weakness after a mild bounce
Wick rejections near $106,000–$107,000 point to supply zone
Projected path (gray curve) implies a small pullback, then a breakdown into the support zone
📉 Prediction: Price Outlook
✴️ Short-Term (1–3 Days):
A likely pullback to $106,000, then a drop toward $100,000–$99,000
If support fails to hold, next target is $96,000–$94,500
✴️ Bearish Breakdown Confirmation:
Candle close below $99,000 with high volume = clear sell signal
In this case, bears may aim for $92,000–$90,000 next
✴️ Bullish Scenario (Less Likely):
If price holds above $104,000 and breaks $108,000, next resistance: $110,500–$112,000
📊 Key Technical Zones
Zone Type Price Level (USDT) Note
Resistance $110,000–$112,000 Previous top, major supply zone
Short-Term Resistance $106,000–$107,000 Weak bounce, possible entry area for shorts
Current Price ~$104,376 Weak consolidation
Support Zone $99,000–$100,000 Key demand area
Breakdown Target $96,000–$94,000 If support fails
✅ Professional Outlook Summary
Market Bias: 📉 Bearish
Action Zone: 🔍 Watching $106K as potential short entry
Support Critical: $99K must hold, or deeper drop
Risk Level: ⚠️ High volatility likely

#Bitcoin ( $BTC/USDT ) is forming a symmetrical triangle on the #Bitcoin ( $BTC/USDT ) is forming a symmetrical triangle on the 1H chart, with strong support near 103,800 and resistance around 105,100. Price is consolidating tightly, indicating a breakout is near. A bullish breakout above 105,500 could target 110,000, while a breakdown below 103,500 may lead to a drop toward 102,000. Key invalidation lies at 103,500. Wait for volume confirmation before entering —
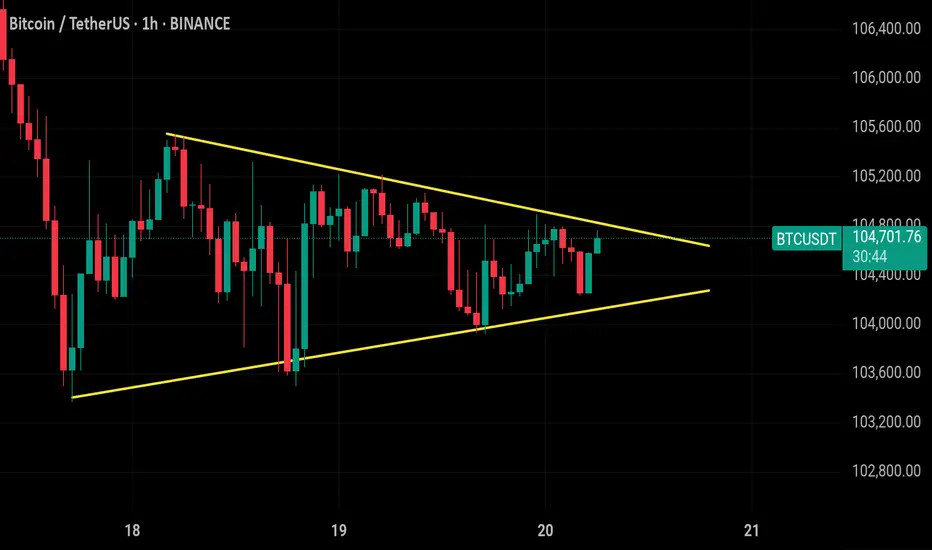
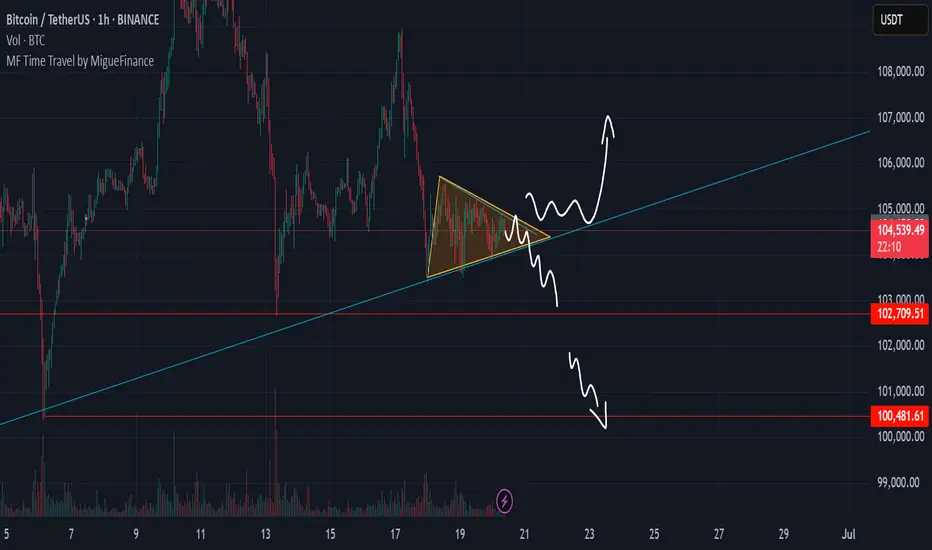
Bitcoin Triangle Pattern, Bullish or Bearish ?We can see LTF bitcoin create mini triangle pattern after downtrend, basically its called bearish triangle continuation. but lets see what is the side will be break
100k vs 107k
BTC Approaching Key Confluence Zone: Pivot + PRZ + LiquidationsBitcoin ( BINANCE:BTCUSDT ) appears to have broken the Support lines and is currently declining .
In terms of Elliott Wave theory , Bitcoin appears to be completing a corrective wave C . The corrective wave structure is a Zigzag Correction(ABC/5-3-5) .
I expect Bitcoin to start rising again from the Support zone($104,380-$103,660) , Potential Reversal Zone(PRZ) , Cumulative Long Liquidation Leverage($104,471-$103,124) , Monthly Pivot Point , Support line , and 50_SMA(Daily) , and the small CME Gap($106,190-$106,150) will also fill.
Note: Stop Loss: $102,520
Please respect each other's ideas and express them politely if you agree or disagree.
Bitcoin Analyze (BTCUSDT), 1-hour time frame.
Be sure to follow the updated ideas.
Do not forget to put a Stop loss for your positions (For every position you want to open).
Please follow your strategy and updates; this is just my Idea, and I will gladly see your ideas in this post.
Please do not forget the ✅' like '✅ button 🙏😊 & Share it with your friends; thanks, and Trade safe.

BTC – 15min Reversal Structure & Fibonacci ReclaimWe’re currently witnessing a potential short-term reversal on BTC’s lower timeframe after a volume-supported breakdown and sweep of local lows.
🔍 Key Observations:
Price swept liquidity at local lows (~103,929.27)
Entered into a clear reaccumulation box with responsive buyers
Volume profile shows prior POC just above – room for fill
Fibonacci retracement aligns with key structure:
0.5 = 104,372.94
0.618 = 104,268.23
1.0 = 104,816.60 (final high target for this impulse)
📈 Potential Play:
Entry Zone: Just above the sweep candle (104,100–104,200)
Target 1: 0.382 at 104,477
Target 2: 104,816.60
Invalidation: Close below 103,926
🧠 Mindset:
This is a classic liquidity sweep → reaction → reclaim pattern. If BTC flips the 0.5 level with strong momentum, a short squeeze toward the 104.8K area becomes likely.
Great opportunity for scalpers or day traders.
Let me know if you want this turned into a long-form breakdown or sent in another format.

BTC: Short 19/06/25Trade Direction:
BTC Short
Risk Management:
- Risk approx 0.25%
Reason for Entry:
- M30 + M15 Bear Div
- Rejected off Monday low
- Failure to break weekly open
- H1 overbought
- Market is choppy, HTF Bearish
Additional Notes:
- Compounding shorts to maximize edge if trade confirms, currently have a risk free SOL short running. Moving my risk to this.

Bitcoin is in a downward trend.Hello dear friends.
Considering the trend of Bitcoin, it is expected that this Bitcoin will fall to around $100,000.
❌Please note that this is just a prediction, so be careful with your capital.

BTCUSDT: Positive CDV Divergence for Potential Long Setups• Market Overview: Bitcoin currently sits at a pivotal point. Although the price movement has been somewhat indecisive, we’re watching closely for signs of bullish momentum.
• CDV Divergence Focus: Our attention is on a potential positive Cumulative Volume Delta (CDV) divergence. This takes shape when the price makes a lower low but CDV registers a higher low (regular bullish divergence), or when the price posts a higher low and CDV shows a lower low (hidden bullish divergence). These patterns can hint at growing buying interest even if price action hasn’t caught up yet.
• Support Zones (Blue Boxes): The highlighted blue zones on the chart signal potential support levels where buyers may step in. These are mapped from prior demand areas or structural support points.
• Trade Setup: Should a confirmed positive CDV divergence appear near or inside one of these blue zones, it could offer a strong case for a long entry. This would suggest that while the price may look weak, buying strength is quietly building underneath.
• Managing Risk: Any long entry must be accompanied by a well-defined invalidation level—typically just below the blue box support or the lowest point of the divergence.
Disclaimer: This is a technical pattern-based analysis intended for informational purposes only. Trading involves risk. Always perform your own due diligence and assess your risk appetite before entering any trades.

BITCOIN TOUCHED 110K — THEN REJECTEDNot what bulls wanted to see.
With massive gaps below, this kind of price action ain’t it.

Bitcoin ETFs rebound with $408 million in inflows!Bitcoin ETFs rebounded strongly, with net inflows of $408 million, in stark contrast to the net outflows the day before. Meanwhile, Ethereum ETFs saw a slight net outflow of $1.82 million, mainly affected by the large withdrawal of BlackRock ETHA.
Bitcoin funds rebound after a brief downturn, and eight spot ETF products record inflows
Bitcoin exchange-traded funds (ETFs) rebounded quickly. After Tuesday's pullback, U.S. spot Bitcoin funds returned strongly on Wednesday, July 2, with net inflows of $408 million, showing an overall increase in investor confidence.
Funds came from all corners of the ETF space. Fidelity's FBTC led the way, attracting $183.96 million. Ark 21Shares' ARKB followed closely behind with inflows of $83 million, while Bitwise's BITB added a respectable $64.94 million.
Grayscale's GBTC contributed $34.56 million, while its Bitcoin Mini Trust added another $16.53 million. Invesco’s BTCO ($9.85 million), Franklin’s EZBC ($9.51 million), and Vaneck’s HODL ($5.42 million) rounded out the week. Total trading volume soared to $5.22 billion, and net assets climbed to $136.68 billion.
Bitcoin ETFs have clearly shrugged off yesterday’s alarm. Ethereum ETFs, while still showing resilience, may need a more stable helm to maintain their upward trajectory.

break, BTC soon reaches new ATH💎 Update Plan BTC after NFP (July 3)
Notable news about BTC:
Bitcoin (BTC) recovered to $ 109,000 on Wednesday when the US agreement with Vietnam and the increase in global M2 supply of M2 money has promoted an increase in open interest rates (OI), soaring to 689.78 thousand BTC worth about $ 75 billion. The cryptocurrency market in general has increased the price along with BTC, with leading altcoins, Ethereum (ETH), XRP and Solana (SOL) increased by 7%, 3%and 4%respectively.
Bitcoin, the market cryptocurrency market increased by the trade agreement with Vietnam and M2 money supply soared
The cryptocurrency market has recovered on Wednesday, an increase of 2% to regain the market capitalization of $ 3.5 trillion.
Technical analysis angle
First, congratulate the investors who follow the plan when we previously traded according to the model and had a short signal at 108k and took profit and then Long in the 106k area.
Currently, BTC is in wave 5 and is trapped in the Fibonanci area of 2,618 golden ratio around the price of 109k, this is also the threshold of the price of investors who are under pressure before the price area goes to 112k
The 112k region is a psychological area of profit and will appear on the 109k sales situation before the BTC price may rise further in the last 6 months of the year.
Please follow the channel to receive accurate scenarios about gold and BTC /-Teart /-heart
==> Comments for trend reference. Wishing investors successfully trading

Bitcoin NEW ALL TIME HIGH ? Based on my analytic, bitcoin has possibility to hit the new all time high $113.500 .
If not there is also possibility of going down to 4h OB ( $106.10 0) and up to $113.500 .
Two scenarios possible!!!
First trade
Entry 108.937,7
SL 108.419,4
TP 113.599
Second trade
Entry 106.185,4
SL 104.972,7
TP 113.599

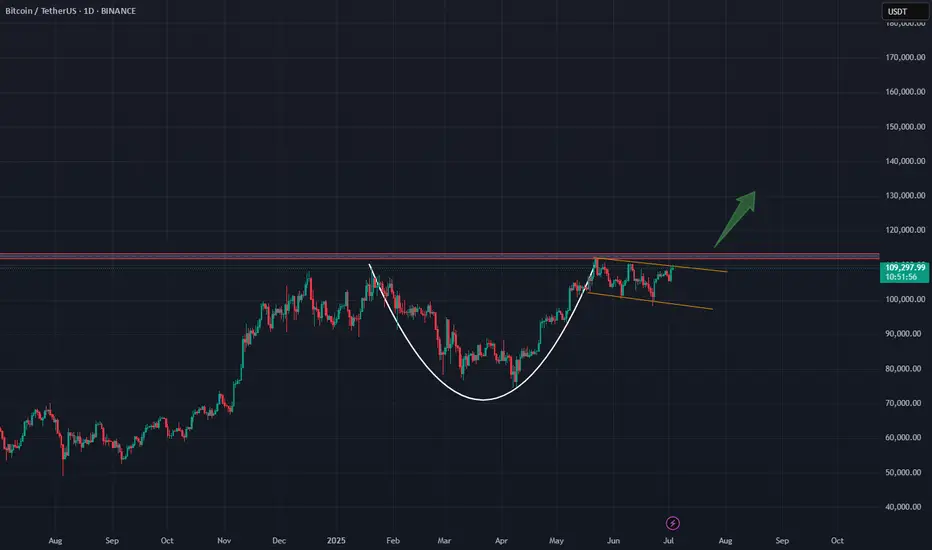
btc usdtbtc usdt
cup patern
I think my eyes are seeing correctly! After the breakout from above and confirmation on the red line, it will move upward.”
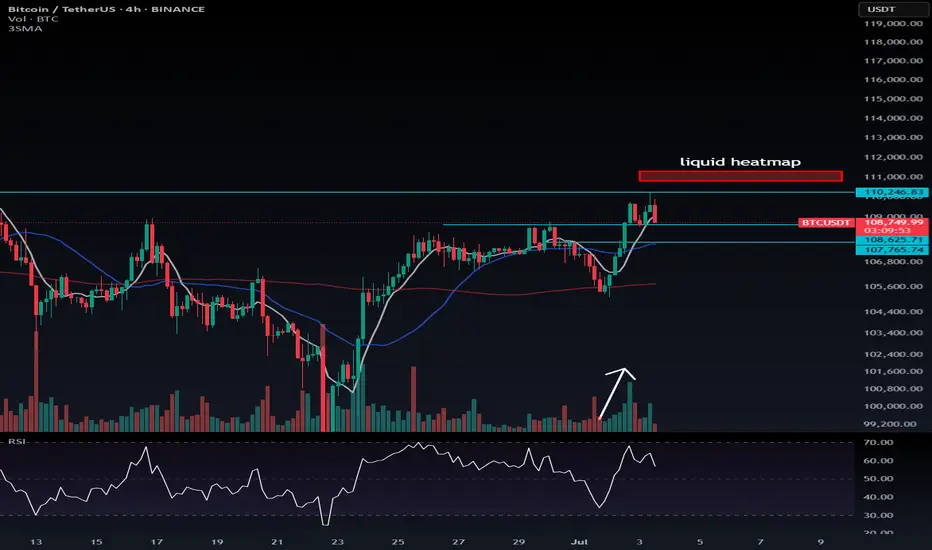
Bullish Momentum Building – Watch for a Sharp Move📈 Bullish Momentum Building – Watch for a Sharp Move
Since the upward move started from $105,363, we've seen a rise in volume alongside the price — a positive sign. If RSI on the 4H timeframe pushes into the overbought zone (above 70), it could trigger a sharp breakout.
Most short positions are likely to get liquidated between $110,880 and $111,320, which may overlap with an RSI breakout and add fuel to the move.
So here's how I'm planning this:
Use a stop-buy order to catch a breakout and enter a long position.
Place your stop-loss around $108,500.
For the entry point, check your exchange’s order book — I’m still not fully convinced $110,246 is the best trigger.
If price drops to around $107,765, it's not a big concern — the structure remains bullish. Ideally, though, we don’t want to go below $108,620.
Don't forget to manage your risk — fakeouts are still possible. And if you get stopped out once, don’t get discouraged. Stay focused — we might be close to a strong move over the next few days.
💬 What’s your plan? Drop your thoughts in the comments — I read all of them! www.coinglass.com
BTC BIG SHORT!We did a mirror retest, and many other signals also point to a sharp decline, indicating numerological codes 69/96.

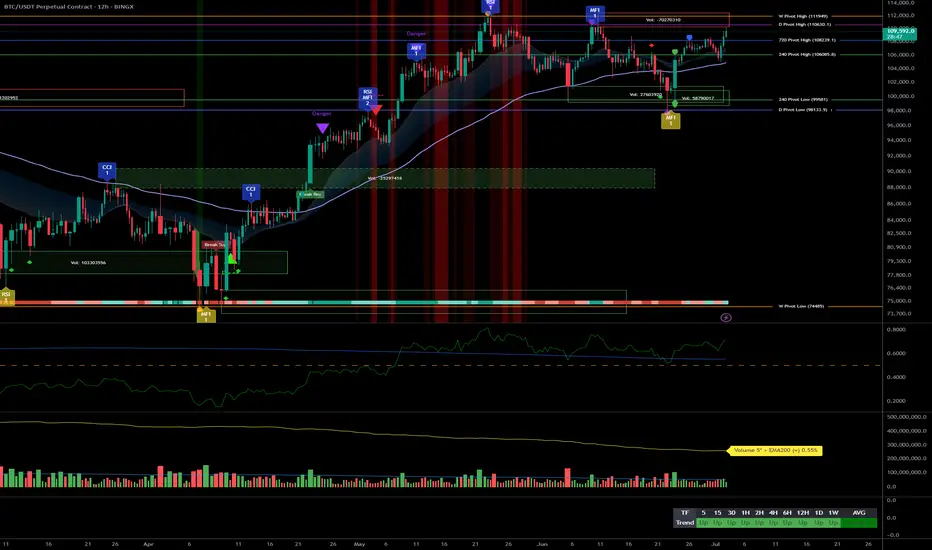
Bitcoin Robust Bullish Structure, Key Entries at 105k & 100k__________________________________________________________________________________
Technical Overview – Summary Points
__________________________________________________________________________________
Bullish momentum confirmed across all timeframes : Structure remains healthy, no behavioral anomalies detected.
Key supports: Main HTF pivot around $98,000–$100,000; first intermediate support zone at $105,000.
Major resistances: Critical area between $109,000 and $112,000, dense pivot and volume profile confluence.
Volumes: Normal to very high depending on TF, no speculative excess; gradual rise hints at possible expansion phase.
Risk On / Risk Off Indicator : Strong Buy from daily to 1H, shifting to neutral on shorter timeframes (30min–15min).
ISPD DIV/Mason's line: Predominantly neutral histogram, no overheat or capitulation detected.
Multi-timeframe behavior: Robust underlying structure, increased volatility but no massive selling stress.
__________________________________________________________________________________
Strategic Summary
__________________________________________________________________________________
Global bias: Bullish dominance as long as $98k–$100k holds.
Opportunity zones: Buy on pullback to $105k, swing confirm above $111k with volume/ISPD validation.
Risk / Invalidation: Stop loss below $98k; extra caution on macro/Fed events.
Macro catalysts: Fed/NFP-US (July 2–4), monitor behavior via ISPD DIV (blue to red).
Action plan: Structured and tactical long bias, “no trade” zone before major US releases, immediate stop on support break.
__________________________________________________________________________________
Multi-Timeframe Analysis
__________________________________________________________________________________
1D: Bullish momentum, no overheat. Pivot 98–100k = strategic fallback.
12H–6H: Signs remain bullish, no anomalies, intermediate supports at 105–107k.
4H–2H: Positive consolidation, rising volumes; possible accumulation on 105k dips.
1H–30min: Multiple resistances under 110–112k, very high volumes, maintain vigilance for sudden spikes.
15min: Extreme volatility, but no clear seller excess; watch for “trap” formation.
Risk On / Risk Off Indicator : Strong Buy on main timeframes, shifting to neutral/buy on 30min/15min (breather zone).
ISPD DIV/Mason's line: No buyer capitulation, overall neutral histogram.
Summary: Bullish cross-timeframe alignment, only macro events may trigger a break.
Key economic calendar
- 07/02: Powell speech – Potential added risk-on boost.
- 07/02: US tariff updates – Possible volatility.
- 07/04: NFP, ISM... High expected volatility.
Action : Heightened caution pre-announcements, validate through volume/ISPD.
On-chain: Dominant HODLing, no dumping, stable institutional volume.
Macro: Fed, inflation, geopolitics under watch.
Tactical: Spot any warning via ISPD or volume cluster.
__________________________________________________________________________________
Conclusion & risk management
__________________________________________________________________________________
Strong bullish bias as long as $98k–$100k holds .
Optimal buy on $105k/$100k dips, swing confirm on $111k break .
Outside of US events: strict tactical discipline required .
Absolute invalidation zone: break below $98k (HTF + STH cost-basis) .
Remain vigilant for ISPD red + volume spike / macro headlines .
__________________________________________________________________________________
You trade. You learn. You test. But results still slip. Why? Sometimes you feel like you know it all. You've tried dozens of strategies. Studied with the best. But in your head — there’s no clarity, in your trades — chaos, and in the end — you’re stuck in the same place. I’ve been there too. If this sounds familiar — keep reading.
Every day, thousands of traders enter the market and do everything "by the book": they open their terminal, draw levels, learn from the pros, read the analysis. Yet years later, they’re still in the same spot. Their results are random, unstable, or negative. Why?
🔹 Not because you didn’t study enough.
🔹 Not because you can’t read a chart.
💡 Most likely, your system isn’t fully built — or your goal is still unclear.
A goal is not a wish. "I want to make money" is not a goal. A real goal sounds like: to consistently earn $1,000 a month, spending 3 hours a day on trading. Or: to live off trading income and leave my job.
Different goals require different systems: daily routines, trade evaluation criteria, analysis frequency, and risk approaches.
Here are some examples of goals and the systems they require:
Goal: Consistent side income $1,000 a month with 3 hours of trading a day → You need a system with a clear schedule, ready-made analysis templates, minimal manual effort, asset/time priorities, clear trade filters, trade logging, and weekly/monthly feedback loops (what works, what doesn’t).
Goal: Passive income through investments (e.g. 15% annual return on capital) → You need a system that includes regular fundamental analysis, long-term trend evaluation, clear rules for portfolio formation and rebalancing, risk limits per asset, profit/loss realization strategies, trade logging, and quarterly feedback reviews.
Goal: Full-time trading income, consistently earning $10,000 per month → You need a system with strict risk control, a daily trading rhythm, emotional stability support, trade tracking, and daily/weekly feedback (what’s working, what’s not).
What happens without a goal and system?
The trader opens a chart and starts "looking for an opportunity." Today it’s scalping, tomorrow swing, the next day — "I’m just observing."
📉 They don’t know what to focus on.
📉 They lose concentration.
📉 They jump into trades because "something must be done."
📉 They burn out. Because there’s no sense of progress.
Without a goal, you can’t build the system you need. A goal sets the direction and evaluation criteria.
Without a system, you can’t reach the goal: you might have knowledge, actions, and effort — but they don’t add up to results. Just noise, fatigue, and the feeling of being out of sync with the market.
A system is what connects your goal and actions. It gives you stability, filters out distractions, keeps you focused, and reduces impulsive behavior.
If this feels familiar — it’s a signal. Your system and goal need an upgrade. Many start with a random mix of actions hoping for results. Few take the step toward clarifying their goal and building their system. You can be one of them — if you have a map and a direction.
Everything starts with a clear personal goal — not a generic one, but truly yours.
You can use 3 practices to help you:
Goal — what you truly want from trading, specifically in numbers and timelines.
Sub-goals — how to break the path into clear steps based on your resources.
Hypothesis — what exactly you’re testing right now to stay focused.
Each of these is a practical step that brings clarity and direction.
📌 Define your goal — and keep it.
It’s your starting point. It marks the transition from reactive trader to conscious professional.
See you in Part Two — where we’ll build the system that brings you to that goal.
Let your chosen goal inspire and support you on the journey.
Value every step and your own effort.
Take care — and trust your path.
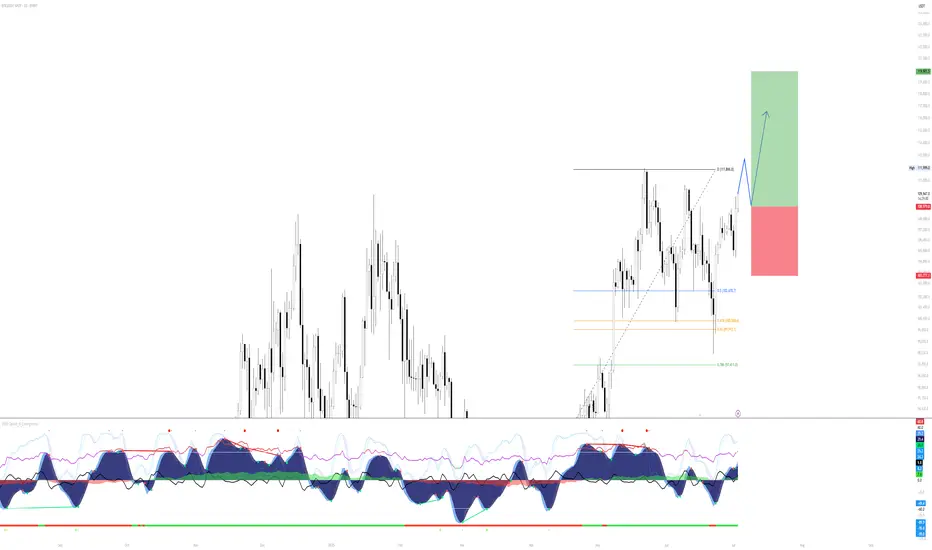
BTC/USDT Long Setup – Daily Bullish Continuation PlayMarket Context:
Bitcoin has reclaimed significant ground after a corrective phase and is now approaching prior highs. The current move suggests strength and potential continuation — but with overhead resistance near 111,866, a retracement or consolidation before continuation is likely.
Setup Idea:
The chart illustrates a bullish continuation scenario: price may push slightly higher into resistance, then retrace into a more favorable entry zone before targeting new highs. The Fibonacci retracement levels between 100,500 and 102,470 align with a high-probability demand zone for a dip buy.
Trade Plan:
Entry Zone: Await retracement into the 0.5–0.618 fib zone (102,400–100,500)
Stop Loss: Below 99,900 (beneath 0.65 fib and invalidation structure)
Target: 119,900 (clean extension above prior high)
Risk/Reward: Favorable multi-R setup based on macro continuation
Notes:
The setup anticipates a pullback before the next impulse. If BTC breaks through 111,900 with momentum and no retrace, the trade idea would shift to chasing on strength or waiting for consolidation above.
Momentum indicators on VMC show bullish pressure building, but overbought conditions suggest temporary cooling may occur.
Let the retrace come to you — and position accordingly on confirmation.
Bitcoin Just Broke Out! Is $117K Next? (MA50 + Fibo 161% Confirm🚨 MAJOR BTC MOVE!
After weeks of consolidation, Bitcoin has officially broken the downtrend and showed a strong bounce from the MA50, turning previous resistance into support.
📈 Setup Breakdown:
✅ Downtrend breakout confirmed
✅ Clean reaction from MA50
✅ Long entry triggered with upside targets
🎯 Target 1: $112,644 (161% Fibo)
🎯 Target 2: $117,351
📊 This could be the beginning of a new leg up. Watch price behavior at key levels and manage risk accordingly.
💬 What’s your take? Are we heading to $120K or is this a bull trap? Drop your thoughts below 👇
🔁 Like & Share if you caught this move!
📺 Follow for more real-time setups @ TradeWithMky 🧠📉
—
“TradeWithMky – where altcoins speak louder than Bitcoin!”
