30-Minute Chart – Rising Wedge BreakdownBreakdown from 30m rising wedge confirmed with volume. Retest at 107.5K failed. Price now under EMAs.
4H also broke rising channel → rejection from 108.4K.
Key support: 106.4K.
Break below = 105.2K target.
Reclaim 107.5K = upside risk to 108.8K+.
Bias: Bearish below 107.5K.
Volume confirms move.
BTCUSDT.5L trade ideas

BTC Breakout Imminent – Targeting $110,349🕒 Timeframe: 30-Minute Chart
📈 Current Price: $108,425
🎯 Projected Target: $110,349
---
🔍 Chart Zones & Key Levels:
🔷 Blue Resistance Zone (~108,500 - 110,500)
Price is currently approaching the top of this range.
Historically, price rejected strongly from this area (left blue circle).
This zone has acted as major supply, but now price is retesting with bullish momentum.
🟢 Green Circles – Key Reaction Points
The first green circle marks a strong bounce from previous support (~106,000).
Second green circle shows resistance rejection, indicating it's a key pivot level.
🔶 Orange Zone (~104,000 - 106,500)
This acted as a demand zone during the correction (middle of the chart).
Price formed a double bottom within this zone, signaling bullish reversal (orange circle).
---
📊 Structure & Pattern:
Consolidation breakout from a horizontal range.
Forming higher highs and higher lows, showing bullish structure.
The blue arrow path shows expected price movement:
Minor pullback
Followed by breakout towards $110,349 target
---
🧠 Market Sentiment:
Strong accumulation near $106,000 suggests buyers are in control.
Price is gradually grinding higher into resistance with volume increasing (implied).
---
🧭 Conclusion:
Bias: Bullish
Entry Zone: Dips near $107,800–$108,000
Target: $110,349
Invalidation: Break below $106,500

Bitcoin/TiqGPT Setup1D Timeframe: The daily chart shows a bullish momentum with recent green candles indicating a strong upward push. The price is currently near the high of the recent range, suggesting potential resistance or profit-taking levels.
4H Timeframe: The 4-hour chart reveals a more detailed view of the bullish momentum. There are signs of a pullback with the latest candle forming a small body, which could indicate a temporary exhaustion in buying pressure.
1H Timeframe: On the hourly chart, the price action shows a sharp decline followed by a recovery, indicating a volatility spike. This could be a reaction to a liquidity grab below prior lows, which is a common institutional maneuver to eliminate stop-loss orders before a directional move.
15M Timeframe: The 15-minute chart displays a recovery phase with the price moving upward steadily, suggesting that the earlier drop was likely a liquidity sweep.
5M Timeframe: This timeframe shows continued upward movement with consistent green candles, supporting the recovery narrative seen in the 15M chart.
1M Timeframe: The 1-minute chart shows a very granular view of the bullish momentum. The consistent upward ticks suggest strong buying interest at these levels, possibly from retail following the institutional cue.
INSTITUTIONAL THESIS:
Institutions appear to be in a phase of accumulation after a liquidity sweep, as evidenced by the sharp drop and subsequent recovery. The goal seems to be to push the price higher after successfully capturing liquidity below recent lows.
LEARNING POINT:
"1H Liquidity Sweep followed by a 15M and 5M bullish recovery indicating institutional buying pressure."
SIGNAL: BUY
SYMBOL: BTC/USDT ENTRY PRICE: $107,800 STOP LOSS: $107,400 TARGET PRICE: $108,600 CONDITION: Buy limit order post-1M confirmation of continued bullish momentum. RATIONALE: The setup aligns with a liquidity sweep followed by a bullish recovery across multiple timeframes, indicating strong buying interest. The entry is set above the current 1M high to ensure momentum continuation, with a stop placed just below the recent 1H low to minimize exposure to another potential liquidity sweep. STRATEGIES USED: Liquidity Sweep Recovery, Multi-Timeframe Bullish Alignment URGENCY: HIGH TIMEFRAME: Short-term CONFIDENCE SCORE: 85% RISK/REWARD RATIO: Calculated as follows:
Risk: $107,800 (Entry) - $107,400 (Stop) = $400
Reward: $108,600 (Target) - $107,800 (Entry) = $800
Ratio: 800 / 400 = 2:1

Skeptic| Cycle Mastery Part 1: HWC, MWC, LWC for Smarter TradingUnderstanding Higher Wave Cycle ( HWC ), Minor Wave Cycle ( MWC ), and Low Wave Cycle ( LWC ) is the key to making informed trading decisions, simplifying when to go long , short , or stay out . This Part 1 masterclass introduces these cycles, their relative nature, and how to align them with your strategy for precise entries and effective risk management . Let’s break it down. 📊
The Three Cycles: HWC, MWC, LWC
We trade across three market cycles:
HWC (Higher Wave Cycle) : The big-picture trend, like Bitcoin’s yearly uptrend.
MWC (Minor Wave Cycle): A medium-term trend, often an uptrend or corrective phase within the HWC.
LWC (Low Wave Cycle): The short-term daily trend, which can be range-bound, uptrend, or downtrend.
Knowing these cycles helps you decide when to e nter long, short, or avoid trading altogether, ensuring you align with the market’s rhythm.
Defining Your Cycles: It’s Relative
The main question before diving in: What timeframes are HWC, MWC, and LWC? The answer is relative—it depends on your strategy. Think of it like a temperature scale: 0°C isn’t “no heat” but a reference point (water’s freezing point). Similarly, your cycles are defined by the largest timeframe you analyze:
HWC: Your highest timeframe (e.g., Weekly for long-term traders).
MWC: The next level down (e.g., Daily).
LWC: Your shortest timeframe (e.g., 4-Hour or 1-Hour).
Ask yourself: What’s the largest timeframe I check? Set your HWC there, then scale down for MWC and LWC based on your trading style. This relativity ensures your cycles fit your unique approach.
While shorter cycles (LWC, MWC) form the HWC, the HWC’s power dominates, influencing smaller cycles. Let’s explore how to trade based on these relationships.
Trading Scenarios: When to Act
Scenario 1: HWC Uptrend, MWC Range
When the HWC is in an uptrend and the MWC is range-bound:
Action: Enter a long position on the first MWC wave when the LWC breaks the ceiling of the MWC range (e.g., a box breakout).
Why? The HWC’s bullish power supports the move, likely triggering an MWC uptrend. This makes the first wave a strong, low-risk entry.
Example: If the LWC (e.g., 4-hour) breaks the MWC range ceiling with a strong candle, you can confidently go long, backed by the HWC uptrend.
Scenario 2: HWC Downtrend, MWC Range
When the HWC is in a downtrend and the MWC is range-bound:
Action: Skip the first MWC wave. If the LWC breaks the MWC range ceiling, avoid going long—the bearish HWC could reject the move, resuming its downtrend.
Wait for the Second Wave: Let the MWC return to a range after the first wave. If the LWC breaks the range ceiling again, go long with confidence—the HWC’s influence is less likely to disrupt this second wave.
Risk Management Tips (if you trade the first wave against the HWC):
Reduce Risk: Lower your position size to minimize exposure.
Take Profits Early: Close the position or secure most profits (e.g., scale out) once you hit your R/R target, as volatility is high.
Wider Stop-Loss: Set a larger stop-loss to account for potential HWC-driven reversals, as stop-loss hunts are common in this scenario.
Adjusting Stop-Loss Size Based on Cycles
Aligned Cycles (HWC, MWC, LWC in Same Direction): When all three cycles align (e.g., all uptrend), set a tighter stop-loss relative to market conditions. Gradually scale out profits instead of closing the position, as the trend’s strength supports higher R/R (e.g., 5 or 10).
HWC Against MWC/LWC: If the HWC opposes the other cycles (e.g., HWC downtrend, MWC/LWC uptrend), use a wider stop-loss. The HWC’s power could reverse the LWC, lowering your win rate if stops are too tight. Expect volatility and plan accordingly.
Final Vibe Check
This Cycle Mastery Part 1 equips you to time MWC waves with precision, aligning HWC, MWC, and LWC for smarter entries. By mastering when to trade the first or second wave, you’ll avoid traps and maximize your edge. Part 2 will dive deeper with examples—stay tuned! At Skeptic Lab, we trade with no FOMO, no hype, just reason. Protect your capital—stick to 1%–2% risk per trade. Want Part 2 or another topic? Drop it in the comments! If this guide sharpened your game, hit that boost—it fuels my mission! 😊 Stay disciplined, fam! ✌️
💬 Let’s Talk!
How will you time your MWC waves? Share your thoughts in the comments, and let’s crush it together!

BTC/USD Technical Analysis – Weekly Elliott Wave StructureIn this video, we analyze the weekly chart of Bitcoin ( BYBIT:BTCUSDT ) using Elliott Wave theory.
The current structure suggests the beginning of a new bullish impulse (waves 0, 1, and 2) following a clearly completed and technically correct corrective phase.
We explore potential impulsive scenarios starting from wave 2, using Fibonacci extensions to project possible targets and identifying key support zones and invalidation levels.
This analysis aims to provide a macro perspective based on price action, helpful for traders and investors following BTC from a medium- to long-term technical view.
🛑 Disclaimer: This content is for educational and informational purposes only. It does not constitute investment advice. Each user is responsible for their own trading decisions.

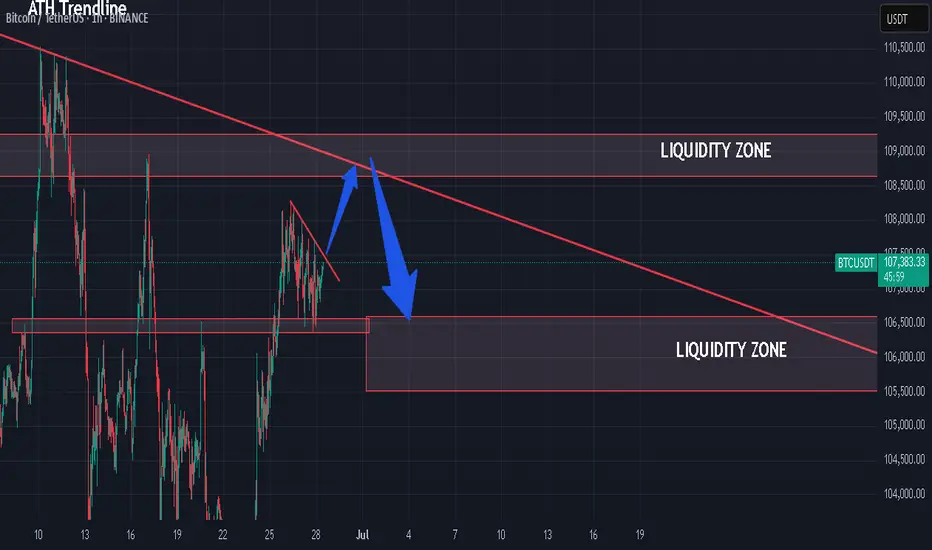
BTCUSDT 30min Breakout Retest | Micro Wedge into Macro ConfluencBTC 30m chart shows ascending wedge, followed by a bullish retest of prior resistance (now support ~107.4K). Price now consolidating just under diagonal resistance near 108.8K. EMAs are aligned bullish, volume surged during the breakout, and remains elevated—suggesting further upside potential.
🔄 Higher Timeframe Confluence
4H: Price pressing upper boundary of a rising wedge within a larger symmetrical pattern. Trendline pressure is real—either breakout above $109K or fade to $106.5K–$105K retest.
1D: Third touch on descending trendline from previous swing highs. Momentum building, and candles holding above EMAs. Breakout above $109.2K can trigger a move to $112K–114K (red expansion zone).
1W: Still inside a macro bull flag. Support from the 20 EMA is firm. Weekly close above ~$110K = confirmed flag breakout with target above $120K.
⚠️ Key Levels
Immediate Resistance: 108.8K → 109.2K → 110K
Support Zones: 107.4K → 106K → 104.5K
Bullish Targets: 110.8K → 113.5K → 114.8K
Invalidation (Short Bias Trigger): Break below 106K on volume
📌 Idea Summary
Micro breakout (30m) leading a potential macro breakout (4H/1D/W). Bulls control short-term trend. Eyes on volume follow-through above $109K. Rejection = potential revisit of 106K. Consolidation under resistance = breakout watch.

BTCUSDT 30min Breakout Retest | Micro Wedge into Macro ConfluencBTC 30m chart shows clean ascending wedge, followed by a bullish retest of prior resistance (now support ~107.4K). Price now consolidating just under diagonal resistance near 108.8K. EMAs are aligned bullish, volume surged during the breakout, and remains elevated—suggesting further upside potential.
🔄 Higher Timeframe Confluence
4H: Price pressing upper boundary of a rising wedge within a larger symmetrical pattern. Trendline pressure is real—either breakout above $109K or fade to $106.5K–$105K retest.
1D: Third touch on descending trendline from previous swing highs. Momentum building, and candles holding above EMAs. Breakout above $109.2K can trigger a move to $112K–114K (red expansion zone).
1W: Still inside a macro bull flag. Support from the 20 EMA is firm. Weekly close above ~$110K = confirmed flag breakout with target above $120K.
⚠️ Key Levels
Immediate Resistance: 108.8K → 109.2K → 110K
Support Zones: 107.4K → 106K → 104.5K
Bullish Targets: 110.8K → 113.5K → 114.8K
Invalidation (Short Bias Trigger): Break below 106K on volume
📌 Idea Summary
Micro breakout (30m) leading a potential macro breakout (4H/1D/W). Bulls control short-term trend. Eyes on volume follow-through above $109K. Rejection = potential revisit of 106K. Consolidation under resistance = breakout watch.

BTC/USDT high win scalping signals in 15 minutes are as follows- Signal: SHORT
- Admission: 107,480 ~ 107,620
- Take Profit: 107,100, 106,860


BITCOIN TRAVELLING NORTH In the wee hours of Sunday we got a BOS indicating a strong bullish movement to the upside.
BINANCE:BTCUSD
Proper risk management is advised.

6HR CPR StratMultiple examples of trending price action using the 6Hr CPR Start, combining with momentum ribbons using PAR.

BTC Breakdown Stp Bearish triangle Sell below $60.5k target 58k$Chart Overview:
Asset: BTC/USDT (Bitcoin)
Chart Type: Candlestick
Timeframe: Likely intraday (short-term, possibly 15m or 1h)
Indicators/Tools Used:
Trendlines
Support/Resistance levels
Pattern formation (possible descending triangle)
---
Technical Analysis:
🔻 Bearish Bias (Sell Signal):
Pattern: A descending triangle pattern is visible—typically a bearish continuation pattern.
Lower Highs: Indicates selling pressure increasing over time.
Flat Support Zone: Around $60,500–$60,600. Price is testing this zone repeatedly.
Breakdown Likely: If price breaks and closes below this support, a sharp drop can be expected.
---
📉 Put Direction: Sell BTC
Entry (Sell): On break below $60,500
Target 1: $59,200 (near previous consolidation zone)
Target 2: $58,000 (measured move from triangle)
Stop Loss: $61,000 (above descending trendline)
---
✅ Summary:
BTC is under pressure below resistance and forming lower highs.
If it breaks $60,500 support, a downward continuation is expected.
Strategy: Sell on breakdown, target $58,000 short-term.

Bitcoin's Growth Potential Intact Despite Short-Term UncertainyBitcoin has rallied to $108k after sweeping liquidity below $98k, driven by easing geopolitical tensions in the Middle East. The cryptocurrency's fundamentals and structural trends suggest room for growth, but it appears to have exhausted its momentum, entering a consolidation or accumulation phase. Technically, the 4-hour chart is limited, but a potential correction to $104k-$103k could occur before further growth. For now, traders can focus on short-term buys and sells in the $106k-$108k range, awaiting clearer direction.


BTC Trade Setup 28.06.2025 BTC Possible Trade Setup.
Entry 108.600 - 109.000
TP.1 106.500
TP.2 105.500
SL 110.000
its my own analysis, i am not liable of any loss.
BTC - Its Constipated!This is BTC 4H SVP
Birds eye view says its just negating all moves, neither down or tops,
In simple words: right now BTC is stuck in a tight box. If it breaks down, we may see a fast drop to $106,000. If it breaks above $107,600, it may go higher. Until then, avoid entering blindly and wait for one side to win.
Chances are way higher for it to move up! Hoping to make EQH and a small fall.

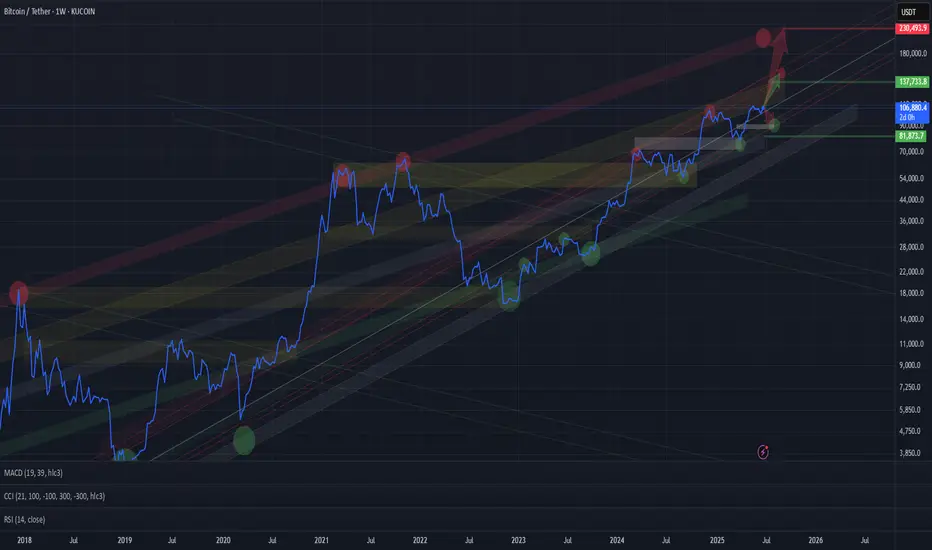
BTC BTC/USDT LONG_TERMChannels are drawn, long-term targets are clear. The upper extreme visible so far is around $200K for Bitcoin — possible within this cycle.
More realistic targets for this cycle are around $135K.
In the short term, a correction to the lower red channel zone ($88K–94K) is possible.
Watching closely.
BTC - A New Oregon Trail or Fool's Gold?The ranch hand (chart) reckons Bitcoin hit a big wave‑3 peak, then swung into a corrective wave‑4 saddle.
Now it's circling the watering hole, teetering around a key resistance near $110k—the cowboy‑critical line in the sand.
If that line holds strong, expect another surge—an “inverse wave‑4, strong 5” push higher toward $115–120k.
But if it buckles, a darker scenario’s afoot: a red‑inked, five‑wave drop galloping down toward $85k.
Bottom line: keep your hat on—$110k is the frontier. Break above that, and the herd’s heading north; if not, saddle up for a ride downhill.
BYBIT:BTCUSDT.P
BITSTAMP:BTCUSD

Are we out of the woods? BTC has been trading above the golden pocket for three consecutive days. This should give us a technical target of at least 110k, where the next major resistance lies.

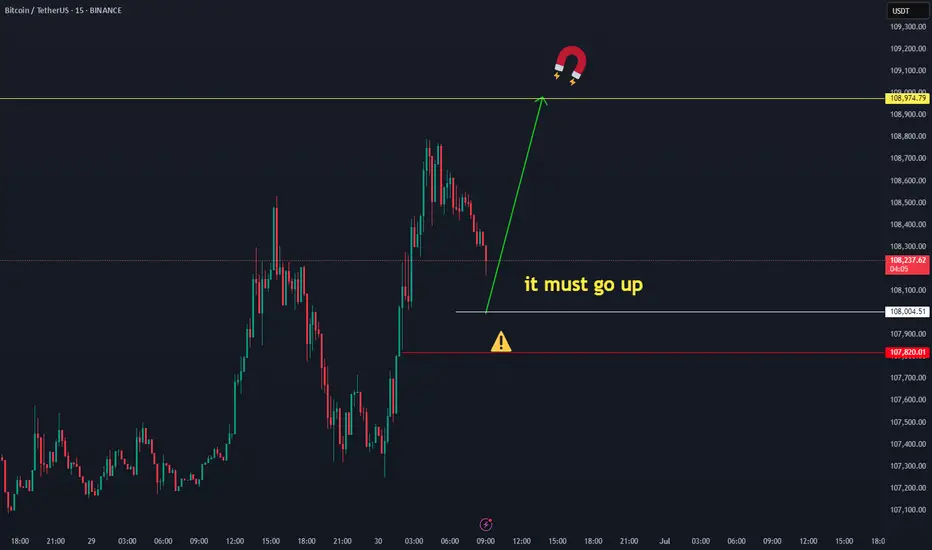
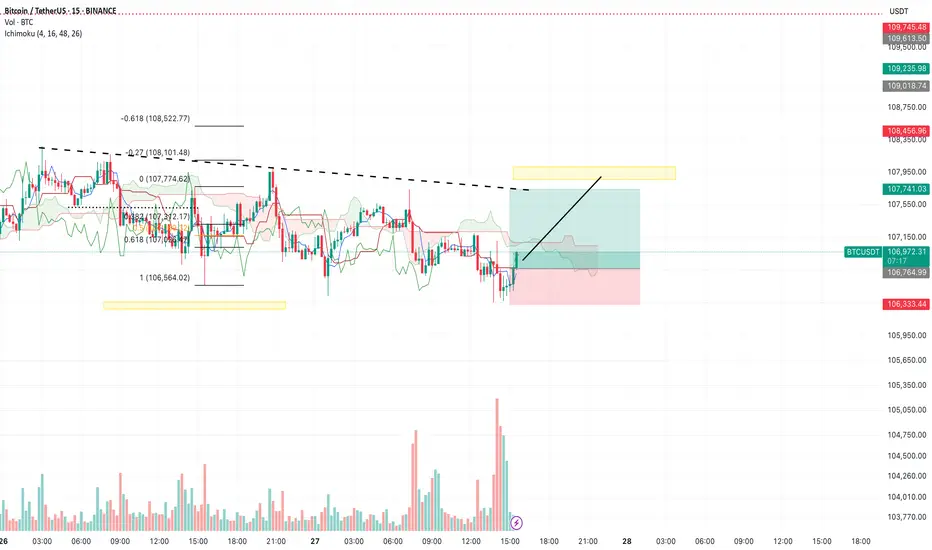
BTC/USDT – Intraday Plan (15m, Ichimoku) by RiscoraToday’s idea:
We’ve seen strong volume at the current support zone. My expectation is for a move upward towards the yellow block at 107,900, targeting liquidity that has accumulated above the dotted trendline.
This is my main scenario for today: a range-bound session with a liquidity sweep to the upside. Watching for reaction as price approaches the yellow zone.
#BTC #Crypto #Trading #Ichimoku #Riscora
BITCOIN - SHORT OPPORTUNITY AND LACK OF MOMENTUMBINANCE:BTCUSDT has been lacking momentum in the last few days. It looks to me that "Good News" is almost "No News" in regards to the Iran war or any crypto legislation. Summer is looking a lot like sideways movement, and due to the previous explosion in momentum and volume, I think the lack of it will bring the price down in the following days or weeks.

BTC 1W ideaLooks like Bitcoin is in the middle of the distribution which targets at $160k. Flag pattern.
