Played it perfectly: grabbed long liquidity and rode down to ourHey everyone!
Move unfolded exactly as we planned:
Minor price spike – a classic false breakout to collect liquidity in the long zone.
No valid short formation, so I stayed sidelined during that spike.
Once long liquidity was swept, the market reversed sharply downward—right toward our objective.
Price then steadily slid to our lower target, closing the trade with the planned profit.
📊 Key takeaways:
Don’t force entries without clear setups.
Liquidity grabs in line with your overall scenario are powerful signals.
Patience and discipline remain the ultimate edge.
What are your thoughts? Share your experiences with similar liquidity hunts!
BTCUSDT.5L trade ideas

NEW BTC HIGHS?BTC just broke a previous resistance zone. Previous data indicates a more upward push.
This may even lead to new highs.
$BTC Breaks Out $110K in Sight?CRYPTOCAP:BTC has broken out of its descending channel and is now trading around $105K.
This breakout signals a potential trend reversal, with a projected move toward $111K.
Holding above the breakout zone could confirm further bullish momentum.
DYRO, NFA

Is BTC having War INDUCED PA? - 110k?
Owing to this the movement has been commenced due to the ceasefire! Whats next?
The move can be seen on the bit up 106,500 can be eyed, just expect a bit

BTC is the champion our portfolio needs. BTC has some work to do. Either it will correct for a nice confrimatio low or strucure out for a bull fag. Either way, the price remains within a downward-sloping channel. That keeps me neutral bullish. But until I see a pivot point structure with signs of divergence in oversold conditions, it's difficult to get a proper RR.
Full TA: Link in the BIO

Markets Rally as Iran’s Strike Falls Short of Expectations🟢 Markets Rally as Iran’s Strike Falls Short of Expectations
One key point here is that global markets were bracing for a much more severe response from Iran toward the U.S. But when the actual attack turned out to be less intense than expected, risk assets — including crypto and stocks — started to climb, while oil prices dropped. Normally, heightened tensions in the Middle East would push oil prices higher, but this time, the opposite happened.
Another important factor is Bitcoin’s exchange outflows. As I’ve mentioned before, BTC leaving exchanges is a bullish sign — it means fewer coins are available to sell, which can fuel quick upward moves when a long trigger appears.
📍Wait for a clean long setup, and avoid emotional trades.
---
💬 Do you think the market is reacting rationally or emotionally right now? Drop your thoughts in the comments!

btc dirrectionnow days btc was bleeding much but to day was was recovering little as you see my last analyst it approaches the exact direction and I hope the coming days will go as I will insh Allah be ready for big bull run after it finish the last liquidity swept

A bearish trend is gradually taking shape.From a technical perspective, the complete breakdown of the box bottom, coupled with the MACD indicator about to fully crossing below the zero axis, both indicate that bullish momentum is weakening and a bearish trend is gradually forming. Short-term bulls need to take a temporary break and wait for the construction of a stabilizing platform. For bears, according to the current trend, they can lay out short positions on rallies. The ideal entry position is near the lower edge of the box, and they can try to lay out positions boldly after setting stop-losses.
On the news front, "Laote"'s policies change frequently, with extremely high uncertainty. The market needs global stability, and there has been no bull market in history built in a turbulent environment. Therefore, we need to treat market conditions cautiously, avoid blind and radical operations, and only by maintaining rationality can we respond to market changes.
you are currently struggling with losses,or are unsure which of the numerous trading strategies to follow,You have the option to join our VIP program. I will assist you and provide you with accurate trading signals, enabling you to navigate the financial markets with greater confidence and potentially achieve optimal trading results.
Trading Strategy:
sell@102300-102800
TP:100000-100500

BTC comleted wykoff with retest of sowJudging by 4h analysis, BTC completed wykoff with retest of sow and is getting completely obliterated now. Get out while you can! X_X

BTCBTC is currently trading within an 8H short FVG. For continued upside, a clean inversion of this zone is required.
Failure to flip this level may trigger a corrective move toward the $93K–$98K range. Monitor price action closely — confirmation is key.

Major Support Confluence, Tactical Rebound or Looming Flush?__________________________________________________________________________________
Technical Overview – Summary Points
__________________________________________________________________________________
Momentum: BTC is working a major daily support zone (102.6–103k USDT) with strong confluence across 1D, 12H, and 2H pivots. Technical rebound in play, but still no strong behavioral catalyst.
Supports / Resistances: Key support clusters at 102.3–103.3k (2H, 720min, daily pivots). Main resistances: 106.4k–110k.
Volume: Very high on 2H/1H near supports, hinting at possible washout/profit-taking. No buy climax identified.
Risk On / Risk Off Indicator: Strong bullish signal from 1D to 30min (neutral on 15min), while lower TFs remain under selling pressure.
Multi-TF Behavior (ISPD DIV): No excess or euphoria: market is waiting/compressed, caution is necessary in the short term.
__________________________________________________________________________________
Strategic Summary
__________________________________________________________________________________
Global Bias: Tactical bullish but cautious — confirmation on clean rebound needed to strengthen conviction.
Opportunities: Technical entries in the 102.6–103.3k zone with stops below 102k (aggressive) or 97.5k (defensive). Profit-taking zones at 106.4k/109.9k/110k.
Risk Areas: Invalidated below 97.5k (swing), potential flush down to 94k/88–89k. Heightened vigilance around macro releases.
Macro Catalysts: PMI prints (June 23), Fed on pause, increased geopolitical risks (latent volatility and cross-asset caution).
Action Plan: Prioritize active management: reduced position sizing, mechanical stops, and real-time bias adjustment based on volume and behavioral response.
__________________________________________________________________________________
Multi-Timeframe Analysis
__________________________________________________________________________________
1D–12H: Major supports (D Pivot Low 102626.8), structural uptrend, strong Risk On signal, but no behavioral/volume extremes.
6H–4H: Ongoing technical rebound, moderately high volume, support confluence, BUT short-term TF pressure remains.
2H–1H: Very high volume at support, possible local flush, but still no bullish behavioral confirmation—monitor for rapid volatility.
30min–15min: Tentative stabilization post-support absorption, no clear psychological excess, risk of further downside if rebound not confirmed; Risk On / Risk Off Indicator is neutral at 15min.
Summary: Bullish structural setup, but fragile micro dynamics—discipline and speed are key.
__________________________________________________________________________________
Fundamental & On-chain Overview
__________________________________________________________________________________
External factors: Fed on hold, US inflation slightly higher, robust economy, increased geopolitical risks (hot spots Israel–Iran, Ukraine–Russia). Latent risk-off sentiment but not yet materialized.
Calendar to watch: June 23, 09:45–10:00 UTC (US PMI & home sales).
On-chain: Low user activity, high institutional volumes, off-chain flow dominance, leverage high (mostly in stablecoins, limiting crypto-margined liquidation spirals), no euphoria or panic detected.
Risk/reward synthesis: Key technical buy zone 102.6–103.3k (stop < 102k/97.5k), targets 106.4k/109.9–110k. Below 97.5k: bearish bias, defensive risk management needed.
__________________________________________________________________________________
Final strategic synthesis
__________________________________________________________________________________
BTC remains "structurally strong but tactically fragile": major support confluence and bullish sectoral signal, but persistent micro selling pressure and macro/cross-asset uncertainty. Only entries on clear technical signals, mechanical stops and active risk management offer rational short-term setups in this volatile and compressed environment.
__________________________________________________________________________________

BTCUSD 4HThis chart presents a bearish setup for Bitcoin (BTC/USDT) on the 4-hour timeframe, shared by "Alpha_Gold_Trader." Here's the key breakdown:
---
Chart Breakdown
Current Price: Around $105,857
Resistance Zone (Register Point Level): ~$109,000 to ~$111,500
Support Zone (Breakout Level): ~$106,500 to ~$107,500 (pink box)
Bias: Bearish (implied by breakdown and downward projection)
Price Target: Around $95,000, labeled as "TARGET SUCCESSFUL"
---
Technical Implication
Price has broken below the support zone marked in pink.
A retest of broken support is anticipated before continuation down (common in breakout setups).
The setup suggests a short trade if price fails to reclaim the broken support and confirms rejection.
---
Trading Strategy Outline
Entry: Near $107,000 (on failed retest)
Stop Loss: Above $108,500 (back in the previous range)
Take Profit: ~$95,000 (target zone)

The end of Triangle?If yes, trend is over.
But, not sure where is the end of triangle.
06/17 or 06/20?
We should check this through analyzing afterward movements.
Low probability that it was not triangle.
If it wasn't, big ending diagonal will be made.
It means there will be more dip but high potential to make new ath(historical top/reversal point).
Let's check trend line/channel of these posts.
Checking retest is the key.
Still, short position has attractive price points.

Bitcoin Still Bullish Above $93K — Don’t Trade with Emotion🟢 Bitcoin Still Bullish Above $93K — Don’t Trade with Emotion
I still believe Bitcoin is in a bullish trend as long as it holds above $93,000. The recent drop seems mostly driven by external factors and geopolitical uncertainty. If Iran responds to the U.S. or closes the Strait of Hormuz, there’s a strong chance this short-term downtrend could continue.
But here’s the key: don’t trade emotionally. If you’ve bought spot positions and your stop-loss was hit, it’s okay to exit. You can always re-enter later when conditions improve. The most important part is to trust your analysis and the stop you originally set.
As for futures, I’m personally not trading right now — the market is too reactive to headlines. However, I’ve noticed BTC outflows from exchanges have increased, which is often a bullish long-term sign. This means the price can recover just as fast once fear subsides.
📉 In uncertain times, patience is a strategy too — sometimes watching is better than chasing trades.
---
💬 What’s your take on Bitcoin during this geopolitical mess? Let me know in the comments — I’d love to hear your thoughts. 👇

BTC outlook Just as analysed , Bitcoin delivered nicely , and still delivering, now we expect to see a full drop to 74k

BTC: Bias Map 22/06/25Previous Week:
BINANCE:BTCUSDT BINANCE:BTCUSDT.P
Bias:
Spot buyer within 93.5k–88k BTC zone. This is the key support region
Structure:
- Weekly fair value gap sits between 93.5k–88k
- Still trending lower, no reversal yet confirmed
- Weekly has swept previous ATH and rejected without displacement
Plan:
- Watch for Bitcoin to move into 93.5k–88k
- No trading Monday - sitting flat
- Iran’s retaliation risk still unpriced — major global risk looming
- Structure or weekly reaction will determine next steps
Macro:
- Global risk extremely elevated with increased escalation risk from a potential Iranian response
- Risk assets like crypto are broadly unattractive in this environment
- Capital preservation is still critical
A key issue I dislike about this structure is the similarities it shares with the 2021 bull run, where we swept previous ATH, failed to displace and then rejected and moved -77%
I do not think we will see a -77% move however but a scenario where this shares similar structure and we visit the 70-60s is without doubt a clear probability and one that must be acknowledged
This week will be absolutely critical to be patient and watch how the middle east situation evolves. We are heading into a potentially very dangerous and uncertain era so caution is critical

BTCUSDT LONG POSITIONENTRY: 106206.92
TAKE PROFİT : 109798.83
STOP LOSS : 1/3
Do not use high leverage!
Remember cash management (planning)!
Please follow the stop-loss rule!

#BTC bearish cup-handle structure, beware of a pullback!📊#BTC bearish cup-handle structure, beware of a pullback!
🧠From a structural perspective, we broke below the neckline, which means a bearish structure is established, so we need to be wary of further declines.
➡️Yesterday's decline was rapid, so we can wait for a rebound to appear and look for shorting opportunities near the blue resistance area or the downward trend line.
➡️Since it is the weekend, the trading volume may be less. If there is no rebound, then we need to wait patiently for a period of sideways consolidation before looking for shorting opportunities.
⚠️Note that the area around 106500 is a support-resistance conversion zone. If it breaks through here and stabilizes, we can remain optimistic.
🤜If you like my analysis, please like 💖 and share 💬 BITGET:BTCUSDT.P

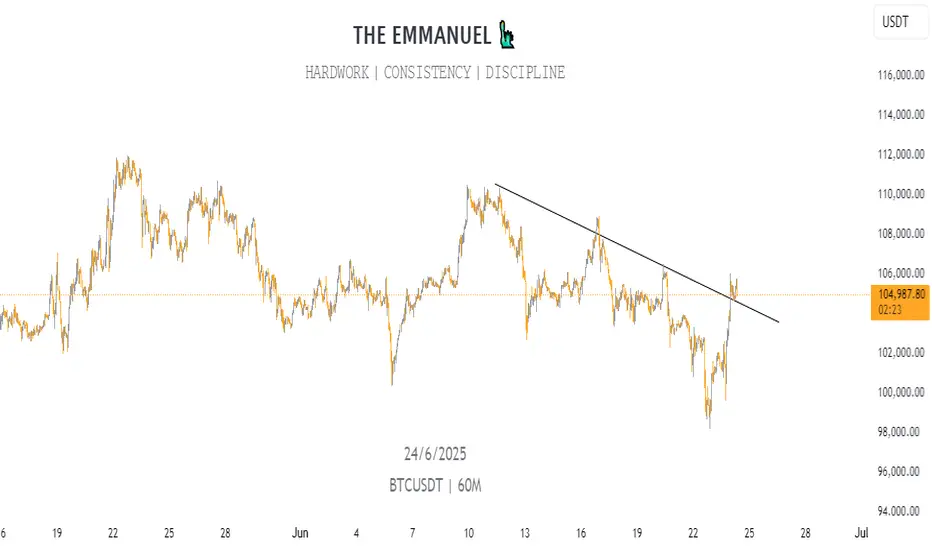
BITCOIN BEARISH SETUPTechnical Analysis Summary:
Pattern Formation: The chart shows a descending triangle pattern with double tops, indicating bearish pressure at resistance levels.
Breakdown Confirmation: Price has broken below a key ascending trendline (shown in dashed line) and retested the breakdown area, forming a bearish rejection (highlighted red zone).
Key Zone: The price is currently trading around $105,075, just under the previous support-turned-resistance zone (~$106,000). This confirms a failed bullish structure and strengthens the bearish outlook.
Targets:
First Target: Around $101,000–102,000, aligning with the next visible support zone.
Second Target: Around $97,000–98,000, which is a major support / key zone based on prior structure.
Bias: Bearish in the short term, as long as price remains below the $106,000 resistance zone.
Trade Setup Outlook:
A short position is implied by the arrows.
Best entries are around retests near $105,500–106,000 with stops above the recent highs (~$107,000).
Conservative profit-taking at the first target, with extended TP near the key support zone.

bitcoin update as reacted market is now at a key support level of 101k.
market will now might give a dead cat bounce till 104-105k max, a scalp long can be taken with cautious, one bad news and that ded cat bounce will die with the market.
stay safe everyone.

Today's BTC trading strategy, I hope it will be helpful to you Analysis of Market Dynamics Under Geopolitical Conflicts
The current conflict between Iran and Israel has entered a critical phase of "reciprocal retaliation". In the early morning of June 22, Iran launched missile strikes on Israel, targeting military command centers and nuclear R&D facilities in Tel Aviv, while Israel carried out multiple rounds of airstrikes on missile bases in western Iran. This high-intensity mutual bombardment has broken the "limited retaliation" pattern of previous regional conflicts. Iranian Supreme Leader Ayatollah Ali Khamenei explicitly stated the intention to "completely destroy the Israeli regime", indicating a real risk of further escalation.
The U.S. stance in this conflict has become a key variable. While President Trump said it "may take two weeks to decide whether to join the war", he also emphasized that "it's hard to ask Israel to stop attacks", an ambiguous stance that has intensified market uncertainty. Notably, Iran has ruled out the possibility of nuclear talks during the conflict, and the breakdown of diplomatic channels has made military confrontation the only option—this could lead to geopolitical risk premiums persisting in asset pricing.
Historical experience shows that Bitcoin's performance in geopolitical conflicts features "short-term volatility, medium-term divergence". During the Iran-Israel conflict in April 2024, Bitcoin plunged 7% within an hour, but it rose 5% against the trend after the U.S. airstrike on Iran in 2020. The current market's uniqueness lies in that Trump signaled "possible military action" before the conflict, giving the market a digestion period—thus, Bitcoin only fell 4.5% after the conflict broke out on June 13, showing stronger resilience than in 2024. However, if the U.S. officially enters the war, it may trigger panic selling similar to the early stage of the 2022 Russia-Ukraine conflict, which requires high vigilance.
Bitcoin's current price of $102,500 is facing a dual test of geopolitical conflict and technical resistance. The reciprocal retaliation between Iran and Israel has not ended, and whether the U.S.参战 (enters the war) will determine the direction of market sentiment. Technically, whether the $103,000 resistance level is broken will guide short-term trends. Investors need to distinguish between short-term emotional shocks and long-term trend forces—geopolitical conflicts may cause short-term volatility, but the de-dollarization trend and the stability of institutional holdings provide long-term support for Bitcoin.
In terms of operations, it is recommended to adopt a strategy of "light-position trial + flexible hedging": do not blindly chase breakouts, nor ignore pullback buying opportunities. Remember: in the fog of geopolitics, real opportunities often lie at the intersection of market panic and rationality, and risk control is always the first principle of investment.
Today's BTC trading strategy, I hope it will be helpful to you
BTCUSDT BUY@101000~102000
SL:99500
TP:103000~104000

Where is the local bottom? BTC has decided to dip further, retraced to daily support and is probably going for liquidity at 100.3k.

BTC/USDT – Technical Outlook:
📊 BTC/USDT – Technical Outlook
🗓️ Published: June 21, 2025 | 🕰 Timeframe: H4
🔻 Market Sentiment: Bearish
The BTC/USDT pair is currently exhibiting strong bearish momentum after a failed breakout above the 106,000 resistance level. The price has sharply declined and is now trading around 103,485 USDT, confirming a breakdown from the consolidation phase.
🔍 Key Technical Highlights:
Ichimoku Cloud Analysis:
Price is trading below the Kumo, indicating a bearish trend continuation.
The future cloud is thick and red, reinforcing downside pressure.
The Chikou Span (lagging line) supports the bearish outlook.
Structure & Volume:
Market structure has shifted to lower highs and lower lows.
A visible volume gap exists between 103,000 and 101,000 – suggesting price could drop quickly into the next demand zone.
Support & Target Zone:
Strong demand zone identified between 100,000 – 101,000 USDT.
This area previously acted as a high-volume accumulation zone.
Projection Path:
Based on price action and market momentum, a continued move toward the 100K psychological support is likely.
🧠 Professional Insight:
"The breakdown below the cloud and recent support level confirms seller dominance. As BTC loses strength below 104K, we anticipate a potential drive toward the 100K demand area, where buyers may re-enter."
📌 Strategic Trade Setup (Not financial advice):
Short Entry: Below 103,200
Target: 100,000 – 101,000
Stop Loss: Above 104,900 (just above the cloud)
Risk/Reward: Optimal 1:2+
