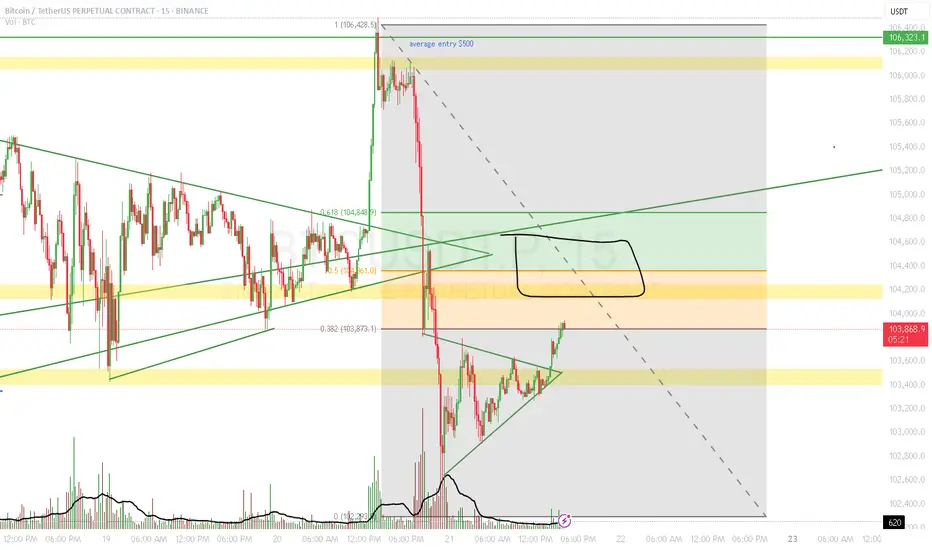
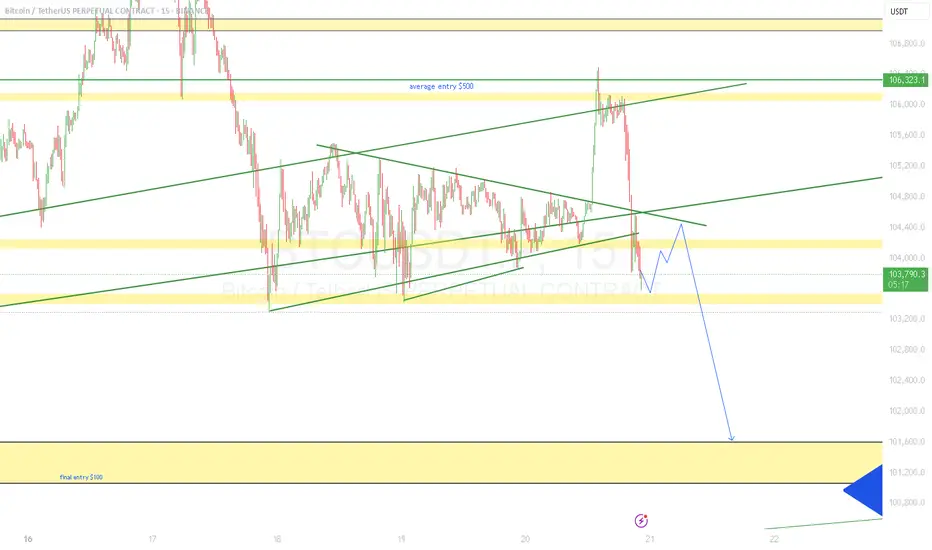
bitcoin update price broke the symmetrical triangle and moving up slow
but this false pump wont last long.
price just going to tap the fib level of 0.5 to 0.618 and might go a bit up just to trap longs.
i personally will enter short once we tap and reject 0.618.
thanks
BTCUSDT.5L trade ideas
$BTC 50 EMA Analysis – Daily Timeframe Price is currently hoverCRYPTOCAP:BTC 50 EMA Analysis – Daily Timeframe
Price is currently hovering just above the 50 EMA (blue line), which sits around $103,164, while BTC trades slightly higher at $103,774. Historically, as shown by the chart, BTC has respected the 50 EMA as dynamic support in uptrends and resistance in downtrends. Recent touches on the 50 EMA have triggered bounces, indicating it's a strong technical level.
🔸 Key Support Zone at $103,000 – $102,000:
If BTC holds above this zone, continuation toward previous highs is likely.
🔸 Upside Target: $108,000 – $110,000
Should the 50 EMA act as a springboard again, BTC could retest recent highs.
🔸 Risk Level at $101,500:
A daily close below this level may invalidate the bullish structure and trigger a deeper correction.
🔸 Outlook:
Watch for confirmation of a bounce above the 50 EMA. Bullish entries can be considered on strong daily candles above the moving average with tight risk management.

BTCUSD its BTCUSD taking for buy and i will like to follow according to my setups for buy and i will explain once i see and finish loading this first image since 2020

BTC 4H SCALPBTC/USDT Scalp Setup – 4H Chart
Entered a scalp position with TP1 aligned at the Fibonacci extension near 105,652. The first take-profit has been secured, and the remainder of the position is being left to ride — no emotional attachment. If invalidated, the trade will be abandoned without hesitation.
Technical Overview:
Price broke out of the local downtrend channel
Watching for a potential green dot on the volume oscillator to confirm upward continuation
VMC Cipher B shows early signs of a shift; confirmation is still pending
That said, short-term caution is warranted.
Bearish Considerations:
On the higher timeframes, there’s a visible bearish divergence between price and volume — price continues to push higher, while volume fades, indicating a potential trend exhaustion.
Thanks for your support.
If you found this idea helpful or insightful, feel free to leave a like or comment, open to your thoughts and perspectives.

btc short now you have a very clear view of whats gonna happen
101k is inevitable. And if 101 dosent hold, 98 will be our balance point where market will go for making lower high and if price action changes we can go for a new ATH, which i guess will be our final ATH before we drop for a fresh new bear cycle.
thanks

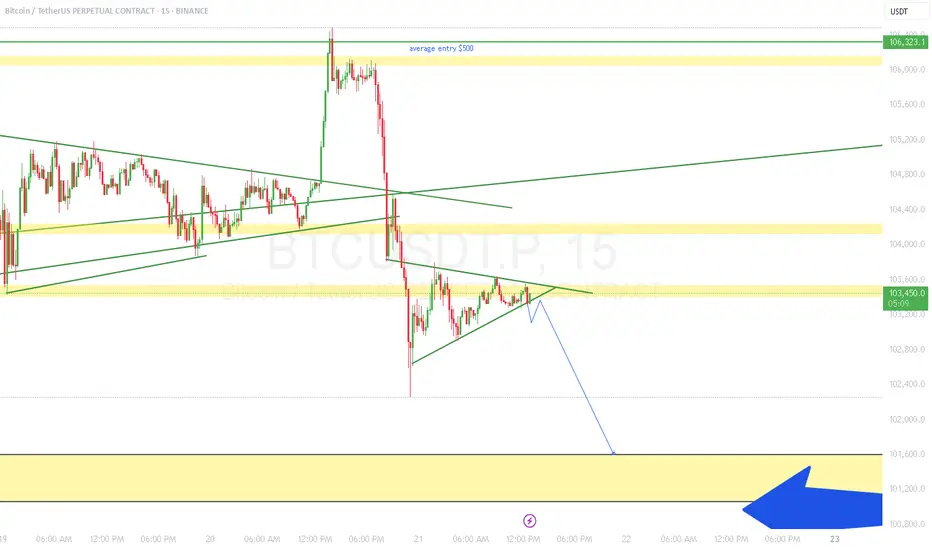
short bitcoin In my previous analysis i already gave a short target of 101k
which is about to come by this week
any short holders can hold their trade with SL above 104300
taking new shorts is a risky bet here, which is why ill opt out for this week and wait for further price for a clear view
dont go for longs cause market have no bullish sentiments
liquidity
news
fomc
everything is against btc at this pont
let market come at the support of 101 if it holds and all macro factors agree we can turn bullish
stay safe trade cautious
thanks
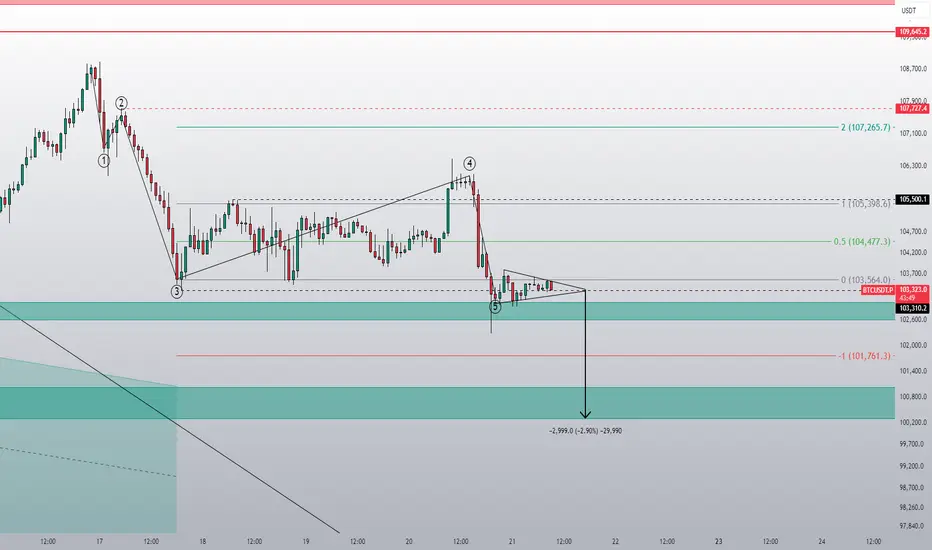
This is looking good!The liquidity at 103k has been taken and five waves have been completed. Now, we should be all set. In theory, at least.

BTC at 103K – Bounce or Breakdown?1. Overall Trend:
The chart is currently within a descending channel, indicated by two parallel downward-sloping trendlines. The price continues to fluctuate within the boundaries of this bearish channel.
2. Current Price Action:
BTC has just touched the lower green support zone (around 103,000 – 102,500 USDT) and is showing a slight rebound.
→ This suggests a potential recovery toward the nearest resistance zone.
3. Key Levels:
✅ Nearest Support Zone:
103,000 – 102,500 USDT → The price is currently bouncing from this area. If this zone holds, a short-term rebound toward resistance is likely.
🟥 Nearest Resistance Zone:
105,000 – 106,500 USDT → This zone has repeatedly rejected price advances in the past. Watch closely as price approaches this level.
🟪 Major Upper Resistance Zone:
Around 107,000 – 109,000 USDT → If price breaks above the red zone, this will be the next target.
4. Potential Scenarios:
🔹 Scenario 1 (Bullish):
If BTC holds the 103K support and breaks above the descending channel → price could aim for 105K – 106.5K. If that level is breached, the next target may be 107K – 109K.
🔸 Scenario 2 (Bearish):
If the 103K support breaks → price may fall deeper toward the lower green support zone (around 101,500 – 100,500 USDT).
🎯 Summary:
Short-term trend remains bearish.
Price is reacting at support → a rebound is possible.
Need confirmation from volume and candlesticks to determine if the current downtrend can be broken.
Don't forget to like – follow – and share if you find it useful!”😁😁😁

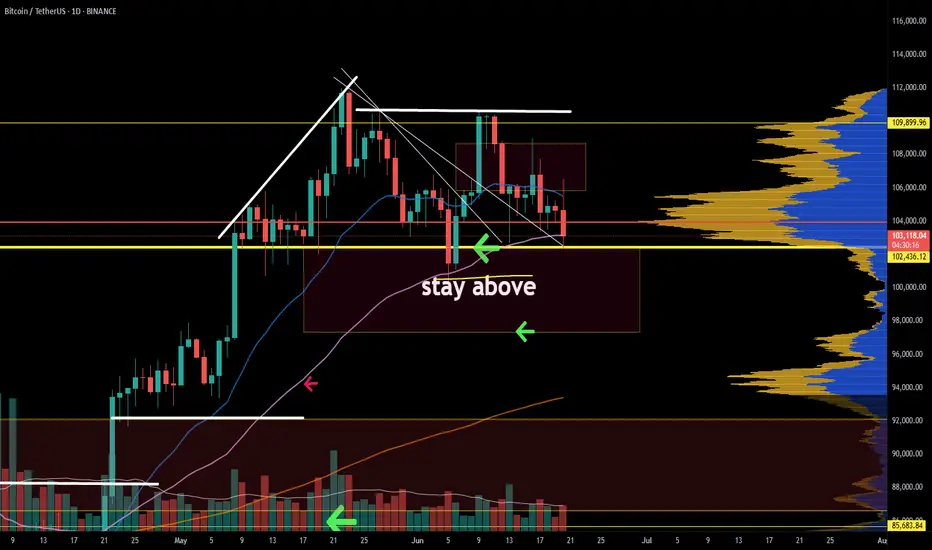
Bitcoin Holds Strong as Market Consolidates — No Bearish DivergeUpon analyzing CRYPTOCAP:BTC price structure across multiple timeframes, I don't see any bearish divergence at the moment. Instead, the chart continues to print a series of bullish formations, including inverse head and shoulders patterns, signaling continuation of the macro uptrend.
The current movement between $100,000 and $109,000 appears to be a classic case of a choppy or ranging market — in simpler terms, a bullish consolidation phase just below resistance. This kind of sideways price action, especially after a significant rally, often serves as a base for the next breakout leg.
Despite geopolitical tensions like the Iran-Israel conflict, Bitcoin remains remarkably resilient. If such macro-level risk had any real impact, BTC would likely have already broken below the $100K mark. Instead, the price is holding firm, which is another sign of strong bullish sentiment in the market.
The chart structure remains highly constructive — multiple bullish reversal and continuation patterns are playing out, and as long as BTC holds above the $98K–$100K support zone, the broader trend remains intact. This ongoing consolidation below all-time highs is a healthy sign of strength —

$BTC - Protected LowBINANCE:BTCUSDT | 1D
Price got strongly rejected at 106.5k
It deviated below the 4-hour mini-range. We now need to see a reclaim of 105–105.1k. If not, a retest of the value area low at 101.4k is likely.
100k remains to be the protected low, and it would be critical if we won't get a valid retest at 101.4k
local resistance: 105-105.5k
local support: 101.4k
protected low: 100k

BTC Squeezed to the Edge – Will $102K Support Hold or Crack?Bitcoin is pressing into the apex of a descending triangle, anchored at $102K. Volume is drying up, EMAs are compressing, and liquidity pools sit just below. This structure rarely resolves quietly — a volatile breakout is imminent.
🔻 Bearish Case (Primary Bias):
Breakdown below $102K = short trigger
Targets: $98K → $94K
Stop: Above $106K
Confluence: Bearish pattern + volume dry-up + liquidity below
🟢 Bullish Reversal (Alternate):
Breakout above $107.5K = short squeeze likely
Flip bias only if trendline is reclaimed on volume
🎯 Final Take:
BTC is at a decision point. Don’t trade the bias — trade the breakout. Volatility is coming. Be ready.
📣 What’s your setup? Breakdown or fakeout rally? Share below!


BTC has made the perfect market conditions for a trade. BTC setup is very clear. Why? Because the structure is clear. The current price is an inflection point; both bears and bulls are watching to make their next move. May the strongest of the two prevail. 95k or 110k?
Full TA: Link in the BIO
Btc seizes the opportunity to trade with the trendTechnical analysis of BTC contract on June 20:
Today, the large-cycle daily level closed with a small negative line yesterday, and the K-line pattern was a single positive line with a continuous negative line. The price was below the moving average, and the attached indicator was dead cross and running downward, but we should note that the overall volatility this week was not large, and the fluctuation was in a small range. So we should pay attention to keeping short-term trading and closing profits in time. Don't hesitate, drag, and don't think about a big rise or fall. After a large drop on Tuesday this week, the short-term hourly chart has entered a small range of fluctuations. There is no continuation or breakout, so we should just follow the trend. We have sold at the high point of 105,500 as a defense, and bought at 103,000 as a defense, for short-term trading.

$BTC Probable scenarios.I think the chart speaks for itself. Technical targets for both RSI and Price Actions are noted in the chart.

Evening BTC Market Analysis and Trading RecommendationsToday, U.S. markets are closed, leading to light trading activity and relatively limited overall market volatility. From a technical analysis perspective, the 4-hour K-line chart currently shows prices trading below the middle band of the Bollinger Bands, exhibiting a classic range-bound consolidation pattern. Bulls and bears are locked in a tug-of-war between key support and resistance levels, with K-line formations alternating between bullish and bearish patterns.
In terms of chart structure, the lower support zone has demonstrated strong buying conviction, while the upper resistance level has exerted clear restrictive force. Multiple failed upward breakouts have formed a short-term top. This box consolidation—characterized by resistance above and support below—is expected to sustain sideways trading through Friday.
Against the backdrop of no major positive catalysts, bearish momentum may gradually dominate if no substantial bullish triggers emerge. Maintain a trading strategy of selling into strength.
BTCUSDT
105000-105500
tp:104000-103000
Investment itself is not the source of risk; it is only when investment behavior escapes rational control that risks lie in wait. In the trading process, always bear in mind that restraining impulsiveness is the primary criterion for success. I share trading signals daily, and all signals have been accurate without error for a full month. Regardless of your past profits or losses, with my assistance, you have the hope to achieve a breakthrough in your investment.

CHECKL BTCUSDT SIGNAL READ CAPTAINEntry: around(102893.55)102653.66 ✅
Take Profit 101732.58✅
Take Profit 2: 101231.00✅
Last Target:100412.00 ✅
Stop Loss: 103304.27❌

BTCUSDT - 4H Supply-Demand + Order Flow ViewBINANCE:BTCUSDT is struggling to hold above the 103K zone, which has now flipped into resistance. Price recently tapped into the 104K–105K supply zone and faced rejection, confirming bearish pressure. The most recent short entry aligns with overhead liquidity absorption and weakness near the high-volume node (~105K) on the volume profile.
We're now revisiting the previous demand zone (101K–102K), which has held multiple times but is weakening. A breakdown below this level opens up the next major demand zone around 98.5K–99K and possibly 94K if momentum accelerates.
🔻 Bias: Bearish unless 104K is reclaimed.
🔍 Watching: Reaction at current support and volume cluster near 100K.
📊 Tools Used: S/D Zones, VWAP, Volume Profile, Confirmation Indicators.
📌 Trade safe. Set alerts and don’t chase.

BTC Testing Crucial Support – Breakdown or Bounce ?Bitcoin is currently testing a critical support zone around $103,573 – a break below could trigger a sharper move toward $101,400.
Price rejected from ~$105.8K
Support holding... for now
RSI dropping fast – now near 34 (1H TF)
Weakening momentum visible
This level is the last line of defense for bulls. If it cracks, expect volatility.
Watch closely. Break = panic or buying opportunity?
DYOR. Not Financial Advice.

btc short setupSL 10500
tp 102500
with ongoing world events and liquidations available at that range, its very much possible that bitcoin will and must tap 102 or lower for a creating fear and wiping retailers out. But short with caution might give fake outs to trap longs.
thanks
BTC- Bounce here or 93K incomingWhatever WTI does.. will determine what the Stock Market does.... which will determine what BTC does.. which will determine what all of Crypto does..

RangesReturning to range low form here is normal price action. Breakout to one side, breakout to the other, before the real breakout happens — most likely in the direction of the bigger trend, which is up.
